Species on the move: Stowaways and contaminants cause the greatest economic impacts
←
→
Page content transcription
If your browser does not render page correctly, please read the page content below
Species on the move: Stowaways and contaminants
cause the greatest economic impacts
Anna J Turbelin ( aturbelin@gmail.com )
Universite Paris-Saclay https://orcid.org/0000-0003-1572-5357
Christophe Diagne ( christophe.diagne@universite-paris-saclay.fr )
Universite Paris-Saclay
Emma J Hudgins
Carleton University Department of Biology, Ottawa
Desika Moodley
Czech Academy of Sciences
Melina Kourantidou
University of Southern Denmark
Ana Novoa
Czech Academy of Sciences
Philip J Haubrock
Senckenberg Research Institute and Natural History Museum Frankfurt
Camille Bernery
Universite Paris-Saclay
Rodolphe Gozlan
ISEM, Univ. Montpellier - CNRS - IRD
Robert A Francis
King's College London
Franck Courchamp
Universite Paris-Saclay
Research Article
Keywords: introduction pathways, InvaCost, invasive alien species, monetary impact, exotic mammals,
non-native insects, management, policy
DOI: https://doi.org/10.21203/rs.3.rs-440305/v1
License: This work is licensed under a Creative Commons Attribution 4.0 International License.
Read Full License
Page 1/26
Abstract
Introduction pathways play a pivotal role in the success of Invasive Alien Species (IAS) – the subset of
alien species that have a negative environmental and/or socio-economic impact. Pathways refer to the
fundamental mechanism that leads to the introduction of a species outside of its native range – marking
the beginning of all alien species invasions. Increased knowledge of pathways is essential to help reduce
the ow and impacts of IAS and ultimately improve their management. Here we use the InvaCost
database, a comprehensive repository on the global monetary impacts of invasive alien species,
combined with the CBD hierarchical classi cation of introduction pathways to address four key
questions: (i) Are particular IAS introduction pathways economically impactful? (ii) How are costs
taxonomically and spatially distributed across pathways? (iii) Are there differences in costs between
species introduced intentionally and unintentionally? and (iv) is there a relationship between the number
of possible introduction pathways of IAS and their costs? We found rst that both the total and average
cost of species introduced through ‘Stowaways’ (US$144.9bn; US$89.4m) and ‘Contaminants’ pathways
(US$99.3bn; US$158.0m) were more costly than species introduced primarily through ‘Escape’
(US$87.4bn; US$25.4m) and ‘Release’ (US$64.2bn; US$16.4m). Second, insects drove the costs of
unintentional introductions whilst mammals drove the costs of intentional introductions; ‘Stowaways’
had the highest costs in Asia, Central America, North America and Diverse/Unspeci ed regions, whilst
Antarctic-Subantarctic and Oceania incurred the greatest costs from species introduced through ‘Release’.
Third, the cost of species introduced unintentionally is more than double the cost of species introduced
intentionally ($192bn vs. $90bn). Equally, species introduced unintentionally cost more on average than
species introduced intentionally in terms of damage, management, and mixed costs. Finally, the total and
average cost of IAS was not related to their number of introduction pathways. Our ndings provide
important material for the targeting of priority pathways - something that will be critical in prioritising
limited management budgets to combat the current acceleration of species invasions.

Introduction
All alien species invasions begin with the intentional or accidental transportation of individuals or
propagules by humans outside of their historical biogeographic boundaries (Blackburn et al., 2011; Lehan
et al., 2013, Essl et al. 2015). Pathways refer to the fundamental mechanism that leads to the
introduction of a species outside of its native range. Consequently, pathways play a pivotal role in the
success of Invasive Alien Species (IAS) – the subset of alien species that have a negative environmental
and/or socio-economic impact – as they in uence the number, frequency and geographic range of
propagules dispersed (Pyšek et al., 2020). Increased knowledge of pathways is crucial to help reduce the
  ow and impacts of IAS (Leung et al. 2002, Essl et al. 2015) and ultimately improve their management
(Simberloff and Rejmanek 2011, Novoa et al. 2020). In recent years, research and policy have focused on
identifying and classifying introduction pathways and prioritising which pathways to manage in order to
prevent biological invasions. This was illustrated by the Strategic Plan for Biodiversity 2011–2020

                                                   Page 2/26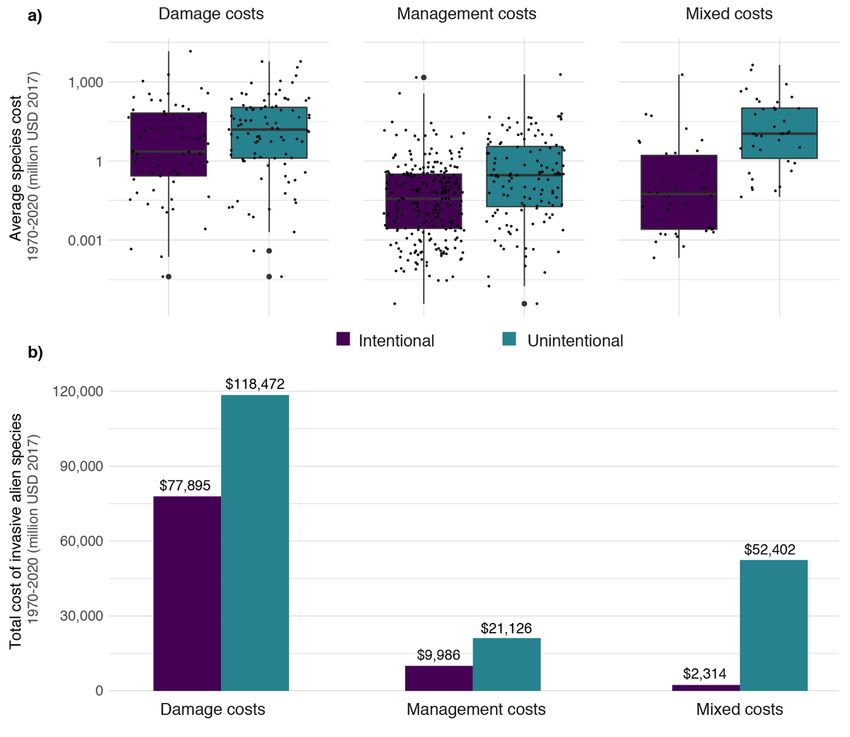
(Target 9; Convention on Biological Diversity 2012; https://www.cbd.int/sp/targets/rationale/target-9/) in
which parties aspired that ‘by 2020, invasive alien species and pathways are identi ed and prioritized’.
Many pathways of introduction (henceforth, ‘pathways’) have already been identi ed through
assessments at regional levels and across ecosystems. These assessments help advance our
understanding of IAS ows and support the development of policy tools (Hulme et al., 2008; Essl et al.,
2015; Katsanevakis et al., 2013; Pyšek et al., 2011, Nuñes et al., 2015; García-Berthou et al., 2005, Pergl et
al., 2017). Global databases of IAS such as the IUCN's Global Invasive Species Database (GISD,
www.iucngisd.org) and the CABI Invasive Species Compendium (CABI ISC, www.cabi.org/isc) list between
34 and 80 different pathways through which alien species can invade new locations. Examples of
pathways include horticulture (e.g. purple loosestrife, Lythrum salicaria), agriculture (e.g. cane toad,
Rhinella marina), pet trade (e.g. Burmese python, Python bivittatus) and stowaway transport (e.g. zebra
mussel, Dreissena polymorpha). Such lists are neither exhaustive nor static; as societies evolve and
economic activities continue to grow, more introduction pathways are expected to emerge. To facilitate
comparative studies on pathways, Hulme et al. (2008) developed a framework using a hierarchical
classi cation of pathways, subsequently adopted by the Convention on Biological Diversity (CBD, 2014).
The hierarchical approach encompasses three levels; the rst level is three broad mechanisms through
which species may arrive to a new location: movement of commodities, arrival of a transport vector,
and/or natural spread from a neighbouring region. These three mechanisms then encompass six primary
introduction pathways (Hulme et al., 2008): ‘Release’ (intentional introduction as a commodity for
release), ‘Escape’ (intentional introduction as a commodity but unintentional escape), ‘Contaminant’
(unintentional introduction with a speci c commodity), ‘Stowaway’ (unintentional introduction attached
to or within a transport vector), ‘Corridor’ (unintentional introduction via human infrastructures linking
previously unconnected regions), and ‘Unaided’ movement (unintentional introduction through natural
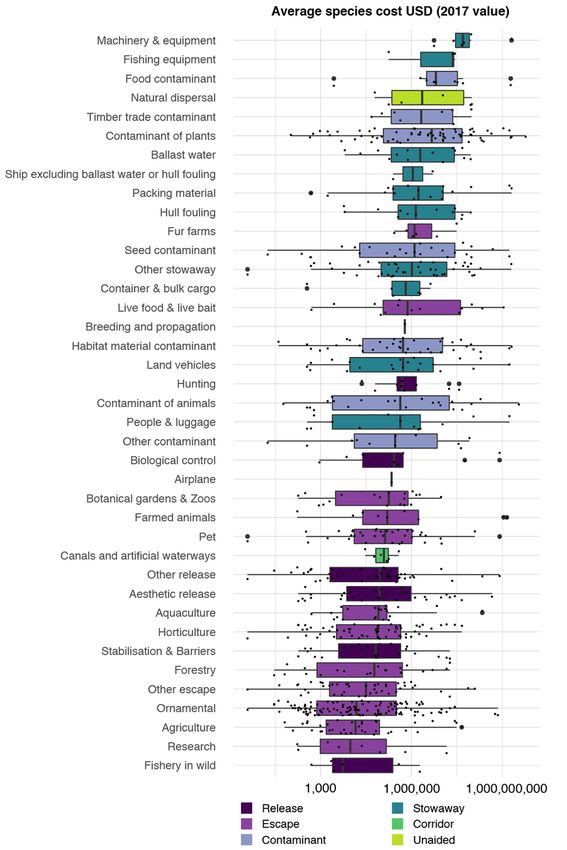
dispersal of alien species across political borders). These six pathways are further divided into 44
subcategories, covering all possible ways of introduction (Fig. 1).
Prioritizing the management of high-risk pathways is necessary to achieve cost-effective management of
IAS, essentially by preventing the introduction of additional harmful alien species (McGeoch et al., 2016).
IAS can generate substantial costs in terms of damage to ecosystems, impacts on human well-being and
expenditures on management (Diagne et al., in press). At the same time, there is evidence that investing
in the prevention of IAS introduction (proactive management) is less costly - and likely more e cient -
compared to allocating resources and funds to reactive management once they establish and become
invasive (Leung et al., 2002).
Pathways can be prioritized by urgency using (i) the number of IAS introduced per pathway and/or (ii) an
assessment of the impact caused by species introduced following speci c pathways (Essl et al., 2015;
McGeoch et al., 2016), and these two prioritizations can lead to con icting results. On the one hand,
studies that investigated the number of species per pathway have found that movement of commodities
was responsible for the most introductions. Indeed, ‘Escape’ is identi ed as the most prevalent pathway
for IAS, predominantly through horticulture trade (McGrannachan, et al., 2020; Saul et al., 2017; Turbelin
Page 3/26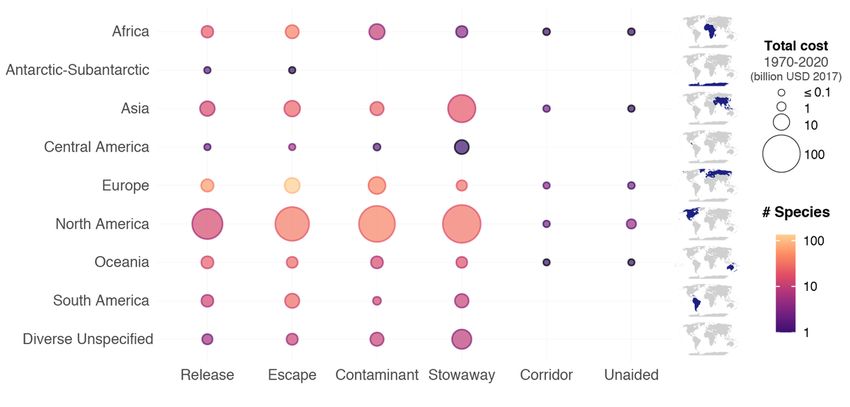
et al., 2017). On the other hand, previous studies showed that invaders associated with a high number of
introduction pathways are more likely to have an ecological impact in newly invaded sites (Pergl et al.,
2017; Saul et al., 2017). Particularly for plants, both the number and types of pathways can in uence
invasion success and the likelihood of impact (Pysek et al 2011; Pergl et al., 2017). Plants introduced
through ‘Release’, ‘Corridor’ and ‘Unaided’ pathways are more likely to have an ecological impact than
when introduced as ‘Contaminants’ (Pergl et al., 2017) and to successfully establish and be accepted in
society when grown as animal food or for environmental uses (van Kleunen et al., 2020).

Whilst a number of publications have examined the links between ecological impacts and pathways of
IAS, there are currently no studies assessing relationships between introduction pathways and economic
impacts of IAS. Economic impact is a very useful metric of the impact of IAS, as it can be quantitative,
and if costs are standardized, they can be compiled across regions or taxa and compared between
pathways. A better understanding of the economic costs of invasions is also a key way to raise global
awareness about IAS, optimise transboundary legislation and help the prioritisation of management
actions (Diagne et al. 2020a).

In this paper, we investigate introduction pathways of economically-harmful IAS using the most up-to-
date compilation of monetary cost information on IAS - the InvaCost database (Diagne et al. 2020b) and
the CBD hierarchical classi cation of introduction pathways (CBD, 2014; Hulme et al. 2008). Speci cally,
we address the following questions: (i) Are particular introduction pathways economically impactful? (ii)
How are costs taxonomically and spatially distributed across pathways? (iii) Are there differences in
costs between species introduced intentionally and unintentionally? and (iv) is there a relationship
between the number of possible introduction pathways of IAS and their costs?

Methods
Cost data collection and ltering

To assess the economic impact of IAS over the last 50 years (1970-2020), we relied on cost data recorded
in the latest version of InvaCost (version 3.0, openly available at
https://doi.org/10.6084/m9. gshare.12668570), which is the most complete and up-to-date global
dataset of the reported economic costs attributable to biological invasions (Diagne et al. 2020b).
InvaCost has been built by a combination of both systematic literature searches (e.g., speci c search
strings used in Web of Science and Google Scholar) and direct solicitations (e.g., stakeholders, scienti c
experts) to gather any cost information available in written documents in more than 10 languages. After
ensuring relevance of each document collected, cost information was collated, standardised to a
common and up-to-date currency in the database (i.e. 2017 US dollars), and nally classi ed into
categories using a range of descriptive elds that allow a multidimensional description of the cost
estimates collated (complete description and details on these descriptive elds are available at
https://doi.org/10.6084/m9. gshare.12668570). This updatable and publicly available resource now

                                                 Page 4/26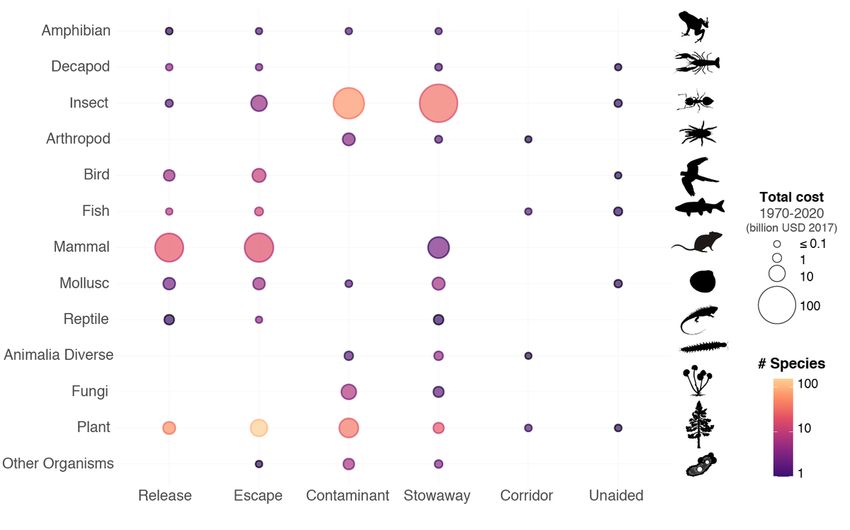
contains 9,823 cost entries (as of January 2021), therefore providing an essential basis for worldwide
research and policymaking targeting IAS (Diagne et al. 2020a, 2020b).

We used successive lters from the InvaCost database to identify relevant cost entries for our analysis
and obtain a conservative and realistic estimate of costs. First, we extracted costs empirically “observed”
in the invaded environment, and left out all “potential” costs (not yet actually realised but rather expected
and/or predicted over time within or beyond their actual distribution area: Implementation column).
Second, we then retained costs classi ed as “high” reliability – therefore discarding “low” reliability costs
– (Method_reliability column), thereby keeping only cost estimates either provided by o cially pre-
assessed documents (peer-reviewed articles and o cial reports) or associated with an estimation
methodology that was deemed reproducible when building the database (Diagne et al., 2020b). Lastly, we
focused on cost estimates exclusively attributed to individual species, therefore multi-species costs or
genus-level costs were removed (e.g. when the estimate in the Species column included “sp.” or “spp.” or
was simultaneously associated with several species without any possibility to disentangle speci c
contribution of each taxon to the overall cost). Following these ltering steps, our dataset (hereafter
called ltered_subset) contained 5,627 entries (Supplementary Material 1). All costs are presented in USD
2017 values following cost standardisation procedures described in Diagne et al. (2020b). Finally, we
extracted the list of individual species with recorded costs to assign pathways. After checking for
discrepancies in species names (i.e., where entries for the same species have different scienti c names
we opted for the internationally preferred Scienti c Name as described in CABI), the number of individual
species with cost records amounted to 515.

Collection and compilation of pathway information

Pathways were categorised using the pathway classi cation framework developed by Hulme et al. (2008)
and adopted by the Convention on Biological Diversity (CBD, 2014). This framework uses a hierarchical
approach in which alien species may arrive in a new location through three broad mechanisms (i.e.
movement of a commodity, arrival of a transport vector, or spread from a neighbouring region), 6 main
pathways (i.e. release, escape, contaminant, stowaway, corridor, and unaided) and 44 pathway
subcategories (e.g. ornamental, aquaculture, seed contaminant, etc.) (Figure 1). Pathway mechanisms,
categories and subcategories are de ned in Supplementary Material 2. We compiled pathway data for
each of the 515 species with reported economic costs in our ltered_subset (Supplementary Material 3,
which contains all columns hereafter mentioned) mainly using information from CABI ISC
(www.cabi.org/isc/) and the GISD (http://www.iucngisd.org/gisd); when the information needed was not
available in one of these repositories, we opportunistically extended our searches to other databases on
biological invasions (e.g. the Galapagos Species Checklist), as well as in targeted published literature.
Pathway descriptions provided in databases or publications, which do not always match the CBD
pathway sub-categories, were added to a column named pathway_description and the source (CABI ISC,
GISD, etc.) to a column named Source. The pathway description was matched using the CBD guidance
for interpretation of the categories on introduction pathways (Harrower et al., 2018) to one of the 44 CDB
subcategories (CBD_subcategory column), one of the 6 corresponding CBD pathway categories
                                                  Page 5/26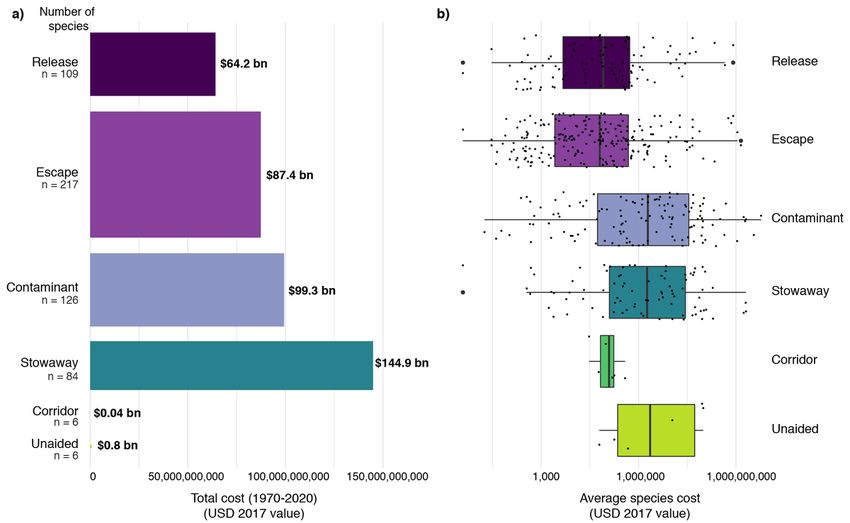
(CBD_pathway column) and one of the 3 broad CBD pathway mechanisms (CBD_mechanism column),
respectively.

As stated by the CBD: “Moreover, the pathway category assigned to a species is typically the pathway(s)
that relates directly to the species being introduced. However, the introduction of a species may also be
indirectly dependent on another pathway, particularly when the species is contaminant of another species
or product. Although these dependent pathways are not directly related to the species they play a part in
understanding the process of introduction and are, therefore, important for decision-making and
particularly in relation to prevention through management of pathways. As these dependent pathways
are important they should be recorded, but as they are not directly related to the species it is important
they are not confused with the pathway information that directly relates to the species.” As such, we
incorporated a Direct_or_Indirect column to highlight pathway dependency, and to indicate whether the
pathway was related directly to the species being introduced (Direct) or when the pathway was related to
a species or product that the species being introduced is dependent upon (Indirect).

Finally, as IAS can have multiple pathways of introduction, we determined the most important pathways
for each species by classifying each pathway as ‘primary’ or ‘secondary’ (Primary_or_Secondary column)
based on the above-mentioned source information. A pathway was categorised as ‘primary’ when it was
clearly recognised as one of the most important in the source document, i.e. likely leading to successful
long-distance introductions as a result of increased propagule pressure (number, frequency and range of
propagules) or by facilitating spread or escape. Conversely, a pathway was categorised as ‘secondary’
when it was less likely to lead to the successful establishment of a species, generally due to either low
propagule pressure (i.e. low number of introduction events, low number of individuals per introduction
event) or due to it mainly promoting short distance/local dispersal of the species. We classi ed pathways
as ‘secondary’ only when the information provided in databases or publications enabled us to identify
primary pathways. Otherwise, pathways were classi ed as primary. It was thus possible for a species to
have more than one primary pathway.

There is a level of inherent uncertainty associated with the compilation of data collated in large-scale
databases. We minimized the level of uncertainty associated with pathway-related data input in two ways
depending on the source of uncertainty. First, data collation and merging between different data
resources may be a source of potential confusion and errors. Therefore, we checked for (and then
systematically corrected) obvious mistakes in pathway assignment using our expert judgement. Second,
uncertainty may also arise from the varying quality of the source attributing a pathway to a particular
species. Indeed, pathways may be assigned based on (i) information from the peer-reviewed literature –
providing evidence of transport of a species from one region to another, (ii) indirect evidence of pathway
use reported in grey literature (e.g. individuals found near botanic gardens), and (iii)
assumptions/deductions made from similar species’ introduction pathways (Harrower et al., 2018).

Data processing and analysis

                                                  Page 6/26
We used the expandYearlyCosts() function from the ‘invacost’ package version 0.3-4 (Leroy et al., 2020)
in R version 4.0.3 (R Core Team 2020) to ensure that each cost entry - which could correspond to either a
single or a multi-year estimate - was consistently recorded on an annual basis for the amount of years
that the cost was incurred. The period of cost occurrence was calculated as the difference between the
rst year (Probable_starting_year_adjusted column) and the ending year (Probable_ending_year_adjusted
column) of the cost record. The expanded version of our ltered_subset contained 10,183 cost entries
(hereafter called expanded_subset). Finally, we used the R package dplyr (version 1.0.2.)(Wickham et al.,
2020) to merge the expanded_subset with the pathways dataset (Supplementary Material 3) and
generate our nal dataset, available in Supplementary Material 4. Our nal dataset contained 52,454
entries covering over 107 countries.
To estimate the economic impact (or cost) of invasive species for the period 1970-2020, we calculated
the total cumulative costs over time observed between 1970 and 2020, by summing all cost estimates
provided in the Cost_estimate_per_year_2017_USD_exchange_rate column of our nal dataset. We also
calculated the average cost of species, by averaging the mean costs calculated for every species
according to each reported pathway (Supplementary Material 5). We used the Kruskal-Wallis rank sum
test to compare the average and total cost per species across pathway categories and subcategories.
Multiple comparisons were further carried out with pairwise Wilcoxon rank sum tests (95% family-wise
con dence level).
Total and average costs were provided for the different taxa recorded in our nal dataset. IAS were
classi ed into 13 broad “organism types” based on information from the Kingdom, Phylum, and Class
columns: amphibian, arthropods, bird, decapod, sh, fungi, insect, mammal, mollusc, plant, reptile,
animalia diverse and other organisms. “Animalia diverse” include species from the Kingdom Animalia
that are not listed in the above animal categories (e.g species of the class Ascidiacea or phylum
Nematoda). The category “other organisms” is made up of all organisms not included in the
aforementioned categories (e.g. species with Kingdom column entries Bacteria, Virus, Chromista).
To examine potential differences in damage and management costs between species introduced
intentionally and unintentionally, and across pathways, we used information from the
Type_of_cost_merged column in our nal dataset, which classi es the cost estimates as “damage” (i.e.
economic losses due to direct and/or indirect impacts of invaders, such as yield losses, damage repair,
etc.), “management” (i.e. economic resources allocated to actions related to the prevention, management
and control of alien species) or “mixed” (i.e. when costs incorporate both ‘damage’ and ‘management’
elements) costs.
The number of introduction pathways per species was calculated by summing the number of pathways
(CBD_pathway column) and pathways subcategory (CBD_subcategory column) for each species.
We used ggplot2 (v.3.3.2, Wickham 2011) R package to generate all gures.
Page 7/26Results
Our nal dataset contained cost data for 515 individual species. Pathway information was available for
412 species (80%), whilst 106 species (20%) currently have unknown pathways.
Are particular IAS introduction pathways economically
impactful?
Considering only primary pathways, we found that ‘Stowaways’ and ‘Contaminants’ were globally
associated with the highest monetary losses and expenditures. This pattern was consistent when
considering both the (i) total costs (Table 1; Fig. 2a) over the last 50 years (1970–2020) as well as (ii) the
average cost per species (KW test = 72.391; p < 0.001; Fig. 2b). IAS introduced via ‘Stowaways’ ($144.9bn)
and ‘Contaminants’ ($99.3bn) exhibited higher costs than those introduced through ‘Escape’ ($87.4bn),
‘Release’ ($64.2bn) and other pathways (i.e. less than $1bn). Equally, species introduced as
‘Contaminants’ ($158.0m; median: $1.9m) and ‘Stowaways’ ($89.4m; median: $1.8m) were more likely to
cost more than species introduced intentionally through ‘Release’ ($16.4 million; median: $0.08m) or
‘Escape’ ($25.4m; median: $0.06m). This pattern was observed despite the larger number of species
found to be introduced through ‘Escape’ (217) than through ‘Contaminants’ (126) or ‘Stowaways’ (84)
pathways. This nding remains true even when including secondary pathways in the analyses (KW test =
41.546; p < 0.001; see Supplementary Material 6 for details on Wilcoxon pairwise comparisons).
Page 8/26Table 1
Cost of invasive alien species by pathway of introduction. The total cost is the sum of all costs attributed
to invasive alien species for each pathway category from 1970 to 2020 and the average cost is the
average cost of a species in a given pathway.
Invasive alien species cost per pathway (direct and primary pathways)
CBD Mechanism Pathway # Average cost Total cost
Species
million (2017 USD) million (2017 USD)
VECTOR Stowaway 84 $89 $144,918
Movement of Contaminant 126 $158 $99,327
COMMODITY
Movement of Escape 217 $25 $87,371
COMMODITY
Movement of Release 109 $16 $64,183
COMMODITY
SPREAD Unaided 6 $12 $760
SPREAD Corridor 6 $0.2 $35
Invasive alien species cost per pathway (direct, primary and secondary pathways)
CBD Mechanism Pathway # Average cost Total cost
Species
million (2017 USD) million (2017 USD)
VECTOR Stowaway 157 $69 $179,143
Movement of Contaminant 205 $101 $161,069
COMMODITY
Movement of Escape 235 $23 $98,360
COMMODITY
Movement of Release 155 $13 $70,823
COMMODITY
SPREAD Unaided 164 $57 $32,623
SPREAD Corridor 27 $11 $4,028
Unknown Unknown 106 $71 $15,307
‘Corridor’ and ‘Unaided’, were generally classi ed as secondary pathways; nevertheless for a relatively
small amount of species (n = 12) (e.g. Salvinia molesta, Gymnocephalus cernuus) these were also
classi ed as the primary means of dispersal. The total costs incurred as a result of species introduced
through ‘Corridors’ and ‘Unaided’ pathways were the lowest, costing $0.04bn and $0.8bn between 1970
and 2020, respectively. However, the average cost of species spread through ‘Corridor’ was $0.2m and
‘Unaided’ $33.4m (median species costs: $0.1 and $5.7m).
Page 9/26The three direct, primary pathway subcategories with the highest average species cost were ‘Machinery &
equipment’, ‘Fishing equipment’ and ‘Food contaminant’ whilst the three pathway subcategories with the
lowest average species cost were ‘Fishery in the wild’, ‘Research’, and ‘Agriculture’ (see Fig. 3). Species
making up the ‘Contaminants’ and ‘Stowaways’ pathways were most frequently introduced speci cally
during the movement of commodities. Here, we found that species with the highest average cost were
associated with indirect introductions following the release of species into the (semi)-natural
environment: ‘Aesthetic release’, ‘Agriculture’ and ‘Ornamental trade’. Over the last 50 years, ‘Packing
material’ and ‘Machinery & equipment’ stowaways accounted for the highest costs ($79bn and $75bn,
respectively). For intentional introduction pathways, species introduced through ‘Pet trade’, ‘Other release’
and ‘Biological control’ amassed the highest cost of $50bn, $47bn and $45bn (Supplementary Material
7).
How are costs taxonomically and spatially distributed
across pathways?
The costs of species introduced as ‘Contaminants’ and ‘Stowaways’ were mainly driven by insects, with a
total cost of $111bn and $66bn, respectively. They were followed by mammals for ‘Stowaways’ ($24bn)
(e.g. Rattus spp.) and by plants for ‘Contaminants’ ($18bn). Mammals drove the cost of species released
into nature (‘Release’) or that have escaped (‘Escape’), costing over $50m between 1970 and 2020
(Fig. 4). Although most plant IAS were intentionally introduced and subsequently escaped, invasive plant
species introduced as ‘Contaminants’ generated the greatest costs. There was no statistical difference in
the total and average cost of plants introduced across pathways (p > 0.05).
The total cost each IAS pathway varied across regions. ‘Stowaways’ had the highest costs in Asia, Central
America, North America and Diverse/Unspeci ed regions, whilst Antarctic-Subantarctic and Oceania
incurred the greatest costs from species intentionally released into nature (‘Release’). In Africa and
Europe, ‘Contaminants’ generated the highest costs, followed by ‘Escape’ species (see Fig. 5). When
considering the average cost of species for each pathway, ‘Release’ species were the most costly in Asia
and South America, ‘Contaminants’ were the most costly in Africa, Europe, Oceania and
Diverse/Unspeci ed region and ‘Stowaways’ cost the most in Central and North America (See
Supplementary Material 8).
Are there differences in costs between species introduced
intentionally and unintentionally?
The total cost of species introduced unintentionally is more than double the cost of species introduced
intentionally ($192bn vs. $90bn respectively). The average species cost tended to be higher for species
introduced unintentionally in terms of damage (p = 0.085), management (p < 0.001) and mixed costs (p <
0.001) than species introduced intentionally (Fig. 6a). Similar to this trend, over the period 1970–2020,
species introduced unintentionally were found to cost more in terms of damage and management than
species introduced intentionally (Fig. 6b) with unintentional introductions generating $118bn and $21bn
in damage and management respectively versus $78bn and $10bn for species introduced intentionally.
Page 10/26When considering the different types of management costs (e.g. pre-invasion, post-invasion),
unintentional introductions still generated more costs than intentional introductions (see Supplementary
Material 9).
Is there a relationship between the number of introduction
pathways and species cost?
There was a slight decreasing trend between costs of IAS and the number of pathways through which
they are transported. However, we found no signi cant relationship between the total cost or the average
cost of a species and the number of its pathways or pathway sub-categories (see Fig. 7).
Discussion
Using data from InvaCost, we set out to address four principal questions. First, we found that the average,
as well as the total cost of species introduced through ‘Contaminants’ and ‘Stowaways’ were more costly
than species introduced primarily through ‘Escape’ and ‘Release’, with ‘Unaided’ and ‘Corridor’ being the
least costly. Second, this pattern varies spatially and across taxonomic groups, which should be taken
into consideration when formulating policies. Third, the cost of species introduced unintentionally is more
than double the cost of species introduced intentionally. Likewise, the average species cost also tends to
be much higher for species introduced unintentionally in terms of damage, management and mixed costs
than species introduced intentionally. Finally, unlike ecological impacts – where multiple pathways
increase the likelihood of species’ having an impact (Pergl et al., 2017) – we found no relationship
between the total and average cost of species and the number of pathways through which it is
transported.
More than 40% of species with cost records had ‘Escape’ as a primary pathway of introduction making it
the most common IAS pathway, followed by ‘Contaminants’ (24%), ‘Release’ (21%) and ‘Stowaways’
(16%). The proportion of species in relation to each pathway is in line with recent ndings of
McGrannachan et al. (2021). Although species introduced through ‘Escape’ and ‘Release’ are more
numerous than species introduced as ‘Contaminants’ or ‘Stowaways’, their average and overall costs are
signi cantly lower.
Such patterns can be attributed to a number of factors including species charisma, perceived utility and
ease of management. IAS charisma – “characteristics that affect people’s perceptions, attitudes, and
behaviors toward them” – can in uence public support or contribute to social con icts thereby affecting
perceptions of costs and management actions (Jarić et al., 2020). As such, charismatic species are not
only more likely to be introduced intentionally through, for example, the ornamental trade (van Kleunen et
al. 2018) but are also more likely to receive social acceptance in the receiving region and generate public
opposition to control measures (Jarić et al., 2020). This could lead to low reports of damage costs and
paltry investment in management actions. For example, proposed controlled measures of the grey
squirrel (Sciurus carolinensis) in the UK and Italy generated strong backlash from the public despite its
Page 11/26known impact on native red squirrel (Sciurus vulgaris) populations and potentially high economic
damage cost (Bertolino and Genovesi 2003; Gurnell et al., 2004; Mayle and Broome, 2013). Moreover,
intentional releases and escapes should in theory be more straightforward to monitor and control (Hulme
et al., 2008) and therefore less costly. Although further evidence is needed to support this hypothesis,
Pluess et al. (2012) suggest that eradication campaigns were more likely to succeed for plants introduced
for cultivation and subsequently escaped, whilst fungi were the least likely to be eradicated, potentially
due to their ability to spread and develop resistance to fungicides (Otten et al., 2004). Arguably, species
introduced unintentionally may be able to spread undetected for longer, leading to greater economic costs
compared to species introduced intentionally, for which one expects that better measures are already in
place to prevent and control invasions.
In line with vertebrates being characterized as deliberate ‘Releases’ and invertebrates as ‘Contaminants’
(Hulme et al., 2008), mammals drive the total cost of intentional introductions (64%) whilst insects drive
the total costs of unintentional introductions (67%). Indeed, charismatic and widely domesticated cats
(Felis catus), wild boars (Sus scrofa) and rabbits (Oryctolagus cuniculus) represent 58% of intentional
introduction costs. Their close proximity and value to humans either as game animals or as pets is a
likely cause for their uncontrolled range and population expansion, consequently leading to extensive
damage costs. On the other hand, insects are inconspicuous, so their sheer numbers and predominant
impacts on sectors such as agriculture, health and forestry probably contribute to their high costs. The
high reported costs of insects are the opposite of what we would expect if detection bias drove our
results. When looking at the average cost per species, fungi and mammals, namely rats, stand out as the
most costly ‘Stowaway’ species, and fungi and arthropods (other than insects) have the highest average
species cost for ‘Contaminants’. Indeed, rats are amongst the most impactful IAS as their costly effects
are both global and multi-sectoral, pertaining to disease transmission, damage to infrastructures and
social disruption among others (WHO 2019).
Interestingly, plants introduced through ‘Release’, ‘Corridor’ and ‘Unaided’ are more likely to have
ecological impacts than those introduced as ‘Contaminants’ (Pergl et al., 2017). However, we found that
the average and total cost of plants introduced as ‘Contaminants’ were higher compared to other
pathways, despite more plant species being introduced intentionally. There were no statistical differences
in costs of invasive plants across pathways. Pyšek et al. (2011) found that plants introduced deliberately
have a higher establishment success rate than plants introduced unintentionally, although ‘Contaminants’
were as widely distributed as intentionally introduced species, and invaded a wider range of semi-natural
habitats. This could explain the higher costs generated by ‘Contaminants’, despite the high number of
‘Escape’ plant species.
Some plants with the greatest associated costs were originally released through the aquarium trade or for
aquatic horticulture (e.g. Eichhornia crassipes, Hydrilla verticillate, Hydrocotyle ranunculoides,
Lagarosiphon major). Aquatic ecosystems are particularly susceptible to invasions due to their relatively
high connectivity - both hydrological and organismal - through exchange of mobile species (including
humans) that may spread plant propagules (Francis et al. 2019). Increased awareness of biosecurity
Page 12/26issues around the trade in aquatic plants is needed to help counter the future emergence of costly
invasions (Champion et al. 2010), just as there has been increased recognition of the risks of sh
introductions through this mechanism (Gertzen et al. 2008; Nunes et al. 2015; Lockwood et al., 2019).
Furthermore, while the patterns and trends depicted here are based on only a subset of known IAS - i.e.
those recorded in the InvaCost database, our results are aligned with previous ndings in terms of
proportion of IAS by pathways (Saul et al., 2017; McGrannachan et al., 2021). Hence, our study provides a
sound basis for further improved pathway-based cost assessments for many more IAS.
Costs incurred as a result of unintentional introductions are the greatest globally and for most regions,
except for Oceania and Antarctic-Subantarctic, where costs from ‘Release’ species have accrued the most
over the last 50 years. With low levels of human activity in the Antarctic region, it is not surprising that
cost records only relate to management measures of intentionally introduced mammals, even though
both deliberate and accidental introductions have been reported (Frenot et al., 2005). Monetary
quanti cation of damage from invasions may be more di cult when the impact is primarily
environmental; especially since humans are perhaps more inclined to spend money to mitigate impacts
that cause economic losses. The cost of deliberate introductions in Oceania highlights the importance of
conducting impact assessments before intentionally introducing species into new environments. As an
example, a number of species (e.g. rabbits, wild boars) have been deliberately released into (semi)-natural
environments and caused massive impacts to both the environment and sectors of the Australian
economy such as agriculture (Hoffmann and Broadhurst, 2016).
Given their high economic impacts, managing unintentional introduction pathways (i.e. ‘Stowaway’ and
‘Contaminants) should be a priority for future biosecurity efforts, which must adapt to growing trends in
global shipping (Sardain et al. 2019), and increased survivability of stowaways due to climate change
(Pyke et al. 2008; Della Venezia et al. 2018; Kourantidou et al. 2015; Kaiser and Kourantidou 2021).
Embracing emerging technologies for safer shipping such as eDNA detection techniques, recyclable
plastic pallets (i.e. IKEA’s OptiLedge), and the application of fouling-resistant paints to ship hulls will help
meet these challenges (Callow & Callow 2011; Guan et al. 2019). At the level of international policy,
agreements such as the Ballast Water Management (BWM) which nally entered into force in 2017 (close
to 27 years after its initial design and 13 years after its adoption) (IMO, 2020) and the creation of global
biofouling policy are instrumental to establishing a worldwide standard to mitigate stowaways on ship
hulls (Davidson et al. 2016; Ojaveer et al. 2018; Galil et al. 2019). The upholding of existing international
ballast water regulations, as well as improved ballast water management in Arctic regions, will be key in
the face of warming arctic waters (Goldsmit et al. 2019; Kourantidou et al. 2015; Kaiser and Kourantidou
2021). Stricter enforcement of wood packing material protocols such as ISPM15 can help limit the
transport of wood boring insects in wood pallets (Leung et al. 2014). Similarly, adopting a ‘pest free
status’ (ISPM10) prior to the export of goods – especially through ‘Aesthetic release’, ‘Agriculture’ and
‘Ornamental trade’ – may help reduce costs associated with ‘Contaminants’ and ‘Stowaways’.
Interception of IAS by trained staff at ports of entries (airports, seaports) should also be a very e cient
measure.
Page 13/26To conclude, using the most up-to-date compilation of monetary cost information on IAS we show that
‘Stowaways’ and ‘Contaminants’ (particularly stowaways in ‘Packing material’ and ‘Machinery &
equipment’ and ‘Contaminant of plants’) cause the greatest economic impacts globally. Thus, prioritising
measures to prevent and control unintentional species introductions is critical in order to reduce the
overall economic burden of IAS. We also stress the importance of conducting impact assessments before
deliberately introducing species into new environments and raising public awareness of the potential
impacts of non-native species, especially those introduced through the pet and aquarium trade. Moreover,
our ndings stimulate the need for more and better cost assessments and their association with IAS
pathways, as targeted management implemented to prevent IAS introduction is the most e cient way to
limit further impacts to our ecosystems.
Declarations
Acknowledgements
The authors acknowledge the French National Research Agency (ANR-14-CE02-0021) and the BNP-
Paribas Foundation Climate Initiative for funding the InvaCost project that allowed the construction of the
InvaCost database. The present work was conducted following a workshop funded by the AXA Research
Fund Chair of Invasion Biology and is part of the AlienScenario project funded by BiodivERsA and
Belmont-Forum call 2018 on biodiversity scenarios. AJT contract comes from the AXA Research Fund
Chair of Invasion Biology of University Paris Saclay. CD is funded by the BiodivERsA-Belmont Forum
Project “Alien Scenarios” (BMBF/PT DLR 01LC1807C). AN and DM acknowledge funding from EXPRO
grant no. 19-28807X (Czech Science Foundation) and long-term research development project RVO
67985939 (The Czech Academy of Sciences).
Authors’ contribution. AJT, CD and FC managed the project. All co-authors contributed to the design of the
study. AJT, EJH, CB, PJH, MK and AN compiled the pathway dataset. AJT, CD, DM and RG checked the
pathway dataset. AJT carried out the analyses and generated the graphical items with help from FC and
input from all co-authors. AJT took the lead in writing the rst draft of the paper with inputs from CD
followed by all co-authors. All co-authors read and approved the nal manuscript.
Con ict of interest. The authors have declared that no competing interests exist.
Data Resources. All data used in this study were made fully accessible as supplementary les
(Supplementary le 1; Supplementary le 3; Supplementary le 4).
References
Barrios-Garcia, M.N. and Ballari, S.A., 2012. Impact of wild boar (Sus scrofa) in its introduced and native
range: a review. Biological Invasions, 14(11), pp.2283-2300.
Page 14/26Bertolino, S. and Genovesi, P., 2003. Spread and attempted eradication of the grey squirrel (Sciurus
carolinensis) in Italy, and consequences for the red squirrel (Sciurus vulgaris) in Eurasia. Biological
Conservation, 109(3), pp.351-358.
Blackburn, T.M., Pyšek, P., Bacher, S., Carlton, J.T., Duncan, R.P., Jarošík, V., Wilson, J.R. and Richardson,
D.M., 2011. A proposed uni ed framework for biological invasions. Trends in ecology & evolution, 26(7),
pp.333-339.
Callow, J. A., & Callow, M. E., 2011. Trends in the development of environmentally friendly fouling-
resistant marine coatings. Nature communications, 2(1), 1-10.
CBD (2014) Pathways of introduction of invasive species, their prioritization and management.
https://www.cbd.int/doc/meetings/sbstta/sbstta-18/o cial/sbstta-18-09-add1-en.pdf
Champion, P.D., Clayton, J.S. and Hofstra, D.E., 2010. Nipping aquatic plant invasions in the bud: weed
risk assessment and the trade. Hydrobiologia, 656, pp. 167–172.
Davidson I, Scianni C, Hewitt C, Everett R, Holm E, Tamburri M, and Ruiz G. 2016. Mini-review: Assessing
the drivers of ship biofouling management–aligning industry and biosecurity goals. Biofouling, 32(4):
411-428. https://doi.org/10.1080/08927014.2016.1149572.
Della Venezia L, Samson J, and Leung B. 2018. The rich get richer: invasion risk across North America
from the aquarium pathway under climate change. Diversity and Distributions, 24(3): 285–296.
https://doi.org/10.1111/ddi.12681.
Diagne, C., Catford, J.A., Essl, F., Nuñez, M.A. and Courchamp, F., 2020a. What are the economic costs of
biological invasions? A complex topic requiring international and interdisciplinary expertise. NeoBiota, 63,
p.25.
Diagne, C., Leroy, B., Gozlan, R.E., Vaissière, A.C., Assailly, C., Nuninger, L., Roiz, D., Jourdain, F., Jarić, I. and
Courchamp, F., 2020b. InvaCost, a public database of the economic costs of biological invasions
worldwide. Scienti c data, 7(1), pp.1-12.
Diagne C., Leroy B., Vaissière A-C, Gozlan R.E., Roiz D., Jarić I., Salles J-M., Bradshaw C. J. A. &
Courchamp F. In Press. High and rising economic costs of biological invasions worldwide. Nature
Essl, F., Bacher, S., Blackburn, T.M., Booy, O., Brundu, G., Brunel, S., Cardoso, A.C., Eschen, R., Gallardo, B.,
Galil, B. and García-Berthou, E., 2015. Crossing frontiers in tackling pathways of biological invasions.
BioScience, 65(8), pp.769-782.
Francis, R.A., Chadwick, M.A., Turbelin, A.J., 2019. An overview of non‐native species invasions in urban
river corridors. River Research and Applications, 35(8), pp.1269-1278.
Page 15/26Frenot, Y., Chown, S.L., Whinam, J., Selkirk, P.M., Convey, P., Skotnicki, M. and Bergstrom, D.M., 2005.
Biological invasions in the Antarctic: extent, impacts and implications. Biological reviews, 80(1), pp.45-72.
Galil BS, McKenzie C, Bailey S, Campbell M, Davidson IC, Drake L, et al. ICES Viewpoint background
document: Evaluating and mitigating introduction of marine non-native species via vessel biofouling.
Copenhagen, DK: ICES: International Council for the Exploration of the Sea; 2019.
García-Berthou, E., Alcaraz, C., Pou-Rovira, Q., Zamora, L., Coenders, G. and Feo, C., 2005. Introduction
pathways and establishment rates of invasive aquatic species in Europe. Canadian Journal of Fisheries
and Aquatic Sciences, 62(2), pp.453-463.
Gertzen, E., Familiar, O. and Leung, B., 2008. Quantifying invasion pathways: sh introductions from the
aquarium trade. Canadian Journal of Fisheries and Aquatic Sciences, 65(7), pp. 1265-1273.
Goldsmit J, Nudds SH, Stewart DB, Higdon JW, Hannah CG, and Howland KL. 2019. Where else?
Assessing zones of alternate ballast water exchange in the Canadian eastern Arctic. Marine Pollution
Bulletin, 139: 74-90. https://doi.org/10.1016/j.marpolbul.2018.11.062.
Guan X, Monroe EM, Bockrath KD, Mize EL, Rees CB, Lindsay DK, Baewaldt KL, Nico LG, and Lance RF.
2019. Environmental DNA (eDNA) assays for invasive populations of black carp in North America.
Transactions of the American Fisheries Society, 148(6): 1043-1055. https://doi.org/10.1002/tafs.10195.
Gurnell, J., Wauters, L.A., Lurz, P.W. and Tosi, G., 2004. Alien species and interspeci c competition: effects
of introduced eastern grey squirrels on red squirrel population dynamics. Journal of Animal Ecology,
73(1), pp.26-35.
Harrower, C.A., Scalera, R., Pagad, S., Schonrogge, K. and Roy, H.E., 2018. Guidance for interpretation of
CBD categories on introduction pathways.
Hoffmann, B.D. and Broadhurst, L.M., 2016. The economic cost of managing invasive species in
Australia. NeoBiota, 31, p.1.
Hulme, P.E., Bacher, S., Kenis, M., Klotz, S., Kühn, I., Minchin, D., Nentwig, W., Olenin, S., Panov, V., Pergl, J.
and Pyšek, P., 2008. Grasping at the routes of biological invasions: a framework for integrating pathways
into policy. Journal of Applied Ecology, 45(2), pp.403-414.
IMO (International Maritime Organisation) 2020. [Online] Available from: https://www.imo.org/. Accessed
10/02/2021.
Jarić, I., Courchamp, F., Correia, R.A., Crowley, S.L., Essl, F., Fischer, A., González‐Moreno, P., Kalinkat, G.,
Lambin, X., Lenzner, B. and Meinard, Y., 2020. The role of species charisma in biological invasions.
Frontiers in Ecology and the Environment, 18(6), pp.345-353.
Page 16/26Kaiser BA and Kourantidou M, (2021) Invasive Alien Species in Changing Marine Arctic Economies and
Ecosystems. CABI. In press
Katsanevakis, S., Zenetos, A., Belchior, C. and Cardoso, A.C., 2013. Invading European Seas: assessing
pathways of introduction of marine aliens. Ocean & Coastal Management, 76, pp.64-74.
Van Kleunen, M., Essl, F., Pergl, J., Brundu, G., Carboni, M., Dullinger, S., Early, R., González‐Moreno, P.,
Groom, Q.J., Hulme, P.E. and Kueffer, C., 2018. The changing role of ornamental horticulture in alien plant
invasions. Biological Reviews, 93(3), pp.1421-1437.
van Kleunen, M., Xu, X., Yang, Q., Maurel, N., Zhang, Z., Dawson, W., Essl, F., Kreft, H., Pergl, J., Pyšek, P.
and Weigelt, P., 2020. Economic use of plants is key to their naturalization success. Nature
communications, 11(1), pp.1-12.
Kourantidou M, Kaiser BA, Fernandez LM (2015) Towards Arctic Resource Governance of Marine Invasive
Species. In: Heininen L, Exner-Pirot H, Plouffe. J (Eds), Arctic Yearbook. Akureyri, Iceland: Northern
Research Forum, 175–194.
Lehan, N.E., Murphy, J.R., Thorburn, L.P. and Bradley, B.A., 2013. Accidental introductions are an important
source of invasive plants in the continental United States. American journal of botany, 100(7), pp.1287-
1293.
Leroy, B., Kramer, A., Vaissière, A-C., and Diagne, C., (2020). invacost: INVACOST Database With Methods
To Analyse Invasion Costs. R package version 0.3-4.
Leung, B., Lodge, D.M., Finnoff, D., Shogren, J.F., Lewis, M.A. and Lamberti, G., 2002. An ounce of
prevention or a pound of cure: bioeconomic risk analysis of invasive species. Proceedings of the Royal
Society of London. Series B: Biological Sciences, 269(1508), pp.2407-2413.
Leung B, Springborn MR, Turner JA, and Brockerhoff EG. 2014. Pathway-level risk analysis: the net
present value of an invasive species policy in the US. Frontiers in Ecology and the Environment, 12(5):
273-279. https://doi.org/10.1890/130311.
Lockwood, J.L., Welbourne, D.J., Romagosa, C.M., Cassey, P., Mandrak, N.E., Strecker, A., Leung, B.,
Stringham, O.C., Udell, B., Episcopio‐Sturgeon, D.J. and Tlusty, M.F., 2019. When pets become pests: the
role of the exotic pet trade in producing invasive vertebrate animals. Frontiers in Ecology and the
Environment, 17(6), pp.323-330.
Mayle, B.A. and Broome, A.C., 2013. Changes in the impact and control of an invasive alien: the grey
squirrel (Sciurus carolinensis) in Great Britain, as determined from regional surveys. Pest management
science, 69(3), pp.323-333.
McGeoch, M.A., Genovesi, P., Bellingham, P.J., Costello, M.J., McGrannachan, C. and Sheppard, A., 2016.
Prioritizing species, pathways, and sites to achieve conservation targets for biological invasion.
Page 17/26Biological Invasions, 18(2), pp.299-314.
McGrannachan CM, Pagad S, McGeoch MA (2021) A multiregional assessment of transnational
pathways of introduction. NeoBiota 64: 43-67. https://doi.org/10.3897/neobiota.64.60642
Novoa, A., Richardson, D.M., Pyšek, P., Meyerson, L.A., Bacher, S., Canavan, S., Catford, J.A., Čuda, J., Essl,
F., Foxcroft, L.C. and Genovesi, P., 2020. Invasion syndromes: a systematic approach for predicting
biological invasions and facilitating effective management. Biological Invasions, pp.1-20.
Nunes, A.L., Tricarico, E., Panov, V.E., Cardoso, A.C. and Katsanevakis, S., 2015. Pathways and gateways
of freshwater invasions in Europe. Aquatic Invasions, 10(4), pp. 359–370
Ojaveer, H., Galil, B.S., Carlton, J.T., Alleway, H., Goulletquer, P., Lehtiniemi, M., Marchini, A., Miller, W.,
Occhipinti-Ambrogi, A., Peharda, M. and Ruiz, G.M., 2018. Historical baselines in marine bioinvasions:
Implications for policy and management. PloS one, 13(8), p.e0202383.
Otten, W., Bailey, D.J. and Gilligan, C.A., 2004. Empirical evidence of spatial thresholds to control invasion
of fungal parasites and saprotrophs. New Phytologist, 163(1), pp.125-132.
Pergl, J., Pyšek, P., Bacher, S., Essl, F., Genovesi, P., Harrower, C.A., Hulme, P.E., Jeschke, J.M., Kenis, M.,
Kühn, I., Perglová, I., Rabitsch, W., Roques, A., Roy, D.B., Roy, H.E., Vilà, M., Winter, M. and Nentwig, W. 2017.
Troubling travellers: are ecologically harmful alien species associated with particular introduction
pathways? NeoBiota 32: 1-20. https://doi.org/10.3897/neobiota.32.10199
Pyke CR, Thomas R, Porter RD, Hellmann JJ, Dukes JS, Lodge DM, and Chavarria G. 2008. Current
practices and future opportunities for policy on climate change and invasive species. Conservation
biology, 22(3): 585-592. https://doi.org/10.1111/j.1523-1739.2008.00956.x.
Pyšek, P., Jarošík, V. and Pergl, J., 2011. Alien plants introduced by different pathways differ in invasion
success: unintentional introductions as a threat to natural areas. PloS one, 6(9), p.e24890.
Pyšek, P., Hulme, P.E., Simberloff, D., Bacher, S., Blackburn, T.M., Carlton, J.T., Dawson, W., Essl, F., Foxcroft,
L.C., Genovesi, P. and Jeschke, J.M., 2020. Scientists' warning on invasive alien species. Biological
Reviews, 95(6), pp.1511-1534.
Sardain A, Sardain E, and Leung B. 2019. Global forecasts of shipping tra c and biological invasions to
2050. Nature Sustainability, 2(4): 274–282. https://doi.org/10.1038/s41893-019-0245-y.
Saul, W.C., Roy, H.E., Booy, O., Carnevali, L., Chen, H.J., Genovesi, P., Harrower, C.A., Hulme, P.E., Pagad, S.,
Pergl, J. and Jeschke, J.M., 2017. Assessing patterns in introduction pathways of alien species by linking
major invasion data bases. Journal of Applied Ecology, 54(2), pp.657-669.
Simberloff, D. and Rejmánek, M. eds., 2011. Encyclopedia of biological invasions (No. 3). Univ of
California Press.
Page 18/26Turbelin, A.J., Malamud, B.D. and Francis, R.A., 2017. Mapping the global state of invasive alien species:
patterns of invasion and policy responses. Global Ecology and Biogeography, 26(1), pp.78-92.
Wickham, H., François, R., Henry, L., and Kirill Müller (2020). dplyr: A Grammar of Data Manipulation. R
package version 1.0.2. https://CRAN.R-project.org/package=dplyr
World Health Organization (WHO). (2019). A new approach to rodent control to better protect human
health: rst international meeting of experts under the auspices of WHO and the Pan American Health
Organization–Une nouvelle approche du contrôle des rongeurs pour mieux protéger la santé de l’Homme:
première réunion internationale d’experts sous l’égide de l’OMS et de l’Organisation Panaméricaine de la
Santé. Weekly Epidemiological Record= Relevé épidémiologique hebdomadaire, (17), 197-203.
Figures
Figure 1
Page 19/26Convention on Biological Diversity (CBD) pathway classi cation. Invasive alien species introduction
pathway framework uses a hierarchical approach in which alien species may arrive in a new location
through three broad mechanisms (i.e. movement of a commodity, arrival of a transport vector, or spread
from a neighbouring region), 6 main pathways (i.e. release, escape, contaminant, stowaway, corridor, and
unaided) and 44 pathway subcategories (e.g. ornamental, aquaculture, seed contaminant, etc.). Figure
adapted from Hulme et al., 2008; CBD 2014 and Harrower et al., 2018.
Figure 2
Cost of species by introduction pathways. (a) Total cost of invasive alien species by pathway for the
period (1970-2020) and (b) average cost per invasive alien species per pathway. Species can have
multiple pathways although in this gure we only present ‘primary’ pathways of introduction that are
likely to lead to successful long-distance introductions (see methods), which reduces the number of
pathways per species. The width of the bars in (a) is equivalent to the number of species.
Page 20/26Figure 3
Average cost per invasive alien species by introduction pathway sub-category (1970-2020) (USD 2017
value). Species can have multiple pathways. Only ‘primary’ pathways of introduction are included in this
gure. Boxes are coloured based on the main CBD pathway classi cation and ranked according to the
median cost of species in each pathway sub-category.
Page 21/26You can also read