PRESENTATION TO DEBT INVESTORS - Societe Generale
←
→
Page content transcription
If your browser does not render page correctly, please read the page content below
SOCIETE GENERALE
P RE S EN TAT IO N TO DE BT I NV E STO R S
               1 ST Q U A R T E R 2 0 1 8

                      MAY 2018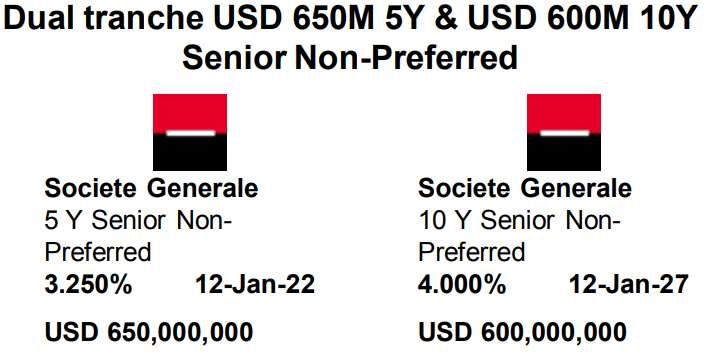
DISCLAIMER
The information contained in this document (the “Information”) has been prepared by the Societe Generale Group (the “Group”) solely for informational purposes. The Information is
proprietary to the Group and confidential. This presentation and its content may not be reproduced or distributed to any other person or published, in whole or in part, for any purpose
without the prior written permission of Societe Generale.
 The Information is not an offer to buy or sell or a solicitation of an offer to buy or sell any security or instrument or to participate in any trading strategy, and does not constitute a
recommendation of, or advice regarding investment in, any security or an offer to provide, or solicitation with respect to, any securities-related services of the Group. This presentation is
information given in a summary form and does not purport to be complete. It is not intended to be relied upon as advice to investors or potential investors and does not take into account
the investment objectives, financial situation or needs of any particular investor. Investors should consult the relevant offering documentation, with or without professional advice when
deciding whether an investment is appropriate.
This presentation contains forward-looking statements relating to the targets and strategies of the Societe Generale Group. These forward-looking statements are based on a series of
assumptions, both general and specific, in particular the application of accounting principles and methods in accordance with IFRS (International Financial Reporting Standards) as adopted
in the European Union, as well as the application of existing prudential regulations. These forward-looking statements have also been developed from scenarios based on a number of
economic assumptions in the context of a given competitive and regulatory environment. The Group may be unable to:
- anticipate all the risks, uncertainties or other factors likely to affect its business and to appraise their potential consequences;
- evaluate the extent to which the occurrence of a risk or a combination of risks could cause actual results to differ materially from those provided in this document and the related
presentation.
Therefore, although Societe Generale believes that these statements are based on reasonable assumptions, these forward-looking statements are subject to numerous risks and
uncertainties, including matters not yet known to it or its management or not currently considered material, and there can be no assurance that anticipated events will occur or that the
objectives set out will actually be achieved. Important factors that could cause actual results to differ materially from the results anticipated in the forward-looking statements include, among
others, overall trends in general economic activity and in Societe Generale’s markets in particular, regulatory and prudential changes, and the success of Societe Generale’s strategic,
operating and financial initiatives. Unless otherwise specified, the sources for the business rankings and market positions are internal.
Other than as required by applicable law, Societe Generale does not undertake any obligation to update or revise any forward-looking information or statements information, opinion,
projection, forecast or estimate set forth herein.
More detailed information on the potential risks that could affect Societe Generale’s financial results can be found in the Registration Document [and its updates] filed with the French
Autorité des Marchés Financiers.
Investors are advised to take into account factors of uncertainty and risk likely to impact the operations of the Group when considering the information contained in such forward-looking
statements.

The financial information presented for the quarter ending 31st March 2018 was examined by the Board of Directors on 3rd May 2018 and has been prepared in accordance with IFRS as
adopted in the European Union and applicable at this date, and has not been audited. Figures in this presentation are unaudited. The consolidated financial statements for the first quarter
2018 does not constitute financial statements for an interim period as defined by IAS 34 “Interim Financial Reporting”, and has not been audited. Societe Generale’s management intends
to publish complete consolidated financial statements for the year ended 31st December 2018.
By receiving this document or attending the presentation, you will be deemed to have represented, warranted and undertaken to (i) have read and understood the above notice and to
comply with its contents, and (ii) keep this document and the Information confidential.
INTERCONNECTING REGIONS AND FRANCHISES, AT THE BENEFIT OF OUR CLIENTS

  A EUROPEAN LEADER CONNECTING                   WITH LEADING FRANCHISES ACROSS
                                                                                                             KEY FIGURES(1)
 EUROPE TO THE REST OF THE WORLD                            THE BOARD
                                                                                        FRENCH RETAIL BANKING
                                                     N°1 Online Bank in France
   ASIA                                              N°3 Retail Bank in France             38,000 employees
- OCEANIA                                                                                  EUR 191bn in outstanding loans
                     69%                             N°3 Private Bank in France
   6%                                     CEE
                                                                                        INTERNATIONAL RETAIL BANKING AND
                                                   N°2 in Romania, N°3 in Czech         FINANCIAL SERVICES
                                          10%
                                                 Republic, N°2 foreign bank in Russia
                 WESTERN                            and leading international              73,000 employees
                 EUROPE                                     bank in Africa                 EUR 115bn in outstanding loans
   AMERICAS                             RUSSIA         N°1 in Fleet Management
                                                     in Europe and Top 3 globally       GLOBAL BANKING AND INVESTOR SOLUTIONS
        7%             AFRICA            3%
                                                 N°2 in Equipment Finance globally         21,000 employees
                          5%
                                                                                           Assets under management (Lyxor and Private
                                                     World leader in Derivatives           Banking): EUR 230bn
                                                                                           Assets under custody: EUR 3,904bn
                                                    Leader in Structured Finance           EUR 135bn in outstanding loans
             % of 2016 Group revenues                Lyxor Top 3 ETFs in Europe          (1)   Figures as of Q4 2017

                                                                                           PRESENTATION TO DEBT INVESTORS     MAY 2018   3
1
 GROUP
RESULTS
1 – GROUP RESULTS

                                                                                        Q1 18 MAIN TAKEAWAYS

                                 Revenues (1)                                                          Cost(2) base under control                                                Very low Cost of Risk (3)
  In EUR m                                                                            In EUR m

                                    -2.5%                                                                                                                                          24
                                                                                                                        +1.0%
                                                                                                                                                                                                   18
                                                                                                                                                                                                             bp

                                                                                                            4,183                   4,223                                          277
                        6,452                   6,294
                                                                                                                                                                                                   208       EUR m
                                                                                                                                                                                         -24.9%

                       Q1 17                   Q1 18                                                       Q1 17                   Q1 18                                         Q1 17            Q1 18

                Group Net Income and ROTE                                                                                                   Strong balance sheet & robust ratios

                                                                                                                              CET 1 Ratio (5) at 11.2% and Total Capital Ratio at 16.8%

                        12.1%
                                               10.9%         ROTE(2)
                                                                                                                               TLAC ratio at 21.8% at 31.03.2018. vs. 21.5% at 31.03.2017

                                  -13.5%                                                                                       Leverage ratio at 4.1% at 31.03.2018. vs. 4.1% at 31.03.2017
                        1,392                                GNI(4)(EUR m)
                                                1,204
                                                                                                              Moody’s upgraded Societe Generale’s LT ratings to A1 on April 11th, 2018

                       Q1 17                   Q1 18
(1) Excluding non-economic items for Q1 17. Non-economic items (revaluation of financial liabilities and DVA) are no longer restated from reported datas from 2018.
(2) Underlying data: adjusted for IFRIC 21 linearisation in Q1 18. See p. 40 and Methodology.
(3) Annualised, in basis points. Outstandings at the beginning of period. Excluding litigation
(4) Underlying data: adjusted for exceptional items (allocation to provision for disputes in Q1 17) and for IFRIC 21 linearisation. See p. 40 and Methodology.
(5) Fully-loaded, based on CRR/CRD4 rules, including the Danish compromise for Insurance. See Methodology

                                                                                                                                                                      PRESENTATION TO DEBT INVESTORS      MAY 2018   5
1 – GROUP RESULTS

      DYNAMIC PERFORMANCE IN RETAIL ACTIVITIES, LOWER REVENUES IN MARKETS
                             Q1 18 ROTE AT 10.9%(2)
                           Revenues(1)
                           EUR 6.3bn
                        -2.5% vs. Q1 17                                                         Good commercial dynamism in retail activities
                                                                                                French Retail Banking revenues still impacted by low rate environment but expected
                   Operating Expenses(2)                                                        to stabilise in 2018
                                                                                                Revenue growth in International Retail Banking and Financial Services
                          EUR 4.2bn
                        +1.0% vs. Q1 17
                                                                                                Lower revenues for Global Banking and Investor Solutions, affected notably by
                                                                                                a weaker USD
                      Net Cost of Risk(3)                                                       Lower market revenues versus a strong Q1 17
                             18bp                                                               Stable* revenues in Financing and Advisory
                         -6bp vs. Q1 17
                                                                                                Cost base under control (underlying Operating Expenses +0,5% exc. SRF
                    Group Net Income(4)                                                         increase)
                          EUR 1.2bn                                                             Acceleration of transformation in French Retail Banking
                       -13.5% vs. Q1 17                                                         Positive jaws effect in International Retail Banking and Financial Services
                                                                                                Flat cost base in Global Banking and Investor Solutions
                         Profitability(2)
                                                                                                Very low cost of risk
                     Q1 18 ROTE 10.9%

(1)  Excluding non-economic items for Q1 17. Non-economic items (revaluation of financial liabilities and DVA) are no longer restated from reported data from 2018.
(2)  Underlying data: adjusted for IFRIC 21 linearisation. See p. 40 and Methodology.
(3)  Annualised, in basis points. Outstandings at the beginning of period. Excluding litigation.
(4)  Underlying data: adjusted for exceptional items (allocation to provision for disputes in Q1 17) and for IFRIC 21 linearisation. See p. 40 and Methodology.
* When adjusted for changes in Group structure and at constant exchange rate

                                                                                                                                                     PRESENTATION TO DEBT INVESTORS   MAY 2018   6
1 – GROUP RESULTS

                                                      LOW COST OF RISK FOR ALL BUSINESSES

                                                                                                                                                                         Cost
                                                                                                                                                                          Costof
                                                                                                                                                                              of Risk(1) (in
                                                                                                                                                                                 Risk(1)  (inbp)
                                                                                                                                                                                              bp)
                                                                                          French Retail Banking
                                                                                                                                                                                        38
                                                                                                                                                    29          30                                  29
      Stable cost of risk                                                                                                                                                   22

                                                                                                                                                  Q1 17       Q2 17     Q3 17       Q4 17        Q1 18

                                                                    International Retail Banking and Financial Services
                                                                                                                                                    35                      33          34         28
      Cost of risk at a very low level, stable vs. 2017 levels                                                                                                  14
      Low levels in Europe and Russia
                                                                                                                                                  Q1 17       Q2 17     Q3 17       Q4 17       Q1 18

                                                                              Global Banking and Investor Solutions
                                                                                                                                                     9           1          -1          -8          -7
      Continuing net write-backs
      Repayments and exits from default and overall improvement in portfolio risk profile
                                                                                                                                                  Q1 17       Q2 17     Q3 17       Q4 17       Q1 18

                                                                                                       Group
                                                                                                                                                     24                                 22
                                                                                                                                                                15          17                     18
      Low cost of risk across all businesses
      NPL ratio at 4.2% confirming continuous reduction trend
                                                                                                                                                  Q1 17       Q2 17     Q3 17       Q4 17       Q1 18

(1)   Cost of risk in basis points including IFRS 9 for Q1 18. Outstandings at beginning of period. Annualised. Data restated for GTPS transfer from French Retail Banking to Global Banking and Investor Solutions.

                                                                                                                                                         PRESENTATION TO DEBT INVESTORS               MAY 2018         7
1 – GROUP RESULTS

                                                                                   Q1 2018 RESULTS

                                               In EUR m                                                     Q1 18       Q1 17            Change

                                               Net banking income                                           6,294        6,474       -2.8%    -0.4%*

                                                 Underlying net b anking income(1)                          6,294       6,452        -2.5%

                                               Operating expenses                                          (4,729)      (4,644)      +1.8%   +4.3%*

                                                 Underlying operating expenses(1)                          (4,223)      (4,183)      +1.0%

                                               Gross operating income                                       1,565        1,830      -14.5%   -12.6%*

                                                 Underlying gross operating income(1)                       2,071       2,269        -8.7%

                                               Net cost of risk                                             (208)        (627)      -66.8%   -65.2%*

                                               Operating income                                             1,357        1,203      +12.8%   +15.0%*

                                                 Underlying operating income(1)                             1,863       1,992        -6.5%

                                               Net profits or losses from other assets                        1           37        -97.3%   -97.5%*

                                               Income tax                                                   (370)        (389)       -4.9%    -3.7%*

                                               Reported Group net income                                     850          747       +13.8%   +23.2%*

                                                 Underlying Group net income(1)                             1,204       1,392       -13.5%

                                               ROTE                                                         7.4%         6.0%

                                               Underlying ROTE(1)                                           10.9%       12.1%

                                             Underlying Group Net Income(1): EUR 1,204m in Q1 18 -13.5% vs. EUR 1,392m in Q1 17
                                                           Underlying ROTE(1) : 10.9% in Q1 18 vs. 12.1% in Q1 17
(1)   Adjusted for exceptional items, IFRIC 21 linearisation and non-economic items (for Q1 17). See Methodology and Supplement p. 40.
*     When adjusted for changes in Group structure and at constant exchange rate

                                                                                                                                              PRESENTATION TO DEBT INVESTORS   MAY 2018   8
2
CAPITAL AND
 LIQUIDITY
2 – C A P I T A L A ND L I Q UI DI T Y

                                                  BALANCE SHEET RATIOS
                                       COMFORTABLY ABOVE REGULATORY REQUIREMENTS

                                       2018 requirements                           End-Q1 18 ratios                       2019 requirements(4)                    Investor day target

                                                                               Phased-in(3)         Fully-loaded
                                                          (5)
          CET1                                  8.6%                           11.3%                  11.2%                          9.5%(2)                             >12%
  Total Capital                                 12.1%                          16.9%                 16.8%                            13.0%
Leverage ratio                                  3.5%(7)                                     4.1%                                     3.5%(7)                         [4% - 4.5%]
                                                                                     21.8% (% RWA)                              19.5% (% RWA)
        TLAC(1)                                                                      6.6% (% leverage)                          6.0% (% leverage)

           LCR                                 >100%                                      129%(6)                                    >100%                              >100%
         NSFR                                  >100%                                      >100%                                      >100%                              >100%
(1)   Refer to p.13 for detailed presentation of TLAC ratio
(2)   Excluding Pillar 2 Guidance add-on and CCy buffer
(3)   Including the earnings of the current financial year
(4)   Requirements are presented as of today’s status of regulatory discussions and without non-significant impact of countercyclical buffer
(5)   Excluding countercyclical buffer
(6)   Average on Q1 18
(7)   Requirement expected to be set at 3.5% in the future

                                                                                                                                                PRESENTATION TO DEBT INVESTORS   MAY 2018   10
2 – C A P I T A L A ND L I Q UI DI T Y
STRONG BALANCE SHEET
Q1 18: change in Fully-Loaded CET1(1) Ratio (in bp)
CET1(1) at 11.2%, -20bp /Q4 17
Hybrid coupons -3bp
Impact of IFRS 9 (-14bp) -16bp
-11bp
Impact of IPC on Resolution Funds deduction (-8bp) -5bp
-22bp
+2bp
Total capital ratio at 17.1%(2) +34bp IFRS 9
SRF
11.4%
11.2%
TLAC SRF
22.1%(2) of RWA and 6.7%(2) of leverage exposure
Underlying Dividend IFRIC21 IFRS9 & Others
Q4 17 RWA* Q1 18
Earnings provision SRF
Leverage ratio at 4.2%(2) IFRS 9
Shareholder’s equity (in EURm) CET1 (in bp)
(1,242) +297 (945) (27) +13 (14)
Rating
Long-term deposit and senior unsecured debt ratings upgraded to A1
by Moody’s
Non-preferred senior debt rating upgraded to Baa2 by Moody’s Gross Tax Net Accting. EL shortfall CET 1
impact
(1) Fully-loaded, based on CRR/CRD4 rules, including the Danish compromise for Insurance. See Methodology.
(2) Pro-forma of USD 1.25bn AT1 issuance in April 2018. Total capital ratio at 16.8%, TLAC at 21.8%/6.6% and leverage ratio at 4.14% excluding AT1 issuance.
* When adjusted for changes in Group structure and at constant exchange rate
PRESENTATION TO DEBT INVESTORS MAY 2018 112 – CAPITAL AND LIQUIDITY
STRONG TLAC RATIO ALREADY IN LINE WITH REGULATORY REQUIREMENTS
TLAC ratio
Already meeting 2019 (~19.5%) requirements and on track for
2022 (~21.5%)(1)
PONV RESOLUTION
% RWA(1)
21,8% EUR 62.8bn
19,5% Senior Preferred
2,5%
Senior Non- Senior
2,5% Preferred Non-preferred
Tier 2 Tier 2
3,2%
Additional Tier 1 AT1 8.9
2,4% Preferred
CET1 CET1 14.4
Senior
% Leverage
8.5
6% 6,6%
11,2%
39.8
2019 31.03.2018 2019 31.03.2018 31.03.2018
Requirements Requirements
(1) Without contra cyclical buffer
PRESENTATION TO DEBT INVESTORS MAY 2018 122 – CAPITAL AND LIQUIDITY
2020 ROADMAP
STRONG BALANCE SHEET
CET1 evolution(1)
Target
11.5% Refocusing ≥12.0%
11.4% ~5% of RWA
+27bps
-40bps
Organic capital
Exceptional -14bps +~25bps p.a.
generation -8bps
items IFRS 9 Organic capital
SRF*
generation per
year
2016 2017 2020
Targeting a 11.5% CET 1 ratio in end 2018
Manageable impact of Basel 3 completion (from 2022) : ~EUR +38bn increase in RWA on credit and operational risk (~+11%)(2)
All balance sheet ratios above regulatory requirements
Dividend payout at 50% and dividend floor at EUR 2.20 per share(3)
* Impact of IPC on Resolution Funds deduction
(1) Fully-loaded, based on CRR/CRD4 rules, including the Danish compromise for Insurance
(2) Based on B/S and P&L as of end 2016. Before any management actions and further guidance on transposition in European law. Calibration of market risk (FRTB) still under review. No effect from output floor before 2027
(3) 2017 dividend proposed by the Board to the Ordinary General meeting of shareholders approval
PRESENTATION TO DEBT INVESTORS MAY 2018 132 – CAPITAL AND LIQUIDITY
OUR SOLID BALANCE SHEET
IS THE BACKBONE OF OUR DEVELOPMENT
Target capital structure
CET1 ≥12% with an average annual organic capital generation of
~25bps(1) and a large buffer over MDA while financing: ~7%
~+3% RWAs growth p.a. ~3%
~1.5%-2%
Pay-out ratio at 50%
≥12%
Leverage ratio maintained between 4.0% to 4.5%
Moving towards a more cost-effective TLAC structure with a
balanced and moderate average yearly funding program: ~EUR Expected funding program(2)
12bn(2) Yearly average 2018-2020
Senior Preferred and Secured debt ~EUR 2.5bn
Well-prepared to meet TLAC and MREL requirements Senior Non Preferred debt
~EUR 6/7bn
(1) Excluding IFRS 9 limited first time application impact Subordinated debt (AT1/T2) ~EUR 2.5/3bn Max
(2) Excluding structured notes
PRESENTATION TO DEBT INVESTORS MAY 2018 142 – CAPITAL AND LIQUIDITY
A CONSERVATIVE BALANCE SHEET MANAGEMENT
Funded Balance sheet*
(excluding repos) Loan to Deposit
Assets Liabilities
Ratio
NET CENTRAL SHORT TERM
61 60 RESOURCES 104%
BANK DEPOSIT 112 89
14 11 OTHER 98%
INTERBANK 95% 95%
29 93% 94%
LOANS 28 452
453 443
155 159 MEDIUM/LONG 422 421 424 421
CLIENT RELATED 90 402
83 TERM 354 340 369 377
TRADING ASSETS
RESOURCES
SECURITIES 57 66
Q4-13 Q4-14 Q4-15 Q4-16 Q4-17 Q1-18
Loans Deposits L/D ratio
443 452 CUSTOMER
CUSTOMER DEPOSITS
LOANS 424 421
61 61 EQUITY
LONG TERM ASSETS 39 39
Q4-17 Q1-18 Q1-18 Q4-17
* See methodology p.73
PRESENTATION TO DEBT INVESTORS MAY 2018 152 – C A P I T A L A ND L I Q UI DI T Y
STRENGTHENED FUNDING STRUCTURE
Liquid Asset Buffer (in EUR bn)
Very strong balance sheet 157 158 155 174 167
High quality asset buffers
Diversified and sustainable funding mix
94 73
Regular improvement of the loan to deposit ratio 84 87 76
Liquid asset buffer of EUR 167bn at end-March 18
77
63 64
High quality of the liquidity reserve: EUR 77bn of HQLA assets at end-March 64 61
2018 and EUR 74bn of Central bank deposits 10 16 16 16
8
Excluding mandatory reserves and unencumbered, net of haircuts T1-17
Q1 17 T2-17
Q2 17 T3-17
Q3 17 T4-17
Q4 17 T1-18
Q1 18
Central bank High quality liquid Central bank
deposits(1) asset securities(2) eligible assets(2)
Comfortable LCR at 129% on average in Q1 18
NSFR above regulatory requirements Funding from US money market
46.0 funds(3) (USD bn)
Normal access to USD funding and no material exposure to USD interest
rates
Limited short term wholesale funding (~8% of funded balance sheet excl. repos) 26.4
20-25% of the Group balance sheet is in USD. 24.0
17.6 17.1
Diversified funding mix 14.4
8.9
* See Methodology 5.4
(1) Excluding mandatory reserves
(2) Unencumbered, net of haircuts
(3) Sources: SEC Form N-MFP2, OFR Analysis Q1 11 Q1 12 Q1 13 Q1 14 Q1 15 Q1 16 Q1 17 Q1 18
(4) Excluding consumer finance
PRESENTATION TO DEBT INVESTORS MAY 2018 162 – CAPITAL AND LIQUIDITY
2018 LONG TERM FUNDING PROGRAMME WELL ADVANCED AT COMPETITIVE
CONDITIONS
2018 Completed programme breakdown
Parent company 2018 vanilla funding programme of ~EUR 12bn, broken
down consistently with the average trajectory communicated during the Senior structured
7%
Investor Day 8%
Covered Bonds
Annual structured notes issuance volume in line with amounts issued
over the past years (i.e. ~EUR 19bn) EUR 15bn Senior Non-Preferred
26% 54%
Diversification of the investor base by currencies and maturities Tier 2
5% AT1
2018 Completed transactions & prefunding
As of 13 April 2018:
- ~56% completion of the vanilla funding programme(1) SG SFH SG SG SG
10Y Covered Bond 7Y SNP 10NC5 Tier 2 5Y SNP
(including EUR 1.5bn of prefunding in 2017) 0.750% Jan-2028 1.125% Jan-2025 1.375% Feb-2023/28 3mE+0.45% Mar-2023
- ~EUR 7.9bn of structured notes EUR 750M EUR 1,250M EUR 1,000M EUR 1,000M
- Competitive funding conditions: MS6M+15bp and
average maturity of 5.0 years (incl. senior non
preferred debt, senior preferred debt and covered
bonds)
- Additional EUR 1.7bn issued by subsidiaries
SG SG SG
PerpNC10 AT1 5Y SNP 10Y SNP
6.750% Apr-2028 0.500% Jan-2023 1.375% Jan-2028
USD 1,250M EUR 750M EUR 750M
(1) Excluding structured notes
PRESENTATION TO DEBT INVESTORS MAY 2018 172 – C A P I T A L A ND L I Q UI DI T Y
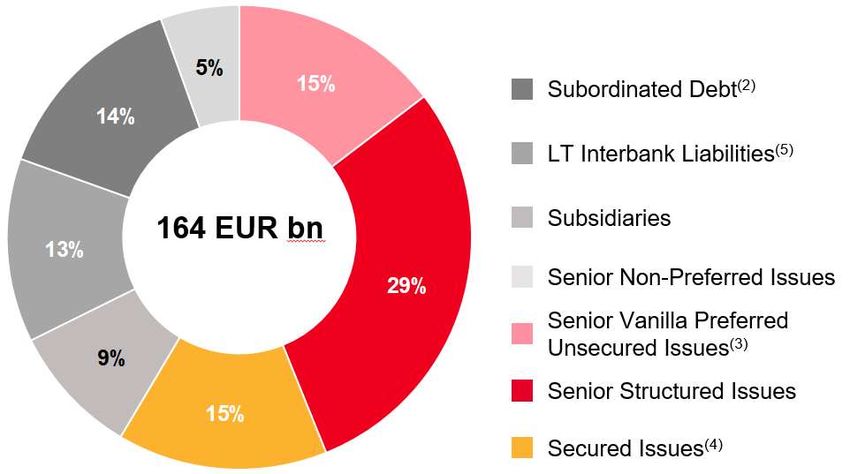
DIVERSIFIED ACCESS TO LONG TERM FUNDING SOURCES
Long Term Funding Breakdown(1)
Access to diversified and complementary investor bases through:
Subordinated issues
Senior vanilla issuances (public or private placements)
Senior structured notes distributed to institutional investors, private banks
and retail networks, in France and abroad EUR 164bn
Covered bonds (SFH, SCF) and securitisations
Issuance by Group subsidiaries
31.03.2018
Access to local investor bases by subsidiaries which issue in their own
names or issue secured transactions (Russian entities, ALD, GEFA,
Crédit du Nord, etc.) Balanced amortisation(1) schedule (at 31.03.2018, in EUR bn)
Increased funding autonomy of IBFS subsidiaries
33.1
Balanced amortisation schedule 25.0
22.9
19.5
16.9 15.7
9.8 2.6 3.8
(1) See Methodology
6.8 8.1
(2) Including undated subordinated debt
(3) Including CD & CP >1y 2018 2019 2020 2021 2022 2023 2024 2025 2026 2027 >2027
(4) Including CRH
(5) Including IFI
PRESENTATION TO DEBT INVESTORS MAY 2018 182 – CAPITAL AND LIQUIDITY
CREDIT RATING OVERVIEW
Credit Rating as of April 2018
Moody’s upgraded Societe Generale’s LT senior unsecured
ratings to A1 on April 11th, 2018 DBRS Fitch Moody’s S&P
LT/ST
AA/R-1(high) A+(dcr) A1(cr)/P-1(cr) A/A-1
Key strengths reflected in ratings are SG’s solid franchises, Counterparty
sound capital and liquidity
LT unsecured
A(high) A+ A1 A
Strong franchises senior pref debt
Fitch: “Sound company profile, which benefits from franchise strengths across
selected products and geographies” Outlook Stable Stable Stable Stable
Moody’s: “Strong franchise and well-diversified universal banking business model”
S&P: “Solid foundation in domestic retail, corporate and investment banking, and ST senior F1 P-1 A-1
R-1(middle)
financial services to corporates. Consistent strategy and well-diversified revenues by unsecured debt
business lines and geography”
LT unsecured A Baa2 BBB+
n/a
Sound balance-sheet metrics SNP debt
Fitch: “Strong internal capital generation” Dated Tier 2
n/a A- Baa3 BBB
Moody’s: “Regulatory capitalisation is good and improving, underpinned by a strong subordinated
earnings generation capacity […] Liquidity is strong and broadly in line with large
European peers” Additional
n/a BB+ Ba2(hyb) BB+
S&P: “Steady build-up of a comfortable bail-in-able debt cushion” Tier 1
NB: The above statements are extracts from the rating agencies reports on Societe Generale and should not be relied upon to reflect the agencies opinion. Please refer to full rating reports
available on Societe Generale and the agencies’ websites.
PRESENTATION TO DEBT INVESTORS MAY 2018 193 BUSINESS RESULTS
3 – B U S I NE S S R E S U L TS

                                             DYNAMIC CLIENT FRANCHISES

                                                 INTERNATIONAL RETAIL BANKING                   GLOBAL BANKING
          FRENCH RETAIL BANKING
                                                    AND FINANCIAL SERVICES                   AND INVESTOR SOLUTIONS

     Developing growth initiatives, in a         Strong momentum in International      Maintaining leadership positions while
     quarter still impacted by last year’s        Retail Banking, with significant     focusing on core franchises in Global
     renegotiation trend and by the low                 positive jaws effect                          Markets
             rates environment
                                                Getting more from the bancassurance
    Ongoing transformation of our model                         model
                                                                                          Delivering on growth initiatives in
         to reach key milestones
                                                                                                Financing & Advisory
                                                  Sound performance in Financial
                                                     Services to Corporates

          2018: STABILISATION OF                   2018: STRONG NET INCOME                    2018: HIGHER RETURN
                 REVENUES                                   GROWTH                           THAN EUROPEAN PEERS

                                                                                      PRESENTATION TO DEBT INVESTORS   MAY 2018   21
3 – B U S I NE S S R E S U L TS - F R E N C H R E T A I L B A NK I N G
TOWARDS STABILISATION OF REVENUES IN 2018
Protecting margins
Revenues(1) down -1.6% in Q1 18 Revenues(3) / average outstandings ratio
Net interest margin down -4.3%: good momentum on volumes offset Societe Generale
5%
by low interest rates and high basis of early repayment and
BNP Paribas
renegotiation fees in Q1 17
4% BPCE
Fees down -0,9% vs. Q1 17, representing 42% of Q1 18 total NBI
Credit Agricole
3%
Operating expenses up +4.2% vs. Q1 17 2%
2010 2011 2012 2013 2014 2015 2016 2017
Investment in the transformation, growth drivers and
compliance set-up
French Retail Banking Results
In EUR m Q1 18 Q1 17 Change
Low cost of risk Net banking income 2,008 2,023 -0.7%
Net b anking income excl.
1,992 2,025 -1.6%
PEL/CEL
Operating expenses (1,480) (1,420) +4.2%
Gross operating income 528 603 -12.4%
Contribution to Group Net Income:
Gross operating income
EUR 270m in Q1 18 excl. PEL/CEL
512 605 -15.4%
RONE(2) 10.8% in Q1 18 Net cost of risk (134) (129) +3.9%
Operating income 394 474 -16.9%
(1) Excluding PEL/CEL provision
Reported Group net income 270 331 -18.4%
(2) Adjusted for IFRIC 21 implementation and PEL/CEL provision
(3) Companies data, revenues adjusted for hedging costs for Credit Agricole (LCL + Regional Banks) RONE 9.5% 12.3%
in 2016 and Societe Generale in 2017 Underlying RONE(2) 10.8% 14.1%
PRESENTATION TO DEBT INVESTORS MAY 2018 223 – B U S I NE S S R E S U L TS - F R E N C H R E T A I L B A NK I N G
KEEP INVESTING TO TRANSFORM OUR FRENCH RETAIL MODEL
Investing in transformation while sticking to ID target 2018 Investing to secure 2019 - 2020 efficiency gains
EURm
People
2018 TARGET ID TARGET
Social agreement under new labour law signed to support transformation in3 – B U S I NE S S R E S U L TS - F R E N C H R E T A I L B A NK I N G
CONTINUING SHIFT IN THE MODEL FOR INDIVIDUAL CLIENTS
Key French Retail Banking highlights
Selective origination strategy: number of mass affluent and wealthy clients +5.4% vs. Q1 17
Production: Home loan production -19% vs. high Q1 17, Consumer credit production +16% vs. Q1 17
Individual client loan outstandings: +2.8% vs. Q1 17
Developing our Wealthy Clients franchise Q1 18 highlights
AuM
Net inflows (EUR bn)
A dedicated set-up to address ~70,000 clients 61 62
+EUR 1.1bn
(client > EUR 500k AUM)
Q1-17 Q1-18
Keep growing our online banking leader
Q1 18 highlights
New clients
A fully-fledged bank with no branches: a full-service offering with (in 000) 1.4m clients as of 31 March
average AuM(1) of EUR 18,000 per client 126
+57% Acceleration in client acquisition in Q1:
A proven increasingly efficient growth model 80 almost doubling 2016/17 annual growth trend
A strong client base: new younger and more active clients EUR 18.5bn of Assets Under Administration
The most price-competitive bank in France for 9 years EUR 6.2bn of Loan outstandings
High level of client satisfaction Q1-17 Q1-18
(1) Assets under administration and loans
PRESENTATION TO DEBT INVESTORS MAY 2018 243 – B U S I NE S S R E S U L TS - F R E N C H R E T A I L B A NK I N G
FURTHER ENHANCING OUR EXPERTISE ON CORPORATES AND PROFESSIONALS
Key French Retail Banking highlights
Number of clients: Corporate +2.5% ; Professional +1.6% vs. Q1 17
Production: Medium-term loan production +10% vs. Q1 17
Medium-term Corporate loan outstandings: +3.3% vs. Q1 17
Focus on Credit du Nord Professional Clients Q1 18 highlights
A Top Player with a bespoke organisation, supported by 8 Dynamic financing activity
regional banks
Medium-term loan outstandings: +5.3% vs. Q1 17
158,000 clients including 109,000 who are both business and
private clients Leasing outstandings +5.7% vs.Q1 17
Joint No. 2 for customer satisfaction: main banker for 70% of New business relationships: +6,200 vs. Q1 17
clients and sole banker for 60% of clients
Professionals generating 35% of Credit du Nord revenues Launch of several partnerships
Successful push on the most demanding and profitable
segments: small businesses, real-estate management, legal
services, independent professionals and “Franchise” businesses
PRESENTATION TO DEBT INVESTORS MAY 2018 253 – B U S I NE S S R E S U L TS - I N TE RN A T I O N A L R E T A I L B A NK I N G A N D F I N A N C I A L S E RV I C E S
VERY GOOD FINANCIAL PERFORMANCE
Loans and Deposits (in EURbn – change vs. end-Q1 17)
Volume growth supporting revenues in International +8.2%* 88,9 80,6 +7.7%*
Total
Retail Banking
18,5 2,0
Western Europe
Strong positive jaws: revenues +8.3%* vs. Q1 17, operating
expenses +3.9%* vs. Q1 17 +7.7%* 24,4
31,4
+5.4%* Czech Republic
Europe
Contribution to Group net income +18.7% vs. Q1 17 Romania
6,5 9,5
10,7 9,9 Other Europe
+7.4%* 8,9 8,3
Strong financial performance in Insurance +24.3%*
Russia
19,9 19,6
Contribution to Group net income +18.3% (+7.7% excluding +10.1%* +7.9%*
Africa and Others
Antarius acquisition)
Loans Deposits
Sound performance from Financial Services to International Retail Banking and Financial Services Results
Corporates In EUR m Q1 18 Q1 17 Change
Net banking income 1,989 1,940 +2.5% +3.9%*
ALD fleet +9%, Equipment Finance +7%*(2) vs. Q1 17 Operating expenses (1,179) (1,177) +0.2% +3.2%*
ALD consolidated at ca. 80% Gross operating income 810 763 +6.2% +5.1%*
Net cost of risk (91) (111) -18.0% +9.8%*
Operating income 719 652 +10.3% +4.5%*
Contribution to Group Net Income: EUR 429m in Q1 18 Net profits or losses from
4 35 -88.6% -89.3%*
other assets
RONE(1): 17% in Q1 18 Reported Group net income 429 428 +0.2% +0.7%*
RONE 15.1% 15.3%
* When adjusted for changes in Group structure and at constant exchange rates Underlying RONE(1) 17.0% 17.7%
(1) Adjusted for IFRIC 21 implementation
(2) Loans and leases outstanding, excluding factoring
PRESENTATION TO DEBT INVESTORS MAY 2018 263 – B U S I NE S S R E S U L TS - I N TE RN A T I O N A L R E T A I L B A NK I N G A N D F I N A N C I A L S E RV I C E S
GOOD MOMENTUM IN INTERNATIONAL RETAIL BANKING DELIVERING 15.5%(1) RONE
Strong Performance in Europe Typical Q1 Seasonality in Russia Positive Jaws in Africa and Other
+6%*
740 766
+2%* +13%*
471 464 46 47
39 368 392 +7%*
239 243
14 18
Q1 17 Q1 18 Q1 17 Q1 18 Q1 17 Q2 17 Q3 17 Q4 17 Q1 18 Q1 17 Q1 18 Q1 17 Q1 18
Revenues Operating Expenses SG Russia contribution to Group Net Income Revenues Operating Expenses
(EURm) (EURm) (EURm) (EURm) (EURm)
Net Interest Income +7%*, supported by Positive jaws in Q1 18: SG Russia revenues Steps to improve profitability to a 2020
volume growth +9%*, operating expenses +7%* RONE >15%(2):
Positive jaws effect Limited impact from recently announced US Further revenue growth from initiatives in
Low cost of risk sanctions FX, structured finance, GTB and
accelerating retail activity
Operating efficiency gains from regional
hubs and digitalisation
* When adjusted for changes in Group structure and at constant exchange rates.
(1) Adjusted for IFRIC 21.
(2) Excluding French overseas territories.
PRESENTATION TO DEBT INVESTORS MAY 2018 273 – B U S I NE S S R E S U L TS - I N TE RN A T I O N A L R E T A I L B A NK I N G A N D F I N A N C I A L S E RV I C E S
GETTING MORE FROM THE BANCASSURANCE MODEL
Over EUR 2bn of Insurance revenues across Group businesses in 2017
Booked in Insurance Business Unit Booked in Retail Networks Growth in Synergies
13% 20%
EUR EUR EUR 2.1bn
0.8bn 1.3bn +8%(2) vs.
87% 80%
2016
International France International France (2) Excluding Antarius acquisition
A Good Start to the 2020 Plan in France Fully Online Customer Journeys Launched in Q1 18
31%
12% 21% 24%
9% 100% mobile and online home and car insurance
8% for Societe Generale clients
Online health checks for borrower insurance
2016 2017 2020 2016 2017 2020
P&C Equipment Rate Unit-Linked Share of Life Insurance Pay per km online car insurance with Boursorama
Insurance Q1 18 RONE: 20.6%(1) vs. 19.0% 2017
(1) Adjusted for IFRIC 21.
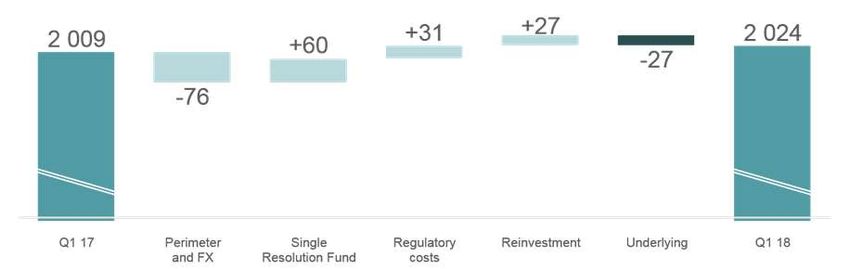
PRESENTATION TO DEBT INVESTORS MAY 2018 283 – B U S I NE S S R E S U L TS - G L O B A L B A N K I N G A ND I N V E S TO R S O L U TI O N S
CONTINUED COST AND RISK DISCIPLINE LEADING TO RONE ABOVE 10%
Operating expenses (in EURm)
Revenues down -13.4% vs. Q1 17 impacted by strong negative
FX effect
Operating expenses up +1.6%* vs. Q1 17 (excl. SRF increase)
Full effect of 2015-2017 efficiency gains compensating for
Investments related to the new cost savings plan
Growth initiatives, notably linked to Global Transaction Banking
development
Global Banking and Investor Solutions Results
In EUR m Q1 18 Q1 17 Change
Low Cost of risk Net banking income 2,215 2,559 -13.4% -8.9%*
Positive FX impact offset by
Reversal for third quarter in a row Operating expenses (2,024) (2,009) +0.7% +4.7%*
additional SRF contribution
Gross operating income 191 550 -65.3% -61.7%*
Net cost of risk 27 (37) n/s n/s
Operating income 218 513 -57.5% -52.7%*
Contribution to Group Net Income:
Reported Group net income 166 385 -56.9% -51.7%*
EUR 166m in Q1 18
RONE(1): 10.2% in Q1 18 RONE 4.5% 10.0%
Underlying RONE(1) 10.2% 14.8%
* When adjusted for changes in Group structure and at constant exchange rates
(1) Adjusted for IFRIC 21 implementation
PRESENTATION TO DEBT INVESTORS MAY 2018 293 – B U S I NE S S R E S U L TS - G L O B A L B A N K I N G A ND I N V E S TO R S O L U TI O N S
Q1 18: LARGE DIFFERENCES ACROSS REGIONS AND PRODUCTS
Global Markets & Investor Services revenues: -13% vs. Q1 17 excl. FX effect
Europe: low commercial activity on FICC and Equities
Equities: softer flow vs. other regions, lower commercial activity and trading revenues impacted by hedging costs
FICC: lower client flow activity across the board vs. high level in Q1 17, dynamic structured product franchise
Securities Services: highest level of Q1 fees since 2008
Americas: robust revenues driven by flow Equities Asia: solid revenues driven by flow Equities
Equities: strong flows, in line with the market. Structured products’
Equities: overall sustained activity offset by hedging costs
sound commercial activity offset by hedging costs
FICC: lower client revenues, notably on Financing and Credit
FICC: lower client revenues, notably on Financing and Credit
Equities: robust flow more than offset by low structured products FICC: lower commercial activity vs. 5-year high in Q1 17
(in EURm) (in EURm)
Revenues -5% vs. Q1 17 excl. FX effect Revenues -27% vs. Q1 17 excl. FX effect
738 725 651 659 777
586 496 514 535
498
Q1 17 Q2 17 Q3 17 Q4 17 Q1 18 Q1 17 Q2 17 Q3 17 Q4 17 Q1 18
Equities includes Prime Services
PRESENTATION TO DEBT INVESTORS MAY 2018 303 – B U S I NE S S R E S U L TS - G L O B A L B A N K I N G A ND I N V E S TO R S O L U TI O N S
STABILITY IN FINANCING & ADVISORY AND ASSET AND WEALTH MANAGEMENT
Strong European Financing franchises
Financing & Advisory growth initiatives delivering results No.1
No.2 No.2 No.2 No.2
Revenues -1% vs. Q1 17 excl. FX impact
No.3
No.4
No.5 No.5
Asset-Backed products reaching historical high, up for the 9th quarter in a row No.6
#6
Strong fee generation on Export Finance and Real Estate
No.9 No.9 No.9
Global Transaction Banking: buoyant Cash management commercial activity
2015 2016 2017 Q1 18
Low demand for commodity derivatives and corporate hedging solutions All International Euro-denominated Bonds (1)
Global Securitisation in Euros (1)
Muted Investment Banking activity, despite buoyant Debt Capital Markets EMEA Loan Bookrunner (1)
Export Finance and Agency Global Lenders (2)
Soft Asset and Wealth Management activity Asset and Wealth Management
Revenues -2% vs. Q1 17 excl. FX impact AuM (in EURbn) Net inflows (in EURbn)
226 234 9.0
Lyxor:
Higher ETF management fees vs. previous year 107 117
7.4
Commercially dynamic structured segment
119 117
1.6
Private banking: Q1 17 Q1 18 Q1 18
Positive transactional revenue trend and robust net inflows in France Lyxor Private Banking Lyxor Private Banking
Fee generation slowdown in other countries
(1) Source: Dealogic
(2) Source: TXF
PRESENTATION TO DEBT INVESTORS MAY 2018 313 – B U S I NE S S R E S U L TS – C O RP O RA TE C E N TR E
CORPORATE CENTRE
Corporate Centre Results
IFRS 9
Impact of revaluation of own financial liabilities in shareholders equity
In EUR m Q1 18 Q1 17
from 2018
Net banking income 82 (48)
Net b anking income (1) 82 (73)
Gross operating income(1) Operating expenses (46) (38)
Gross operating income 36 (86)
EUR 36m in Q1 18 vs. EUR -111m in Q1 17
Gross operating income (1) 36 (111)
Net cost of risk (10) (350)
Final agreement with the relevant authorities to be reached Net profits or losses from other assets (4) (3)
within the coming days or weeks Reported Group net income (15) (397)
Group net income (1) (15) (414)
Monetary penalties expected to be in line with provision
allocated to the IBOR and Lybian matters
Provision for disputes stable at EUR 2.3bn
(1) Excluding non-economic items in Q1 17
PRESENTATION TO DEBT INVESTORS MAY 2018 324 CONCLUSION
4 – CO N C L U S I O N

                                   COMMITTED TO DELIVER OUR STRATEGIC PLAN

                           2018                                     GROW
                                                 Stabilisation of revenues in French Retail Banking
                                   Strong net income growth in International Retail Banking and Financial Services
                                    Higher return than European peers in Global Banking and Investor Solutions

2018          FOSTER RESPONSIBILITY                                                      2018                   TRANSFORM
        On target for EUR 100bn of energy                                                      50% of front-to-back internal processes in
    transition financing by 2020, of which ~50%                   ENHANCE                     the French Retail Network automated and
                       in 2018                                  SHAREHOLDER                              digitalised by 2018
                                                                   VALUE
       Meet Culture and Conduct best-in-class                                                        65% of our IT infrastructure on
                     standards                                                                          Public/Private Cloud

         2018                COMPLETE REFOCUSING                                  2018          DELIVER ON COSTS
                         Processes underway to deliver our target
                                                                                          Maintain strict control on costs
                   Material announcements expected by year-end

                                                                                                   PRESENTATION TO DEBT INVESTORS   MAY 2018   34
5 SUPPLEMENT
5 – S U P P L E ME N T - S O C I E TE G E NE RA L E G RO U P

                                                                                    KEY FIGURES

          In EUR m                                                                            Q1 18             Change Q1 vs. Q4       Change Q1 vs. Q1

          Net banking income                                                                            6,294              -0.5%                         -2.8%
          Operating expenses                                                                          (4,729)              -5.9%                         +1.8%
          Net cost of risk                                                                              (208)             -55.7%                        -66.8%
          Reported Group net income                                                                       850           +1131.9%                        +13.8%
          ROE (after tax)                                                                               6.3%
          ROTE (after tax)                                                                              7.4%

          Earnings per Share                                                                            0.93
          Net Tangible Asset value per Share (EUR)                                                     53.75
          Net Asset value per Share (EUR)                                                              62.68

          Common Equity Tier 1 Ratio *                                                                 11.2%
          Tier 1 Ratio *                                                                               13.6%
          Total Capital Ratio *                                                                        16.8%

    * Fully-loaded based on CRR/CRD4 rules, including Danish compromise for insurance. Refer to Methodology
    Underlying ROE/ROTE: adjusted for non-economic and exceptional items, see p. 40 and Methodology

                                                                                                                            PRESENTATION TO DEBT INVESTORS   MAY 2018   36
5 – S U P P L E ME N T - S O C I E TE G E NE RA L E G RO U P
ENGAGED IN POSITIVE TRANSFORMATION
OFFERS IN LINE WITH CLIENT SATISFACTION &
CLIMATE CHANGE
SOCIAL TRENDS PROTECTION
CULTURE, CONDUCT AND
RESPONSIBLE EMPLOYER AFRICA
GOVERNANCE
Committed to contribute EUR100bn to the financing of the energy transition between 2016 and 2020 (EUR39bn at end-
2017)
On track to meet the target to limit the coal portion of the financed energy mix to 19% by 2020 (20.4% at end-2017)
May 2018 statement on the UK Modern Slavery Act strengthening Societe Generale’s worldwide practices to protect human
rights
Publication of a Duty of Care plan in February 2018, in accordance with the 2017 French Act on the Duty of Care, whose
objective is to map, measure and mitigate human rights and environmental risks, on a worldwide basis
Launch of YUP mobile money offer to address the poorly and unbanked population of Africa, representing 80% of the
population: introduced in Cote d’Ivoire, Senegal and Burkina with more than 110 000 wallets sold at 1Q18. Objective to
reach 1 million by 2020 and to roll out to 4 additional countries.
PRESENTATION TO DEBT INVESTORS MAY 2018 375 – S U P P L E ME N T - S O C I E TE G E NE RA L E G RO U P
QUARTERLY INCOME STATEMENT BY CORE BUSINESS
International Retail Banking and Global Banking and Investor
French Retail Banking Corporate Centre Group
Financial Services Solutions
In EUR m Q1 18 Q1 17 Q1 18 Q1 17 Q1 18 Q1 17 Q1 18 Q1 17 Q1 18 Q1 17
Net banking income 2,008 2,023 1,989 1,940 2,215 2,559 82 (48) 6,294 6,474
Operating expenses (1,480) (1,420) (1,179) (1,177) (2,024) (2,009) (46) (38) (4,729) (4,644)
Gross operating income 528 603 810 763 191 550 36 (86) 1,565 1,830
Net cost of risk (134) (129) (91) (111) 27 (37) (10) (350) (208) (627)
Operating income 394 474 719 652 218 513 26 (436) 1,357 1,203
Net income from companies accounted for by
6 16 6 12 0 1 4 8 16 37
the equity method
Net profits or losses from other assets 1 0 4 35 0 5 (4) (3) 1 37
Impairment losses on goodwill 0 0 0 1 0 0 0 0 0 1
Income tax (131) (159) (188) (181) (47) (127) (4) 78 (370) (389)
O.w. non controlling Interests 0 0 112 91 5 7 37 44 154 142
Group net income 270 331 429 428 166 385 (15) (397) 850 747
Average allocated capital 11,387 10,759 11,400 11,158 14,742 15,335 10,191* 10,622* 47,720 47,884
Group ROE (after tax) 6.3% 5.2%
Net banking income, operating expenses, allocated capital, ROE: see Methodology
* Calculated as the difference between total Group capital and capital allocated to the core businesses
PRESENTATION TO DEBT INVESTORS MAY 2018 385 – S U P P L E ME N T - S O C I E TE G E NE RA L E G RO U P
IFRIC 21 AND SRF IMPACT
International Retail
Global Banking and
French Retail Banking Banking and Financial Corporate Centre Group
Investor Solutions
Services
In EUR m Q1 18 Q1 17 Q1 18 Q1 17 Q1 18 Q1 17 Q1 18 Q1 17 Q1 18 Q1 17
Total IFRIC 21 Impact - costs -108 -97 -124 -135 -392 -332 -50 -51 -674 -615
o/w Resolution Funds -66 -50 -42 -40 -312 -252 -3 -2 -423 -343
International Retail Financial Services to
Insurance Other Total
Banking Corporates
In EUR m Q1 18 Q1 17 Q1 18 Q1 17 Q1 18 Q1 17 Q1 18 Q1 17 Q1 18 Q1 17
Total IFRIC 21 Impact - costs -85 -94 -9 -11 -30 -26 0 -4 -124 -135
o/w Resolution Funds -41 -37 -1 -1 0 0 0 -2 -42 -40
Africa, Asia,
Total International
Western Europe Czech Republic Romania Russia Other Europe Mediterranean bassin
Retail Banking
and Overseas
In EUR m Q1 18 Q1 17 Q1 18 Q1 17 Q1 18 Q1 17 Q1 18 Q1 17 Q1 18 Q1 17 Q1 18 Q1 17 Q1 18 Q1 17
Total IFRIC 21 Impact - costs -6 -6 -36 -32 -9 -17 -2 -3 -22 -21 -10 -14 -85 -94
o/w Resolution Funds -1 -1 -28 -25 -4 -4 0 0 -7 -7 0 0 -41 -37
Global Banking and Asset and Wealth Total Global Banking
Financing and Advisory
Investor Services Management and Investor Solutions
In EUR m Q1 18 Q1 17 Q1 18 Q1 17 Q1 18 Q1 17 Q1 18 Q1 17
Total IFRIC 21 Impact - costs -313 -260 -71 -63 -8 -9 -392 -332
o/w Resolution Funds -260 -209 -45 -36 -7 -7 -312 -252
PRESENTATION TO DEBT INVESTORS MAY 2018 395 – S U P P L E ME N T - S O C I E TE G E NE RA L E G RO U P
NON ECONOMIC AND EXCEPTIONAL ITEMS
In EUR m Q1 18 Q1 17 Change
Net Banking Income 6,294 6,474 -2.8%
Reevaluation of own financial liabilities* - 25
DVA* - (3)
Underlying Net Banking Income 6,294 6,452 -2.4%
Operating expenses (4,729) (4,644) +1.8%
IFRIC 21 linearisation 506 461
Underlying Operating expenses (4,223) (4,183) +1.0%
Net cost of risk (208) (627) -66.8%
LIA settlement** 350
Underlying Net cost of risk (208) (277) -24.9%
Group net income 850 747 +13.8%
Effect in Group net income of above restatements (354) (645)
Underlying Group net income 1,204 1,392 -13.5%
* Non economic items
** Exceptional items
PRESENTATION TO DEBT INVESTORS MAY 2018 405 – S U P P L E ME N T - S O C I E TE G E NE RA L E G RO U P
CRR/CRD4 PRUDENTIAL CAPITAL RATIOS
Fully Loaded Common Equity Tier 1, Tier 1 and Total Capital
In EUR bn 31/03/2018 31/12/2017
Shareholder equity Group share 58.9 59.4
Deeply subordinated notes* (8.4) (8.5)
Undated subordinated notes* (0.3) (0.3)
Dividend to be paid & interest on subordinated notes (2.3) (1.9)
Goodwill and intangible (6.7) (6.6)
Non controlling interests 4.5 3.5
Deductions and regulatory adjustments** (6.1) (5.4)
Common Equity Tier 1 Capital 39.8 40.2
Additional Tier 1 capital 8.5 8.7
Tier 1 Capital 48.3 48.9
Tier 2 capital 11.4 11.1
Total capital (Tier 1 + Tier 2) 59.7 60.0
Total risk-weighted assets 356 353
Common Equity Tier 1 Ratio 11.2% 11.4%
Tier 1 Ratio 13.6% 13.8%
Total Capital Ratio 16.8% 17.0%
Ratios based on the CRR/CDR4 rules as published on 26th June 2013, including Danish compromise for insurance. See Methodology
* Excluding issue premiums on deeply subordinated notes and on undated subordinated notes
** Fully loaded deductions
PRESENTATION TO DEBT INVESTORS MAY 2018 415 – S U P P L E ME N T - S O C I E TE G E NE RA L E G RO U P
CRR LEVERAGE RATIO
CRR Fully Loaded Leverage Ratio(1)
In EUR bn 31/03/2018 31/12/2017
Tier 1 Capital 48.3 48.9
Total prudential balance sheet (2) 1,150 1,138
Adjustement related to derivative exposures (60) (61)
Adjustement related to securities financing transactions* (10) (9)
Off-balance sheet (loan and guarantee commitments) 97 93
Technical and prudential ajustments (Tier 1 capital prudential
(11) (11)
deductions)
Leverage exposure 1,167 1,150
CRR leverage ratio 4.1% 4.3%
(1) Fully loaded based on CRR rules taking into account the leverage ratio delegated act adopted in October 2014 by the European Commission. See Methodology
(2) The prudential balance sheet corresponds to the IFRS balance sheet less entities accounted for through the equity method (mainly insurance subsidiaries)
* Securities financing transactions: repos, reverse repos, securities lending and borrowing and other similar transactions
PRESENTATION TO DEBT INVESTORS MAY 2018 425 – S U P P L E ME N T - S O C I E TE G E NE RA L E G RO U P
2017 LONG TERM FUNDING PROGRAMME REALISED AT COMPETITIVE CONDITIONS
2017 completed programme breakdown
Parent company 2017 funding programme EUR 24.1bn (including EUR 17bn of Senior structured
2%
structured notes) issues
19%
Completed at 125% incl. pre-funding at end 2017 (EUR 30bn, including 71% of Covered Bonds
structured notes)
8% EUR 30bn Senior Non-Preferred
Competitive funding conditions: MS6M+16bp (incl. senior non preferred debt, senior issues
preferred debt and covered bonds), average maturity of 4.5 years
71% Tier 2
Diversification of the investor base by currencies, maturities and types
Additional EUR 5bn issued by subsidiaries
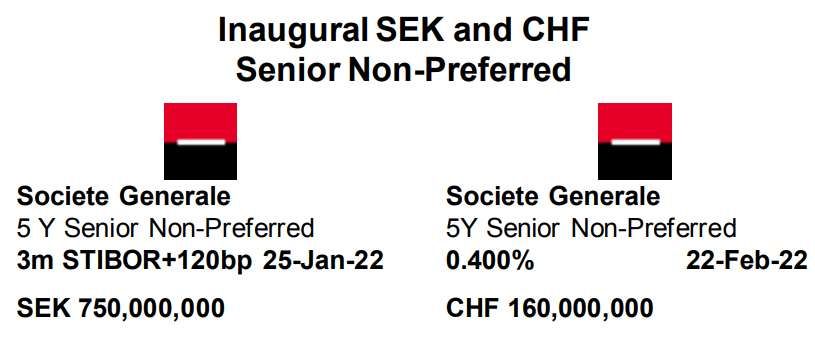
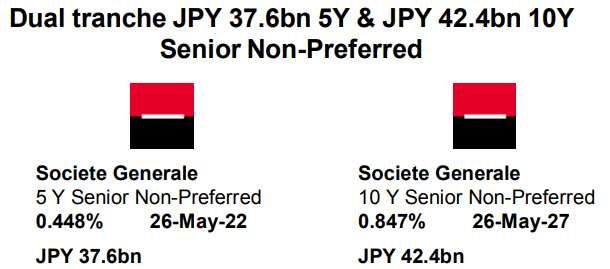
2017 SNP Landmark Issuances
PRESENTATION TO DEBT INVESTORS MAY 2018 435 – S U P P L E ME N T - S O C I E TE G E NE RA L E G RO U P
2018 SHORT TERM FUNDING WELL DIVERSIFIED
Group Unsecured Short Term External Funding Mapping (initial maturities < 18m)
Central banks
1%
16% Supra / Min Fin
30%
Financial Institutions
14%
Asset managers
12%
27%
Corporates
Others
(as of 31/03/2018)
PRESENTATION TO DEBT INVESTORS MAY 2018 445 – S U P P L E ME N T - RI S K MA N A G E ME N T
PILLAR 2 LATEST DEVELOPMENT
STRENGHTENING ALREADY LARGE CAPITAL BUFFERS
Phased-in CET1 11.3%
Fully-loaded CET1
11.2%
Pillar 2
MDA Countercyclical
Guidance 0.11%
buffer: ~9.50%(1) Buffer
~ -260bp Pillar 2 1.00%
0,05% 8.63% G-SIB Buffer
Guidance
0.75%
Threshold for
MDA restrictions* - 7.75% 2.50%
1.88% Capital Conservation Buffer
AT1 Trigger
buffer:
1.50% 1.50% Pillar 2
AT1 Trigger - 5.125% ~ 615bp
Requirement
(P2R)
4.50% 4.50%
Pillar 1
31.03.2018 CET1 REQUIREMENT 2018 2019 CET1 REQUIREMENT
ESTIMATE
* Excluding countercyclical Buffer
(1) based on the final notification in December 2017
PRESENTATION TO DEBT INVESTORS MAY 2018 455 – S U P P L E ME N T - RI S K MA N A G E ME N T
RISK-WEIGHTED ASSETS* (CRR/CRD 4, IN EUR BN)
353.8 353.3 355.7
133.5
128.8 129.7 44.4 49.0 48.9
Total
113.8 116.7 116.8 29.4
17.8 14.8 16.6
7.7 7.7 32.2 32.2
7.0 0.1 0.1
0.0
95.8 96.8
92.6 Operational
5.4 5.4 17.5
4.6 0.0 0.0 14.5 16.3
0.0 Market
Credit
291.6 289.5 290.1
106.7 108.9 109.0
87.9 90.3 91.4 86.6 82.1 81.3
13.9 12.0 12.3
3.4
0.2 3.6 3.6
0.2 0.2
10.3 8.2 8.5
Q1 17 Q4 17 Q1 18 Q1 17 Q4 17 Q1 18 Q1 17 Q4 17 Q1 18 Q1 17 Q4 17 Q1 18 Q1 17 Q4 17 Q1 18
French Retail Banking International Retail Banking Global Banking and Corporate Centre Group
and Financial Services Investor Solutions
* Includes the entities reported under IFRS 5 until disposal
Data restated relfecting new quarterly series published on 4 April 2018
PRESENTATION TO DEBT INVESTORS MAY 2018 465 – S U P P L E ME N T - RI S K MA N A G E ME N T
CHANGE IN GROSS BOOK OUTSTANDINGS*
End of period in EUR bn
486.4 483.1 482.1 Total
477.5 479.1 475.5 472.7 478.7
467.4
Global Banking
and Investor Solutions
156.9 152.2 155.8 137.9 135.5 136.0 138.7
143.9 154.0
International Retail
Banking and Financial
Services
127.7 133.5 135.4 138.7 140.0 French Retail Banking
123.8 130.0 129.3 132.2
Corporate Centre
187.3 189.2 187.5 190.4 187.6 195.2 194.1 196.9 196.8
12.4 12.6 6.0 7.2 7.5 8.9 7.7 7.1 6.6
Q1 16 Q2 16 Q3 16 Q4 16 Q1 17 Q2 17 Q3 17 Q4 17 Q1 18
* Customer loans; deposits and loans due from banks, leasing and lease assets. Excluding repurchase agreements
Excluding entities reported under IFRS 5
PRESENTATION TO DEBT INVESTORS MAY 2018 475 – S U P P L E ME N T - RI S K MA N A G E ME N T
NON PERFORMING LOANS
In EUR bn 31/03/2018 31/12/2017 31/03/2017
Gross book outstandings* 482.1 478.7 483.1
Doubtful loans* 20.4 20.9 23.3
Group Gross non performing loans ratio* 4.2% 4.4% 4.8%
Specific provisions* 11.3 11.3 13.5
Portfolio-based provisions* 2.1 1.3 1.5
Group Gross doubtful loans coverage ratio* (Overall
66% 61% 65%
provisions / Doubtful loans)
Stage 1 provisions* 1.0
Stage 2 provisions* 1.2
Stage 3 provisions* 11.3
Group Gross doubtful loans coverage ratio* (Stage 3
55%
provisions / Doubtful loans)
• Customer loans, deposits at banks and loans due from banks, leasing and lease assets
• As of March 31, 2018 portfolio-based provisions are the sum of stage 1 and stage 2 provisions,
See: Methodology
PRESENTATION TO DEBT INVESTORS MAY 2018 485 – S U P P L E ME N T - RI S K MA N A G E ME N T
CHANGE IN TRADING VAR* AND STRESSED VAR**
Quarterly Average of 1-Day, 99% Trading VaR* (in EUR m)
30 32
20 21 21 22 19 19 15 Trading VaR*
6
8
12 11 8
7 Credit
6
18 5
16 8
16 16 Interest Rates
15 17 13 12
11
Equity
19 19
14 12 14 15
16 15 12 Forex
2 3 4 5 5 3 3 3 Commodities
2 2 2 1 1 1 3 1 2 2
Compensation Effect
-19 -16 -18
-22 -23 -21 -21
-26 -25
Q1 16 Q2 16 Q3 16 Q4 16 Q1 17 Q2 17 Q3 17 Q4 17 Q1 18
Stressed VAR** (1 day, 99%, in EUR m) Q1 17 Q2 17 Q3 17 Q4 17 Q1 18
Minimum 27 21 14 14 14
Maximum 68 52 37 37 72
Average 47 36 25 21 34
* Trading VaR: measurement over one year (i.e. 260 scenario) of the greatest risk obtained after elimination of 1% of the most unfavourable occurrences
** Stressed VaR : Identical approach to VaR (historical simulation with 1-day shocks and a 99% confidence interval), but over a fixed one-year historical window corresponding to a period of significant financial
tension instead of a one-year rolling period
PRESENTATION TO DEBT INVESTORS MAY 2018 495 – S U P P L E ME N T - RI S K MA N A G E ME N T
DIVERSIFIED EXPOSURE TO RUSSIA
EAD(1) as of Q1 18: EUR 14.7 bn
Other
Corporates Sovereign
ONSHORE
Financial
Institutions 20%
4%
2%
Car loans
22%
Corporates 23%
Tier 1(2) Mortgages
Retail 49%
25% Consumer
38% loans
4%
12% Other
OFFSHORE
(1) EAD net of provisions
(2) Top 500 Russian corporates and multinational corporates
PRESENTATION TO DEBT INVESTORS MAY 2018 505 – S U P P L E ME N T - F RE NC H R E T A I L B A NK I N G
CHANGE IN NET BANKING INCOME
2,023 2,026 1,914 2,051 2,008 NBI in EUR m
Commissions:
-0.9% vs. Q1 17 210 203 206 205
Financial Fees
197
Service Fees
625 617 609 622
606
Interest margin(1):
128 107 170 147 Other Income
106
-4.3 % vs. Q1 17
Net Interest Margin(2)
1,063 1,096 990 1,052 1,017
PEL/CEL
Provision or Reversal
3 15 15 16
-2
Q1 17 Q2 17 Q3 17 Q4 17 Q1 18
(1) Excluding PEL/CEL
(2) Including EUR -88m adjustment of hedging costs in Q3 17
Data restated relfecting new quarterly series published on 4 April 2018
PRESENTATION TO DEBT INVESTORS MAY 2018 515 – S U P P L E ME N T - F RE NC H R E T A I L B A NK I N G
CUSTOMER DEPOSITS AND FINANCIAL SAVINGS
Average outstanding Change
in EUR bn 303.2 305.0 304.7 305.3 Q1 18 vs. Q1 17
300.8
Life Insurance
Financial
savings:
EUR 92.0 92.8 93.0 +1.5%
91.4 91.9
-0.4% Mutual Funds
Others
16.4 17.0 17.3 16.5 +1.8% (SG redeem. Sn)
18.6 0.3 0.3 0.3 0.3
0.4 -11.1%
91.9 96.7 99.7 100.5 100.9 Sight Deposits(1)
Deposits: +9.8%
EUR
18.9 18.8 18.7 18.7 18.8 PEL
+2.6% -0.4%
49.3 51.0 51.9 51.4 52.6 Regulated Savings
+6.6%
Schemes (excl. PEL)
30.3 28.1 25.4 23.7 23.1 -23.8%
Term Deposits(2)
Q1 17 Q2 17 Q3 17 Q4 17 Q1 18
(1) Including deposits from Financial Institutions and foreign currency deposits
(2) Including deposits from Financial Institutions and medium-term notes
PRESENTATION TO DEBT INVESTORS MAY 2018 525 – S U P P L E ME N T - F RE NC H R E T A I L B A NK I N G
LOANS OUTSTANDING
Average outstanding, net of provisions Change
in EUR bn Q1 18 vs. Q1 17
178.5 179.2 180.4 181.4 183.0
+2.5%
Individual Customers
o.w.:
+2.8%
+2.4% Housing
93.9 94.3 95.2 95.8 96.5
Consumer Credit
11.0 11.1 11.1 11.2 11.3 and Overdraft
+2.4%
Business
73.3 73.7 73.9 74.1 75.0 Customers*
0.3 0.2 0.2 0.2 0.2 Financial Institutions
-42.4%
Q1 17 Q2 17 Q3 17 Q4 17 Q1 18
* SMEs, self-employed professionals, local authorities, corporates, NPOs, including foreign currency loans
PRESENTATION TO DEBT INVESTORS MAY 2018 535 – S U P P L E ME N T - I N T E R NA TI O N A L R E T A I L B A N K I NG A N D F I N A N C I A L S E RV I C E S
INTERNATIONAL RETAIL BANKING AND FINANCIAL SERVICES – QUARTERLY RESULTS
International Retail Banking Insurance Financial Services to Corporates Total
In EUR m Q1 18 Q1 17 Change Q1 18 Q1 17 Change Q1 18 Q1 17 Change Q1 18 Q1 17 Change
Net banking income 1,328 1,282 +8.3%* 226 198 +6.1%* 435 460 -8.9%* 1,989 1,940 +3.9%*
Operating expenses (847) (857) +3.9%* (99) (90) +5.2%* (233) (230) -0.2%* (1,179) (1,177) +3.2%*
Gross operating income 481 425 +17.1%* 127 108 +6.8%* 202 230 -17.6%* 810 763 +5.1%*
Net cost of risk (81) (98) +14.4%* 0 0 n/s (10) (13) -15.6%* (91) (111) +9.8%*
Operating income 400 327 +17.7%* 127 108 +6.8%* 192 217 -17.7%* 719 652 +4.5%*
Net profits or losses from other assets 4 35 -89.3%* 0 0 n/s 0 0 +100.0%* 4 35 -89.3%*
Impairment losses on goodwill 0 1 +100.0%* 0 0 n/s 0 0 n/s 0 1 +100.0%*
Income tax (94) (86) +6.9%* (42) (37) +3.1%* (52) (58) -16.6%* (188) (181) -1.2%*
Group net income 229 193 +13.4%* 84 71 +7.4%* 116 164 -18.5%* 429 428 +0.7%*
C/I ratio 64% 67% 44% 45% 54% 50% 59% 61%
Average allocated capital 6,876 6,715 1,917 1,759 2,607 2,684 11,400 11,158
* When adjusted for changes in Group structure and at constant exchange rates
Net banking income, operating expenses, cost to income ratio, allocated capital: see Methodology
PRESENTATION TO DEBT INVESTORS MAY 2018 545 – S U P P L E ME N T - I N T E R NA TI O N A L R E T A I L B A N K I NG A N D F I N A N C I A L S E RV I C E S
QUARTERLY RESULTS OF INTERNATIONAL RETAIL BANKING: BREAKDOWN BY REGION
Africa, Asia,
Total International Retail
Western Europe Czech Republic Romania Other Europe Russia (1) Mediterranean bassin
Banking
and Overseas
In M EUR Q1 18 Q1 17 Q1 18 Q1 17 Q1 18 Q1 17 Q1 18 Q1 17 Q1 18 Q1 17 Q1 18 Q1 17 Q1 18 Q1 17
Net banking income 196 181 269 255 139 127 162 177 170 174 392 368 1,328 1,282
Change * +8.3%* -1.0%* +12.7%* +9.4%* +9.4%* +13.2%* +8.3%*
(100) (95) (166) (161) (90) (92) (108) (123) (140) (147) (243) (239) (847) (857)
Operating expenses
Change * +5.3%* -3.2%* +0.7%* +6.9%* +6.3%* +7.2%* +3.9%*
96 86 103 94 49 35 54 54 30 27 149 129 481 425
Gross operating income
Change * +11.6%* +2.9%* +44.2%* +14.8%* +26.1%* +24.5%* +17.1%*
(35) (27) 3 7 33 28 (12) (43) (16) (21) (54) (42) (81) (98)
Net cost of risk
Change * +29.6%* +59.6%* -21.4%* -36.2%* -15.0%* +32.3%* +14.4%*
61 59 106 101 82 63 42 11 14 6 95 87 400 327
Operating income
Change * +3.4%* -1.4%* +34.0%* +48.7%* x 2,8 +20.5%* +17.7%*
0 0 4 36 0 0 0 (1) 0 0 0 0 4 35
Net profits or losses from other assets
0 0 0 1 0 0 0 0 0 0 0 0 0 1
Impairment losses on goodwill
(13) (13) (23) (29) (17) (14) (9) (1) (2) (1) (30) (28) (94) (86)
Income tax
46 46 53 67 39 30 30 5 12 5 49 40 229 193
Group net income
Change * +0.0%* -25.7%* +33.8%* +58.5%* x 2,9 +51.1%* +13.4%*
51% 52% 62% 63% 65% 72% 67% 69% 82% 84% 62% 65% 64% 67%
C/I ratio
1,404 1,216 952 939 464 405 1,054 1,217 1,176 1,223 1,825 1,715 6,876 6,715
Average allocated capital
* When adjusted for changes in Group structure and at constant exchange rates
Net banking income, operating expenses, cost to income ratio, allocated capital: see Methodology
(1) Russia structure includes Rosbank, Delta Credit, Rusfinance and their consolidated subsidiaries in International Retail Banking
PRESENTATION TO DEBT INVESTORS MAY 2018 555 – S U P P L E ME N T - I N T E R NA TI O N A L R E T A I L B A N K I NG A N D F I N A N C I A L S E RV I C E S
LOAN AND DEPOSIT OUTSTANDINGS BREAKDOWN
Loan Outstandings Breakdown (in EUR bn) Deposit Outstandings Breakdown (in EUR bn)
Change Change
March 18 vs. March 17 March 18 vs. March 17
1.0
1.0 -1.5%*
o.w. Equipment +7.7%* 80.6
+7.1%* 77.9
17.2 Finance(1) 2.0
16.5 +2.3%*
1.9
+8.2%* o.w. sub-total International
85.5 88.9
Retail Banking
+4.8%*
28.2 31.4
16.5 +12.4%* 18.5
Western Europe
+4.8%* (Consumer Finance)
21.9 24.4 9.1 +6.8%* 9.5
Czech Republic
6.3 +5.6%* 6.5 Romania 11.8 +6.7%* 9.9
11.9 +8.3%* 10.7
Other Europe 7.8 +24.3%* 8.3
9.7 +7.4%* 8.9
Russia
19.1 +10.1%* 19.9 19.2 +7.9%* 19.6
Africa and other
Jun 17
Mar. Mars
Mar. 18
18 Mar. en
Juin 17 Mar.
Juin 18
en
* When adjusted for changes in Group structure and at constant exchange rates
(1) Excluding factoring
PRESENTATION TO DEBT INVESTORS MAY 2018 565 – S U P P L E ME N T - I N T E R NA TI O N A L R E T A I L B A N K I NG A N D F I N A N C I A L S E RV I C E S
INSURANCE KEY FIGURES
Life Insurance Outstandings
Personal Protection Insurance Premiums (in EUR m)
and Unit Linked Breakdown (in EUR bn)
Change
98.8 112.1 112.9 114.1 114.0 Q1 18 vs. Q1 17
25% 25% 26% 26% 27% Unit Linked 246 244 257 +5.8%*
233 241
Euro Funds
Personal
75% 75% 74% 74% 73% Protection
Insurance
Q1 17 Q2 17 Q3 17 Q4 17 Q1 18 Q1 17 Q2 17 Q3 17 Q4 17 Q1 18
Life Insurance Gross Inflows (in EUR bn) Property and Casualty Insurance Premiums (in EUR m)
Change
2.4 2.9 2.6 2.4 2.9 Q1 18 vs. Q1 17
Unit Linked
35% 36% 32% 34% 33% +8.8%*
Euro Funds 139 144 147
135 134
Property
and
65% 64% 68% 66% 67% Casualty
Insurance
Q1 17 Q2 17 Q3 17 Q4 17 Q1 18 Q1 17 Q2 17 Q3 17 Q4 17 Q1 18
* When adjusted for changes in Group structure and at constant exchange rates
PRESENTATION TO DEBT INVESTORS MAY 2018 575 – S U P P L E ME N T - I N T E R NA TI O N A L R E T A I L B A N K I NG A N D F I N A N C I A L S E RV I C E S
SG RUSSIA(1)
SG Russia Results
In EUR m Q1 18 Q1 17 Change
Net banking income 190 196 +8.6%*
Operating expenses (149) (156) +6.9%*
Gross operating income 41 40 +15.7%*
Net cost of risk (16) (21) -15.4%*
Operating income 25 19 +50.3%*
Group net income 18 14 +47.6%*
C/I ratio 78% 80%
SG Commitments to Russia
In EUR bn Q1 18 Q4 17 Q4 16 Q4 15
Book value 2.8 2.8 2.7 2.4
Intragroup Funding
- Sub. Loan 0.5 0.5 0.6 0.7
- Senior 0.0 0.0 0.0 0.0
NB. The Rosbank Group book value amounts to EUR 2.8 bn at Q1 18, not including translation reserves of EUR -0.9bn, already deducted from Group Equity.
* When adjusted for changes in Group structure and at constant exchange rates
(1) Contribution of Rosbank, Delta Credit Bank, Rusfinance Bank, Societe Generale Insurance, ALD Automotive, and their consolidated subsidiaries to Group businesses results
Net banking income, operating expenses, cost to income ratio: see Methodology
PRESENTATION TO DEBT INVESTORS MAY 2018 58You can also read