ARCOS DORADOS
March, 2020
←
→
Page content transcription
If your browser does not render page correctly, please read the page content below
ARCOS DORADOS March, 2020
Arcos Dorados
     Outperforming in a challenging environment

      Who we are
      Operating Context
      Our Restaurants
      Our Menu
      Our People

      Financial Performance

>1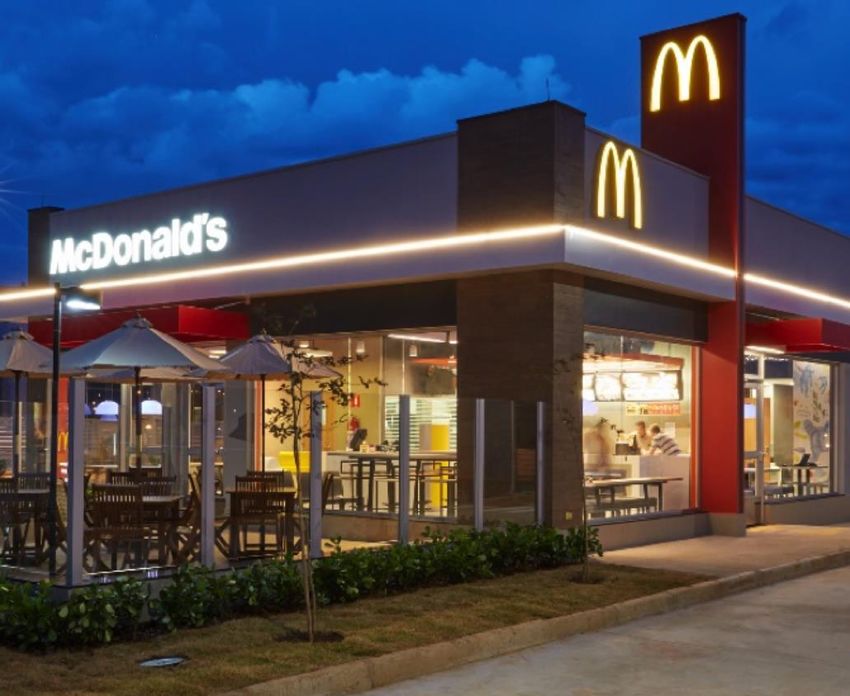
Latin America’s Largest Restaurant Chain
  Operates largest quick service restaurant chain in Latin America
  and the Caribbean (LAC).

  Exclusive right to own, operate and grant franchises of
  McDonald’s restaurants in LAC.

                                    4.3%                       6.3%
  World’s Largest
                                                                                          Over
  Independent McDonald's
  Franchisee based on               of McDonald’s 2018         of McDonald’s 2018 total
                                                                                          90,000
  Systemwide Sales and                                         franchised restaurants     Company and
                                    global sales                                          Franchisee
  Number of Restaurants                                                                   Employees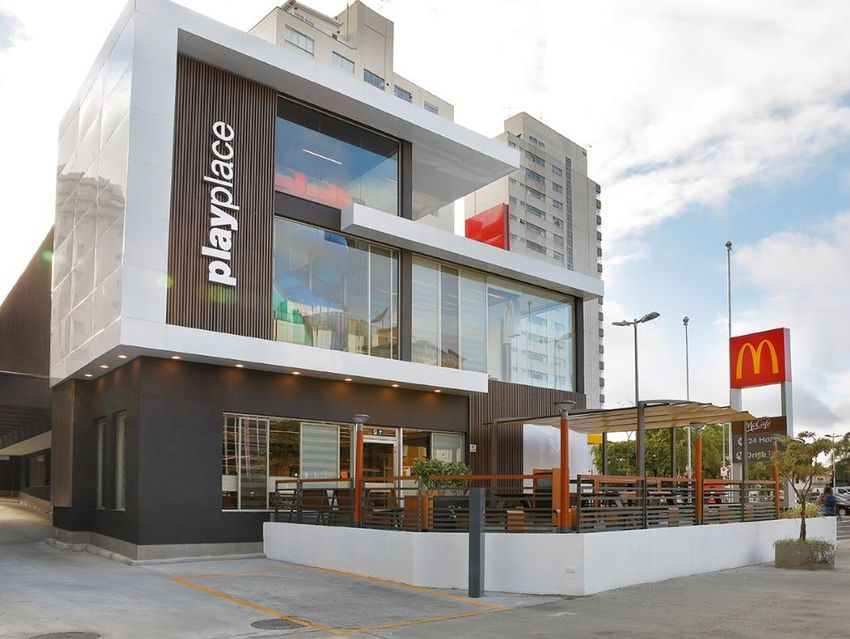
Irreplicable Footprint in the Region

                                                                                                                      69%
                  MEXICO                                                                                              Company-Operated

                                                                                                                      31%
                                                                                                                      Sub-Franchised
                                                             COLOMBIA

                                                                              BRAZIL

           BRAZIL
                                                                                                2007: 1,593 restaurants
           NOLAD
                                                                                              Today1: 2,239 restaurants
           Costa Rica, Mexico, Panamá
                                                               ARGENTINA
                                                                                                  NUMBER OF RESTAURANTS¹
           SLAD
           Argentina, Chile, Ecuador, Perú, Uruguay
                                                                                                  BRAZIL   |    984     | 43%
           CARIBBEAN                                                                             NOLAD     |    525     | 24%
           Aruba, Colombia, Curaçao, French Guyana,
           Guadeloupe, Martinique, Puerto Rico, St. Croix,
                                                                                                   SLAD     |   395     | 18%
           St. Thomas, Trinidad & Tobago, Venezuela                                           CARIBBEAN    |    335     | 15%
(1) As of September 30, 2019; does not include McCafé units (258) & Dessert Centers (3,268)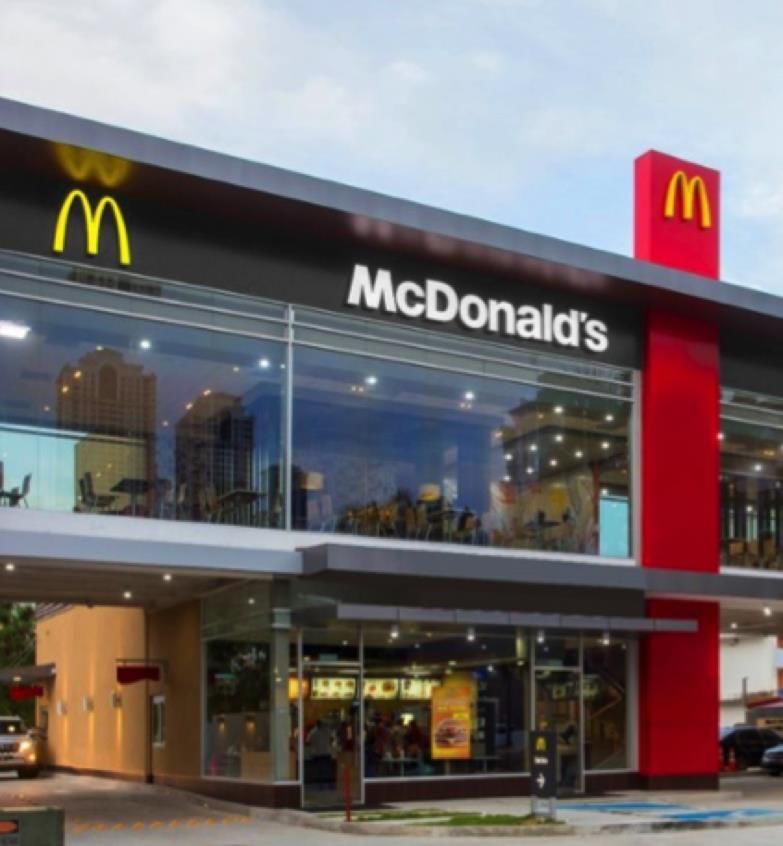
OWNERSHIP1 Numerous Revenue
Company Joint Franchised Developmental TOTAL Opportunities from
Operated Venture License
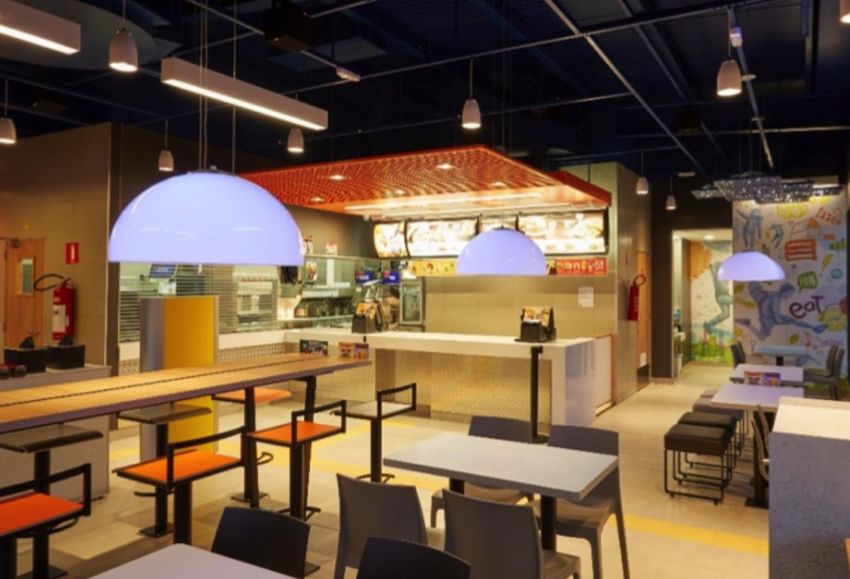
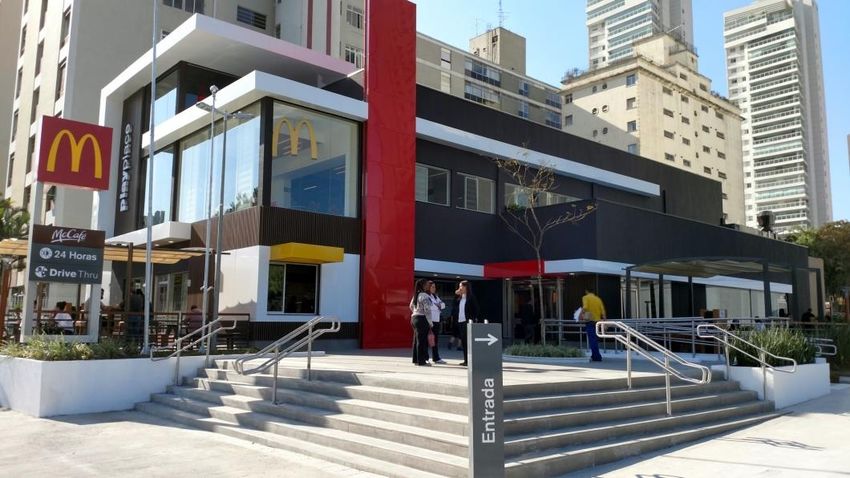
Leadership in
BRAZIL 587 397 984
NOLAD 354 161 10 525
Freestanding Units
SLAD 331 15 49
• Full McDonald’s experience.
395
CARIBBEAN 250 84 1 335
• Open 24 hours.
• Iconic & strategic locations difficult to
TOTAL 1,526 15 677 11 2,239 replicate.
• Higher revenues per restaurant,
multiple revenue generating
STORE TYPE1 opportunities and significantly more
branding than the simple point of sale.
Freestanding Food In-Store Mall Store Dessert McCafé
Court Centers
26%
BRAZIL 439 343 89 113 1,934 79 Food Court
NOLAD 272 144 51 57 632 13
47%
SLAD 121 75 112 86 379 129 Freestanding
CARIBBEAN 223 21 37 54 323 37
13%
88 1 In-Store
TOTAL 1,055 583 289 310 3,268 258
14%
(1) As of September 30, 2019 Mall Store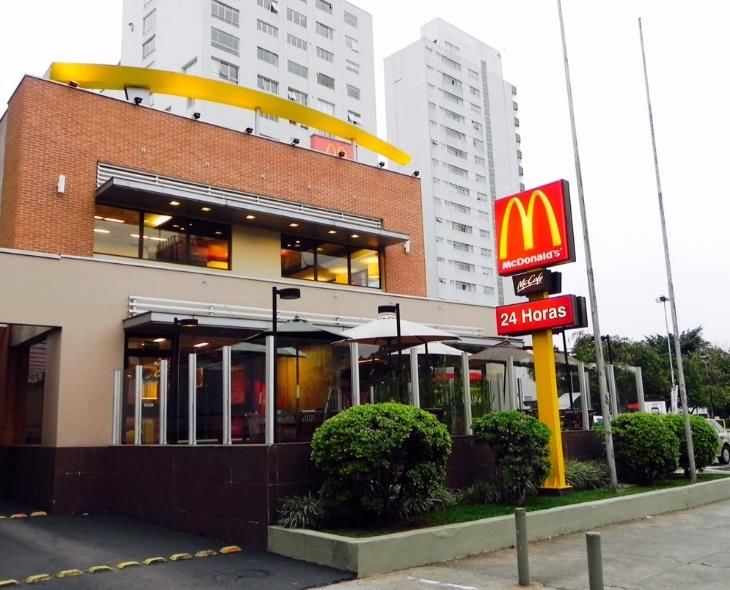
Our Business Model
       Arcos Dorados has the exclusive right to own, operate and sub-franchise McDonald’s
       restaurants in Latin America

                                            COMPANY OPERATED RESTAURANTS

+   Revenues from Restaurant Sales                        OWNED REAL ESTATE                                LEASED REAL ESTATE
                                                           Investment            ArcOpCo
-   Royalty Fee                               Land                               Cash Margin
                                                                                                            Investment             ArcOpCo
                                                                                                                                   Cash Margin

-   Costs related to running the business     Equipment                                        Equipment
                                              Building                                         Building
    Operating Results                                                    Sales                                             Sales

                                             SUB FRANCHISED RESTAURANTS

                                                          OWNED REAL ESTATE                                LEASED REAL ESTATE

+   Revenues from Rental Income                            Investment            Franchisee
                                                                                                            Investment             Franchisee
                                              Land                               Cash Margin
                                                                                                                                   Cash Margin
-   Rental Fee (related to real estate)
    Profitability of Sub-franchised           Building                                         Building
                                                                        Rental                                            Rental
    Restaurants                                                         Income                                            Income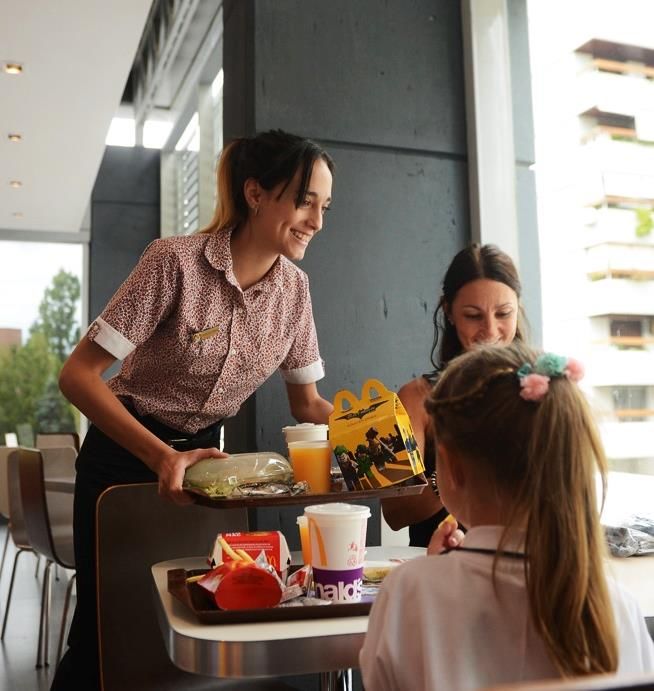
Arcos Dorados
     Outperforming in a challenging environment

     Who we are
     Operating Context
     Our Restaurants
     Our Menu
     Our People

     Financial Performance

>6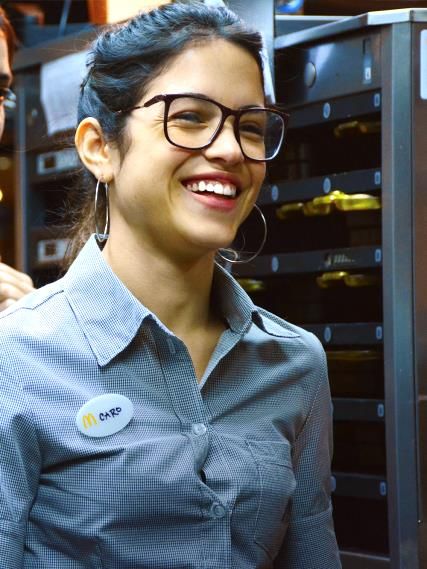
Middle Class in Central & South America
  Dynamic Region - Population demographics

                                                                           313
        181                                              +130              MILLION
                                                                           PEOPLE

           MILLION                                       MILLION
           PEOPLE
                                                         PEOPLE

                                    2009                           2030E

Source: (1) OECD, 2010 from KKR Report: “The Emergence
of Brazil: An Unfinished Story…” May 2012
Arcos Dorados
     Outperforming in a challenging environment

     Who we are
     Operating Context
     Our Restaurants
     Our Menu
     Our People

     Financial Performance

>8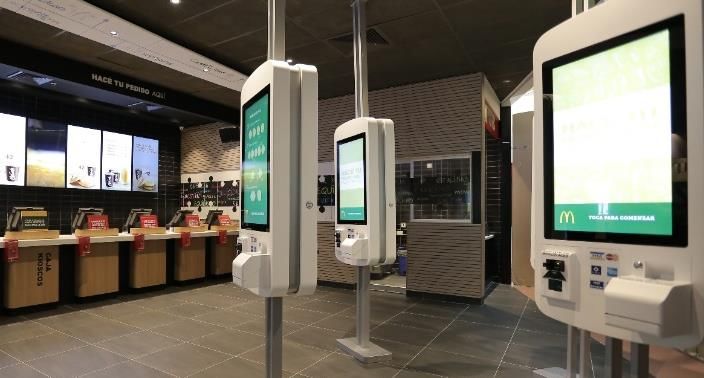
D I F F E R E N T I AT I O N
O U R R E S TAU R AN T S

                               >
D I F F E R E N T I AT I O N
O U R R E S TAU R AN T S
SELF ORDER KIOSKS
MODERN MENU BOARDS
UPGRADED PLAYLAND
MULTI-POINT SERVICE TABLETS & WiFiD I F F E R E N T I AT I O N
O U R R E S TAU R AN T S
120 restaurants
with
1 restaurant
DEC DEC
2016 2017D I F F E R E N T I AT I O N
O U R R E S TAU R AN T S
329 restaurants
with
120 restaurants
with
1 restaurant
DEC DEC DEC
2016 2017 2018D I F F E R E N T I AT I O N
O U R R E S TAU R AN T S
~650
restaurants
with
329 restaurants
with
120 restaurants
with
1 restaurant
DEC DEC DEC DEC 2019E
2016 2017 2018Arcos Dorados
Outperforming in a challenging environment
Who we are
Operating Context
Our Restaurants
Our Menu
Our People
Financial Performance
> 14D I F F E R E N T I AT I O N OUR MENU
Arcos Dorados
       Outperforming in a challenging environment

       Who we are
       Operating Context
       Our Restaurants
       Our Menu
       Our People

       Financial Performance

> 16
D I F F E R E N T I AT I O N
OUR PEOPLE
PILLARS
CULTURAL TRANSFORMATION
CENTERED ON PEOPLE
TAKING SERVICE BEYOND THE FRONT-
COUNTER
KNOWING «HOW TO BE» AND
NOT JUST «HOW TO DO»D I F F E R E N T I AT I O N
OUR PEOPLE
AT ARCOS DORADOS WE DIRECTLY EMPLOY MORE THAN
73,000 YOUNG PEOPLE
BETWEEN 16 AND 25 YEARS OLDArcos Dorados Outperforming in a challenging environment Who we are Operating Context Our Restaurants Our Menu Our People Financial Performance
Top-line Growth vs. Inflation
(Excluding Venezuela)

                                                           11.3%
                                                              INFLATION

                                                           7.6%
                                                                               0.7x
                                                                  COMPARABLE COMPARABLE
                                                                  SALES         SALES /
                                                                              INFLATION

  2011     2012         2013   2014   2015   2016   2017   2018
Rebuilding Store Margins
ArcOpCo
Margin 2017 11.1%
14.5%
ArcOpCo Margin % F&P + 0.1%
(Excluding Venezuela)
Payroll - 1.0%
Occupancy
& Other + 0.8%
12.3%
11.8% Royalty Fee + 0.3%
11.1% 10.9%
10.6% 10.5%
10.4% ArcOpCo
Margin 2018 10.9%
2011
2012
2013
2014
2015
2016
2017
2018Optimize Our Cost Structure
Total G&A ($ million)
ADJUSTED EBITDA MARGIN
Total G&A as % of Revenues (Excluding Venezuela)
340 11%
(Excluding Venezuela)
320 10%
10% 9.7%
300 9.4%
9%
280 8.7%
8.5% 9.1%
8.1% 8% 9%
260 316 8.8%
7.4% 7.4% 7.4% 7.4%
240 8.4%
7% 8.3%
291 8.2%
220 293
258 8.0% 8.0%
263 6% 8%
200
214 237 223 5%
180
160 4% 7%
2011
2012
2013
2014
2015
2016
2017
2018
2011
2012
2013
2014
2015
2016
2017
20183Q19 Leverage and Cash Flow Highlights*
• Strong and healthy balance sheet, despite acceleration of capex program
• Net leverage ratio of 1.6x
$ million
900 2.6x 2.3x 1.7x 1.0x 1.5x 1.6x LEVERAGE
RATIO
800
696 $ million 3Q19 3Q18
700
600
567 Net cash from operations 77.1 52.8
500 457 445 Capex (73.5) (55.9)
392
400 801
Net cash used in investment activities (71.0) (40.8)
621
300
654 Share repurchase - (8.3)
620 590 571
293
200
Dividend payments (6.1) (0)
328
100
Net cash used in financing activities (7.5) (9.3)
163 197
105 87 127
0
2014 2015 2016 2017 2018 3Q19
Total Debt Cash & Equivalents Net Debt
Notes:
1) Total financial debt includes short-term debt, long-term debt and derivative instruments
2) Net Debt = Total financial debt less cash and cash equivalents (*) Balance sheet and cash flow as reported, including Venezuela
3) Leverage ratio = Net financial debt / LTM adjusted EBITDAARCO in the market 2016
BRL Bond
2007 2011 2012 Tender Offer 2016
Acquisition of the IPO BRL Bond In April, we launched BRL Bond
business Reopening a tender offer for any Maturity
In April, AD issue
We commenced and all of the
84,507m Class A In April, we On July 13, we
operations on August outstanding BRL
Shares for reopened the BRL paid at maturity
3, 2007, as a result of Notes due July
$ 1,436m. Bond (yield of 9.5%) the remaining
our purchase of 2017. As a result,
and added R$275m outstanding
McDonald’s ARCO’s follow on: we redeemed 67.9%
principal amount
operations and real 44,476m Class A of the outstanding
of the BRL notes
estate in 20 territories Shares for principal amount. Debt Ratings
in LatAm $978.5m
FITCH: MOODY’S:
BB+, Stable Ba2, Stable
2013 Outlook Outlook
Liability 2016 2017
2009 2011 Management
& USD Bond USD Bond
USD Bond BRL Bond USD Bond
Issuance Tender Offer Issuance &
Issuance Issuance
In October, we In June, we Tender Offer
In October, we In July, we issued a
issued a 10y announced the In April, we issued a 10y
issued a 10y 5y BRL 400m bond at
$473.8m bond settlement of a cash $265m bond at 5.875%
$450m bond at 10.25% ($255.1m)
at 6.625% tender offer for $80 maturing on 2027. Proceeds
7.5% maturing on maturing on 2016
maturing on million of the 6.625% were used to repay the
2019
2023 senior notes due Secured Loan Agreement and
2023 to pay a cash tender offer for
$48.9 million of the 2023 notes2019
GUIDANCE
OPENINGS TOTAL CAPEX
80 TO 85 NEW BETWEEN $270
RESTAURANTS AND $300 MILLION2017-2019 Capex Plan
Accelerating EOTF deployment
>200 $390
MILLION IN
NEW RESTAURANTS REINVESTMENT
CAPEX
$210 to $220 million
$660
MILLION
EOTF reimages
EOTF ready
Dessert centers
$50TO$60 TOTAL CAPEX McCafé
MILLION IN OTHER CAPEX Kitchen equipment
IT & HR Other required CAPEXIR Contacts
Patricio “Iñaki” Esnaola Dan Schleiniger
Director of Investor Relations VP of Investor Relations
+54 11 4711 2561 daniel.schleiniger@ar.mcd.com
patricio.esnaola@ar.mcd.comDisclaimer
This presentation contains forward-looking statements that represent our beliefs, projections and predictions about future events or
our future performance. Forward-looking statements can be identified by terminology such as “may,” “will,” “would,” “could,” “should,”
“expect,” “intend,” “plan,” “anticipate,” “believe,” “estimate,” “predict,” “potential,” “continue” or the negative of these terms or other
similar expressions or phrases. These forward-looking statements are necessarily subjective and involve known and unknown risks,
uncertainties and other important factors that could cause our actual results, performance or achievements or industry results to differ
materially from any future results, performance or achievement described in or implied by such statements.
The forward-looking statements contained herein include statements about the Company’s business prospects, its ability to attract
customers, its affordable platform, its expectation for revenue generation and its outlook. These statements are subject to the general
risks inherent in Arcos Dorados' business. These expectations may or may not be realized. Some of these expectations may be
based upon assumptions or judgments that prove to be incorrect. In addition, Arcos Dorados' business and operations involve
numerous risks and uncertainties, many of which are beyond the control of Arcos Dorados, which could result in Arcos Dorados'
expectations not being realized or otherwise materially affect the financial condition, results of operations and cash flows of Arcos
> 28
Dorados. Additional information relating to the uncertainties affecting Arcos Dorados' business is contained in its filings with the
Securities and Exchange Commission. The forward-looking statements are made only as of the date hereof, and Arcos Dorados does
not undertake any obligation to (and expressly disclaims any obligation to) update any forward-looking statements to reflect events or
circumstances after the date such statements were made, or to reflect the occurrence of unanticipated events.You can also read