Half-Year Media Conference 2020 - 13 August 2020
←
→
Page content transcription
If your browser does not render page correctly, please read the page content below

Half-Year Media Conference 2020
13 August 2020
Agenda
Opening Statement
Jeannine Pilloud, CEO
Financial Review H1 2020
Dominik Maurer, CFO
Ascom during Covid-19 crisis
Jeannine Pilloud, CEO
2 Representatives of Slingeland Hospitals (NL)
Outlook
Jeannine Pilloud, CEO
Q&A
HALF-YEAR MEDIA CONFERENCE | 13 AUGUST | ©2020 ASCOM 2
Today’s Presenters of Ascom

           JEANNINE PILLOUD   DOMINIK MAURER
                 CEO               CFO

                                HALF-YEAR MEDIA CONFERENCE | 13 AUGUST | ©2020 ASCOM   3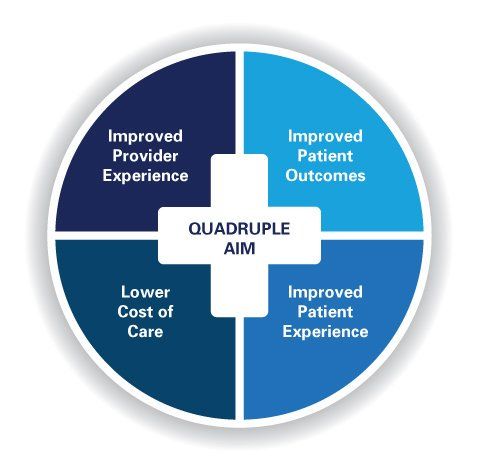
Our Commitment
As per Annual Media Conference 5 March 2020

                                              Execution Highlights
                                                    Business stabilized through lean organization
                                                    and strong leadership team with ambitious
                                                    goals

                                                    Regions with full end-to-end P&L responsibility

                                                    Set up of Clinical Solutions Team

                                                    Transformation Program SIFOX (Simplify,
                                                    Focus, Execution) to stabilize and transform the
                                                    business is advancing well - current focus on
                                                    simplification and realignment of go-to-market
                                                    and efficient delivery model

                                                HALF-YEAR MEDIA CONFERENCE | 13 AUGUST | ©2020 ASCOM   4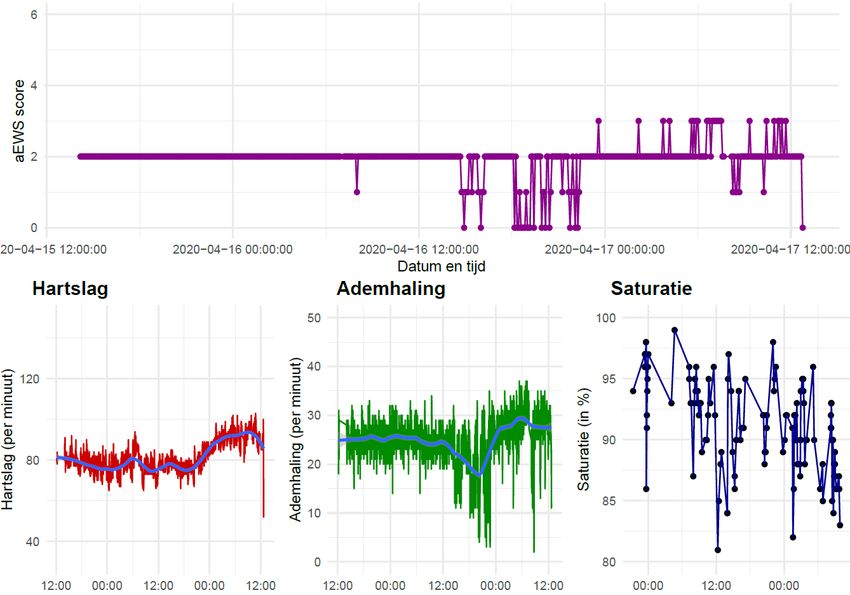
First Half-Year 2020 at a Glance
Decent Performance in H1 Despite the Covid-19 Crisis
      2.8% net revenue growth (at constant currencies)
      Substantial improvement of gross profit margin (47.8%) and EBITDA (+ CHFm7.7 vs. H1 2019 at constant currencies)

      Positive development in particular in USA & Canada as well as in UK and Nordics

      France with a temporary negative impact as market has been hit hard by severe lock-down

      Incoming orders with slight increase of 1.1% vs. H1 2019 at constant currencies in spite of Covid-19

      Solid double-digit order backlog increase

      Ascom benefited from emergency activities in certain markets during the Covid-19 crisis, which
      compensated partially for Covid-related project delays

      Ascom with improved balance sheet and positive net cash position

                                                                           HALF-YEAR MEDIA CONFERENCE | 13 AUGUST | ©2020 ASCOM   5
Financial Review H1 2020
Dominik Maurer, CFO

Key Figures H1 2020
At Actual Currencies                                             H1 2020                                                     H1 2019
                                                                                                                                                                Variance to PY
                                                                                                                                                               cc                  CHF

           Net revenue                                        133.4 CHFm                                                 137.0 CHFm                         +2.8%                -2.6%

           Incoming orders                                   154.8 CHFm                                                  161.7 CHFm                          +1.1%               -4.3%

           Order backlog                                     194.3 CHFm                                                  172.1 CHFm                         +17.6%              +12.9%

                                                                8.4 CHFm                                                  1.4 CHFm
           EBITDA                                                                                                                                        +7.7 CHFm          +7.0 CHFm
                                                    (EBITDA margin of 6.3%)                                    (EBITDA margin of 1.0%)

           Group profit                                        -0.3 CHFm                                                 6.5 CHFm*                       -6.8 CHFm           -6.8 CHFm

           FTE                                                      1,269                                                     1,306                          -2.8%               -2.8%

        Note: All values as reported = actual currencies, when marked cc=constant currencies, eliminating currency impacts            HALF-YEAR MEDIA CONFERENCE | 13 AUGUST | ©2020 ASCOM   7
        *incl. positive one-off effects of CHFm 8.3, mainly due to the sales of the Technologiepark Teningen (Germany)
Incoming Orders Increased by 2% (at Constant Currencies w/o OEM)
In CHFm
USA & Major Regions
Canada Europe
29.4 93.7
%-CHF:
+21.0% %-CHF:
-9.6%
%-cc:
+24.7% %-cc:
-4.2%
Rest of
OEM World
7.8 23.9
%-CHF: %-CHF:
-15.2% -2.4%
%-cc:
-8.7% %-cc:
+4.1%
Note: Regional clusters shown follows new structure valid for 2020 HALF-YEAR MEDIA CONFERENCE | 13 AUGUST | ©2020 ASCOM 8
All values as reported = actual currencies, when marked cc=constant currencies, eliminating currency impactsH1 2020 Revenue Development
In CHFm
Revenue growth at constant currencies: +2.8%
140.9
3.9
137.0 -7.5
133.4
H1 2019 Revenue Revenue Growth H1 2020 Revenue at Currency Effect H1 2020 Revenue
Constant Currencies
Note: All values as reported = actual currencies HALF-YEAR MEDIA CONFERENCE | 13 AUGUST | ©2020 ASCOM 9Revenue H1 2020 – Regional Development
Deviations at Actual Currencies (%-CHF) and at Constant Currencies (%-cc)
Revenue Variance to PY
Region
CHFm %-cc %-CHF
DACH 22.5 +0.0% -3.0%
France & Spain 7.6 -29.2% -32.7%
Netherlands 24.4 -1.5% -6.9%
Nordics 19.2 +15.3% +4.9%
UK 6.7 +22.4% +15.5%
USA & Canada 26.1 +13.0% +9.7%
Rest of World 18.6 +6.4% -0.5%
OEM 8.3 -8.2% -14.4%
Note: Regional clusters shown follows new structure valid for 2020
HALF-YEAR MEDIA CONFERENCE | 13 AUGUST | ©2020 ASCOM 10
All values as reported = actual rates, when marked cc=constant currencies, eliminating currency impactH1 2020 – Income Statement
In CHFm 2020 % 2019 % Variance Variance
%-cc %-CHF
Net Revenue 133.4 100.0% 137.0 100.0% 2.8% (2.6%)
Cost of Sales (69.7) (52.2%) (75.7) (55.3%) (3.2%) (7.9%)
Gross Profit 63.7 47.8% 61.3 44.7% 10.3% 3.9%
Marketing and Sales (33.9) (25.4%) (40.7) (29.7%) (12.3%) (16.7%)
Research and Development (17.9) (13.4%) (15.8) (11.5%) 20.3% 13.3%
Administration (10.4) (7.8%) (9.4) (6.9%) 14.9% 10.6%
Other Operating Expenses (0.5) (0.4%) (0.8) (0.6%) 12.5% (37.5%)
EBIT 1.0 0.7% (5.4) (3.9%)
EBITDA 8.4 6.3% 1.4 1.0%
Group Profit for the Period (0.3) (0.2%) 6.5* 4.7%
Note: All values as reported = actual currencies, when marked cc=constant currencies, eliminating currency impact
*incl. positive one-off effects of CHFm 8.3, mainly due to the sales of the Technologiepark Teningen (Germany) HALF-YEAR MEDIA CONFERENCE | 13 AUGUST | ©2020 ASCOM 11EBITDA Development
In CHFm
8.4
2.9
1.1
3.7
1.4
-0.7
2019 H1 EBITDA Currency Effects Revenue and Productivity Related Negative One-Offs Cost Reduction 2020 H1 EBITDA
Note: All values in CHFm, EBITDA reported = actual currencies HALF-YEAR MEDIA CONFERENCE | 13 AUGUST | ©2020 ASCOM 12Cash Flow Development
In CHFm
-5.2
-12.0
28.8
29.2
0.0 -0.6
18.2
Cash and Cash Cash from CAPEX Borrowing Dividends Other Cash Flows Cash and Cash
Equivalents at Operating Activities Repayments Equivalents at
31.12.2019 30.06.2020
Note: All values in CHFm at actual currencies HALF-YEAR MEDIA CONFERENCE | 13 AUGUST | ©2020 ASCOM 13Balance Sheet
In CHFm
2020 2019 2019 2018
30-Jun 31-Dec 30-Jun 31-Dec
Cash & Cash Equivalents 29.2 18.2 14.2 21.2
Borrowings 28.0 40.0 25.0 20.0
Net Cash 1.2 (21.8) (10.8) 1.2
Net Working Capital 44.2 68.2 61.3 74.5
Total Assets 200.6 214.2 198.6 218.4
Total Equity 61.2 63.2 70.0 83.2
Equity Ratio 30.5% 29.5% 35.2% 38.1%
Note: All values in CHFm at actual currencies HALF-YEAR MEDIA CONFERENCE | 13 AUGUST | ©2020 ASCOM 14Ascom During Covid-19 Crisis Jeannine Pilloud, CEO & 2 Representatives of Slingeland Hospital (NL)
Highlights and Lowlights During Covid-19 Crisis
                 Highlights                                           Lowlights

    Win of several deals in both, Healthcare and      Covid-19 crisis hit in particular the French market
    Enterprise sector                                 hard – considerable impact on French business

    Ascom revenue benefited from emergency
    activities in certain markets compensating some   Some projects were delayed into H2
    Covid-19 related project delays

                                                      International collaboration and support will be
    Good staff morale and team spirit during the      impacted for longer period; no prognosis possible
    Covid-19 crisis                                   at today’s state

    Very few employees infected by Covid-19

                                                         HALF-YEAR MEDIA CONFERENCE | 13 AUGUST | ©2020 ASCOM   16
Selection of Substantial Wins in H1 2020
Major
Distribution
Partner in
Germany of
Healthcare CHFm 5.5 Helsinki
Provider in University
the US of Hospital of
CHFm 1.2 CHFm 1.9
Wins*
Major Chain
Renowned of Clinics in
Retailer in UK Germany of
of CHFm 2.5 CHFm 1.2
Large Health
Network in
US of CHFm
1.7
= Healthcare
HALF-YEAR MEDIA CONFERENCE | 13 AUGUST | ©2020 ASCOM 17
= Enterprise *total contract valueShowcase Slingeland Hospital
Slingeland Project

     GABY PONS VAN DIJK           NICK SCHOENAKER                            MARIO DE LIJSTER
    PHD, MD, NEUROLOGIST   MSC, NURSE SPECIALIST NEUROLOGY                    PROJECT LEAD
    SLINGELAND HOSPITAL          SLINGELAND HOSPITAL                       ASCOM NETHERLANDS

                                                             HALF-YEAR MEDIA CONFERENCE | 13 AUGUST | ©2020 ASCOM   19
Smart
SmartMonitoring:
Monitoring:
Improvingthe
Improving thequality
qualityofof care
care through
through continuous
continuous monitoring
monitoring of vital
of vital signssigns
August2020
August 2020
Slingeland Hospital
Gaby Pons van Dijk, PhD, MD, Neurologist
Nick Schoenaker Msc, Nurse Specialist Neurology
20Slingeland Hospital
The challenge: Aging population, migration of youth
The Goal: “Achterhoek” the healthiest region in the Netherlands
Thus: Relieving pressure on the healthcare system
The method: Quadruple aim
Generating and using data
Communication
Inside Slingeland: Smart monitoringSuccess Factors for Better
Patient Outcome
Continuous measurement of vital signs
Early detection of changing condition
Shorter length of stay
+
Better patient outcome
Decision support via artificial intelligence /
clinical decision support system
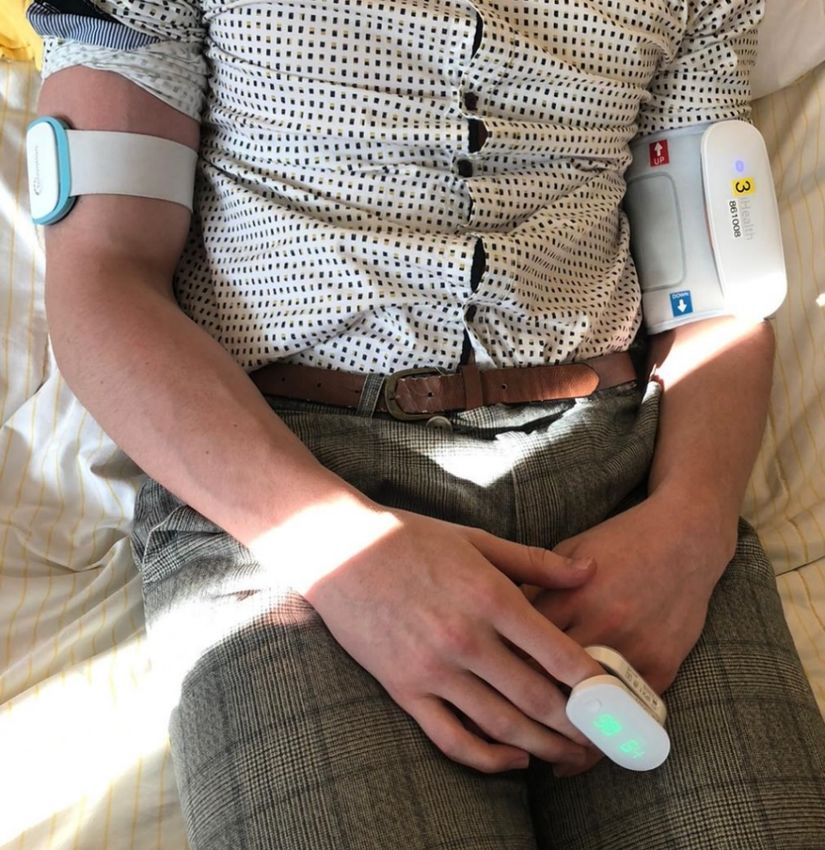
Treat before actual incident happensContinuous Vital Sign Measurements
Area Components Requirements Ascom Solution
Heart rate Free choice in sensors
Respiratory rate Data integration
Digistat
Blood pressure (Software & Services)
Oxygen
Measure saturation
Early Warning Hospitals “own”
Score algorithms Digistat
Medical device direction / (Software & Services)
Medical device regulation
Analyze certification
With caregiver Integration with Nurse call Unite
Central control Clinical workflow Myco 3
room knowledge Consultancy
CommunicateAnd then Covid-19 hit us…
Project Sensing Clinic in Covid-19 Positive Patients

 “In my 25 years as a pulmonologist, I've never seen people deteriorate as quickly with a viral
 infection as I did with corona..”
 “We sometimes get people in who say: I don't really feel that distressed at all', says pulmonologist
 Pascal Wielders of the Catharina Hospital in Eindhoven. But in the meantime, we see from the
 oxygen value in their blood, that they are. What's more, we see that they're starting to turn blue..”

 Volkskrant: 27-03-2020

      Ascom changed the setup and algorithm, we changed workflow:
           First inclusion of Covid-19 patients on 1 April 2020
Trends of Vital Signs During Covid-19 Outbreak
(Patient Admitted to ICU)
First ICU
notification admittance
Heartrate Respiratory rate Oxygen levelNext Steps With Our Partners:
Rollout From a Local Setup to a National Standard
NATIONAL
REGIONAL
LOCAL
Patients at home (incl. general practitioners)
Care hotels Care hotels
Nursing homes Nursing homes
Scale up in hospital
(+140 patients) Hospital HospitalsOutlook Jeannine Pilloud, CEO
Outlook 2020 Reiterated
As per Annual Media Conference 5 March 2020

                                                         This is based on the assumption that the
                                                          Covid-19 crisis will not worsen again

                                              HALF-YEAR MEDIA CONFERENCE | 13 AUGUST | ©2020 ASCOM   29
Q&A
Next Event – Annual Media
Conference on 11 March 2021
Restaurant Metropol, Zurich
LEGAL DISCLAIMER

This document contains specific forward-looking statements, e.g. statements including terms like “believe”,
“expect” or similar expressions. Such forward-looking statements are subject to known and unknown risks,
uncertainties and other factors which may result in a substantial divergence between the actual results, financial
situation, development or performance of Ascom and those explicitly presumed in these statements.

Against the background of these uncertainties readers should not rely on forward-looking statements. Ascom
assumes no responsibility to update forward-looking statements or adapt them to future events or developments.

                                                                          HALF-YEAR MEDIA CONFERENCE | 13 AUGUST | ©2020 ASCOM   32
You can also read