What next for the GB Capacity Market? - Indications from US experience July 2016 - Charles River Associates
←
→
Page content transcription
If your browser does not render page correctly, please read the page content below

What next for the GB
Capacity Market?

Indications from US experience
July 2016

Content

         1
                   US capacity markets have stimulated new CCGT investment

                   2
                               The GB capacity market, while based on US design, is not the same

                               3
                                     GB capacity market design differences have a material impact on prices

                                   4
                                          Further capacity market reform may better support generation investment

2   Private and Confidential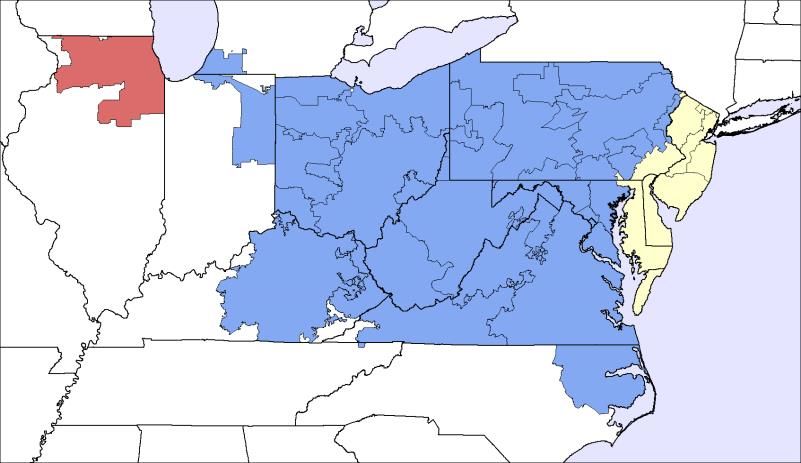
The US capacity markets have helped stimulate a large
amount of new capacity development
                ■ Over the last five auctions, close to 33 GW of new capacity have cleared the PJM auction. Of this, over 25
                  GW are CCGTs
                ■ While new development has been much lower in ISO-NE (the market is ~20% the size of PJM), 3.4 GW of
                  new capacity have cleared the auction over the last five years. Of this, around 2.4 GW are CCGTs
                ■ By contrast, in GB, one new CCGT cleared the auction for 2018─2019, but it has not yet achieved financial
                  close. The CCGT that cleared the 2019─2020 auction was Carrington, which has been under construction
                  since 2013

   Cleared New Capacity                                                           Cleared New CCGT Capacity

                2015-16                                                           2015-16

                2016-17                                                           2016-17
Delivery Year

                2017-18                                                           2017-18
                                                                                                     * (Trafford Power)
                2018-19                                                           2018-19
                                                                                                * (Carrington)
                2019-20                                                           2019-20

                            -        2,000     4,000     6,000   8,000   10,000             -     2,000          4,000    6,000   8,000   10,000
                                                Capacity (MW)                                                     Capacity (MW)

                                    GB       PJM - RTO     ISONE - All                           GB        PJM - RTO        ISONE - All

3               Private and Confidential
The GB capacity market drew on the US capacity markets, but
there are significant differences in each of the key building
blocks of market design
Key building Design Key differences
blocks elements between US and UK
Qualifying generation and Renewable generation eligible for
DSR participation in US markets (heavily de-
Capacity product rated)
Product design specifications: Plant specific de-rating factor
performance
Shorter contract duration
requirements and
notification, duration Zonal prices
Contract obligations and
No “capacity market warning”
penalties for non-
Performance compliance Non-performance penalties higher in
incentives PJM
Non-completion penalties
Auction process PJM is single sealed bid auction, ISO-NE
is descending clock auction
Delivery year
Auction PJM and ISO-NE auctions are run three-
Reliability standard
design years ahead of delivery
Must offer requirements
US targets higher reliability standards
Sloped demand curves using a “Reserve Margin” target
4 Private and ConfidentialSome US-GB differences have a significant pricing impact
Locational requirements in GB would drive up prices in southern zones
CM Component Design Considerations US Experience
Need to balance the increased competition PJM and ISO-NE clear congested zones
possible through system-wide mechanisms separately (Locational Deliverability Areas or
with the locational requirements of reliability LDAs)
Locational Parameters used to define constrained zones In PJM, when the system-wide clearing price does
requirement may be complex not attract sufficient resources to meet the
requirements for a zone (inclusive of transmission
Methodology used to determine locational
imports), a locational price adder will reflect the
prices (e.g. separate auctions by zone or
price of the local resources that are needed
clearing algorithms)
PJM Capacity Clearing Prices (2019─20)
ComEd
CP: £51.04/kW-year
Base: £46.01/kW-year
EMAAC
Rest of RTO CP: £30.15/kW-year
CP: £25.17/kW-year Base: £25.11/kW-year
Base: £20.141/kW-year
5 Private and ConfidentialSome US-GB differences have a significant pricing impact
DECC estimation of net CONE impacts slope of demand curve
CM
Design Considerations US Experience
Component
Cost of New Entry (CONE) represents the first- The US ISOs typically used simple-cycle combustion
year total net revenue (net of variable operating turbines as the reference technology for CONE.
costs) a new generation resource would need However, recent proposals have suggested basing
in order to recover its capital investment and CONE on both the cost of an OCGT and CCGT
fixed costs - ISO-NE now bases CONE on a dual-fuel combined
The difference between gross CONE and net cycle technology
CONE - PJM still bases CONE on a simple cycle technology
CONE should reflect expected energy and
ancillary services revenues (dual fuel)
The technology that is used as a benchmark for Following consultations in 2014, GB moved from a
“new generation resource” dictates important proposed CONE based on OCGT to one based on
parameters on the demand curve and CRM CCGT a few months before the auction but it is unclear
design how Net CONE was then calculated
Based on CCGT Based on OCGT Based on CCGT
150
£/kW-year
100
50
-
GB PJM ATSI PJM SW MAAC PJM EMAAC PJM ComEd PJM - RTO ISONE - All
GB Net CONE significantly
lower than in US markets Gross CONE Net CONE
* Gross CONE for GB calculated by CRA using DECC's capital cost assumptions, 7.5% WACC and 20-years recovery.
6 Private and ConfidentialSome US-GB differences have a significant pricing impact
System stress notification in GB makes participation lower risk for small-scale participants
CM Component Design Considerations US Experience
US obligation for base PJM and ISO-NE have moved from a one settlement system
capacity is year-round based on yearly capacity payments with little or no penalties
There is no pre-notified for non-performance, to a two settlement system with an initial
Capacity capacity payment, adjusted with over or under-delivery
system stress event
obligation payments
Performance penalties are high in PJM but participants can
use incremental auctions to adjust their exposure
Potential penalties for non-performance in PJM are higher
PJM ISO-NE GB
Penalty charge is Net Penalty charge transitions Penalty charge is capacity
CONE / 30 (~$3,000/MW from $2,000/MWh to clearing price / 24. The
with significant regional $5,455/MWh. In ISO-NE, the GB market caps potential
variance); the PJM non- monthly limit is 2.5 x monthly losses at 200% of monthly
performance charge is capacity revenues and the revenues and 100% of
capped at 1.5 x Net CONE annual limit is 12 months of overall annual revenues
annually capacity revenues
7 Private and ConfidentialSome US-GB differences have a significant pricing impact
Capacity requirements in GB anticipate tighter margins than in the US
CM
Design Considerations US Experience
Component
Choice of security standard US capacity markets justify different security standards
- Reserve margin/ capacity margin based on level of interconnection and largest
- LOLE contingencies
Capacity Estimation of plant performance (outage US markets calculate plant-specific outage rates, while
requirements rates) GB has gone with a generic outage rate approach
Near-term vs. multi-year capacity Consistent over-estimation of forward capacity
requirements requirements was a persistent problem in the PJM market
Target Capacity Margin*
14% 15%
13% 13%
10%
PJM NYISO ISO-NE MISO GB**
* All US capacity markets have Reserve Margin ((Capacity-Demand)/Demand) targets based on installed capacity. These have been converted to Capacity Margins ((Capacity-Demand)/Capacity).
** Based on our analysis of Ofgem and National Grid reports, GB’s 3 hours LOLE reliability target roughly equates to a 10% Capacity Margin based on un-derated capacity.
8 Private and ConfidentialNew CCGT development is driven by both energy market
fundamentals and capacity market revenues
■ Energy margins for some CCGTs in PJM (particularly those with access to cheap gas from the Marcellus and Utica
production regions) can expect energy gross margins in excess of Net CONE
■ In other regions (like PJM-ComEd or ISO-NE), higher locational capacity prices help compensate for lower energy
margins
■ In contrast in GB, while capacity scarcity is expected to lead to increasing price volatility over the next couple of years,
energy margins around 2019-2020 are expected to remain low due to growing renewable generation, increased
interconnection, and gas-on-gas competition at the margin
■ Low Net CONE values, low requirements from LOLE, lack of locational capacity prices and competition from distributed
generation (subject to any reform of transmission charges) may further limit new CCGT development in GB
Expected Gross Margins for a CCGT in 2019/2020
140
120 15-Year Recovery
Nominal £/kW-year
100 20-Year Recovery
80 25-Year Recovery
60
40
20
0
PJM - West PJM - ComEd ISO-NE GB**
Capacity Revenue Energy Margin A/S Revenue
Gross CONE Net CONE
* Indicative numbers for new representative CCGTs in each region
** Gross CONE numbers for GB calculated based on DECC latest cost of generation estimates
9 Private and ConfidentialIncentives for GB investment can be enhanced by further
capacity market reform
■ Incentives for new CCGT development are a function of the combination of expected energy market revenues and capacity
payments
■ But differences in the design of capacity markets can by themselves materially impact the level of capacity payments
CM Component Impact on Investment US Experience
Reliability targets Drives capacity demand Reliability targets are typically set higher in US markets
Used to determine the slope of the Net CONE higher in US markets driven by higher capital
Net CONE demand curve costs used to calculate gross CONE and lower energy and
A/S revenue adjustments used to set net CONE
Resource Number, type and size of Distributed generation, load reduction and intermittent
participation competitors renewables eligible in US markets
Risk of penalties to be factored into More stringent performance requirements in the US
capacity market bid (performance assessed in retrospect without a 4-hour
Penalties and
Competition limited to those warning)
incentives
confident in meeting contract Non-performance penalties in PJM can exceed capacity
obligation payments
Higher value assigned to generation Unlike GB, the PJM and ISO-NE capacity markets have
Zonal prices
placed in constrained regions zonal capacity prices
Length of fixed revenue stream can New plant can opt for 3-year contracts in PJM, 7-year
Contract length
lower cost of capital contracts in ISO-NE and 15-year contracts in GB
10 Private and ConfidentialDisclaimer This report shall not be construed as providing legal or financial opinions or guidance. Any opinion expressed herein shall not be interpreted as any form of assurance or guarantee with respect to future events or circumstances, and the content of this report may not be relied on for investment purposes. To the extent the information in this report is to be used to make legal or financial determinations, you should seek advice from your own legal counsel and/or financial advisors. Your use of this report, including any reliance on it, are your responsibility. CRA accepts no duty of care or liability of any kind whatsoever to you, and you waive and release CRA for all claims, liabilities and damages, if any, suffered as a result of decisions made, or not made, or actions taken, or not taken, based on this report. Detailed information about Charles River Associates, a registered trade name of CRA International, Inc., is available at www.crai.com. Copyright 2016 Charles River Associates 11 Private and Confidential
London
                      Tel +44 (0)20 7664 3700
                      Fax +44 (0)20 7664 3998
                      99 Bishopsgate
                      London EC2M 3XD
                      United Kingdom

                      Robin Cohen
                      +44 20 7959 1444 direct
                      +44 78 8151 8181 mobile
                      rcohen@crai.com
                      Ana Barillas
                      +44 20 7959 1547 direct
                      +44 77 8559 3471 mobile
                      abarillas@crai.com

www.crai.com/energy
You can also read