2021 Wells Fargo Industrial Conference - May 5,2021 | Sonoco Investor Update
←
→
Page content transcription
If your browser does not render page correctly, please read the page content below
2021 Wells Fargo Industrial Conference
         May 5,2021   | Sonoco Investor Update

                                                 1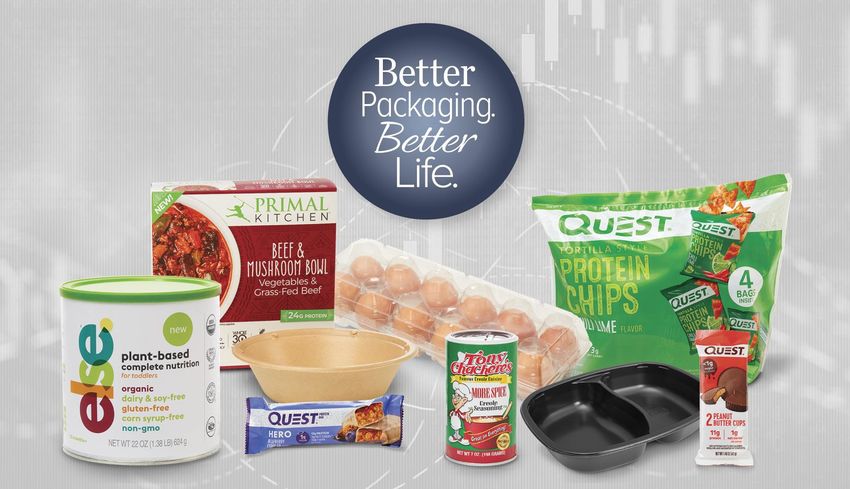
Forward-Looking Statements /
Non-GAAP Financial Measures
Today’s presentation contains a number of forward-looking statements based on current expectations, estimates and
projections. These statements are not guarantees of future performance and are subject to certain risks and
uncertainties. Therefore, actual results may differ materially.

Information about the Company’s use of non-GAAP financial measures, why management believes presentation of
non-GAAP financial measures provides useful information to investors about the Company’s financial condition and
results of operations, and the purposes for which management uses non-GAAP financial measures is included in the
Company’s Annual Report and on the Company’s website at sonoco.com under Investor Relations, Webcasts &
Presentations, Non-GAAP Reconciliations for Q1 2021 and Q2 and Full-Year 2021 Outlook.

Pursuant to the requirements of Regulation G, the Company has provided definitions of the non-GAAP measures
discussed during this presentation as well as reconciliations of those measures to the most closely related GAAP
measure on its website at sonoco.com.

This presentation does not constitute the solicitation of the purchase or sale of any securities.

                                                                                                                    2
Sonoco by the Numbers

                        3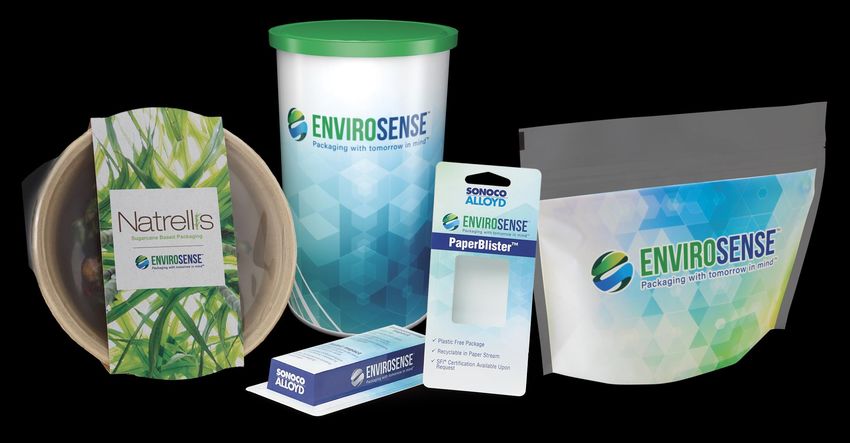
Sonoco is a Global Essential Services Provider
• We are the global leader in paper food cans and provide flexible
  and rigid plastic food packaging
   • 80% of Sonoco’s Consumer Packaging products are for food
• We are the global leader in the production of uncoated
  recycled paperboard, tubes, cores and cones
• We are a provider of healthcare, protective and retail packaging

                                                                     4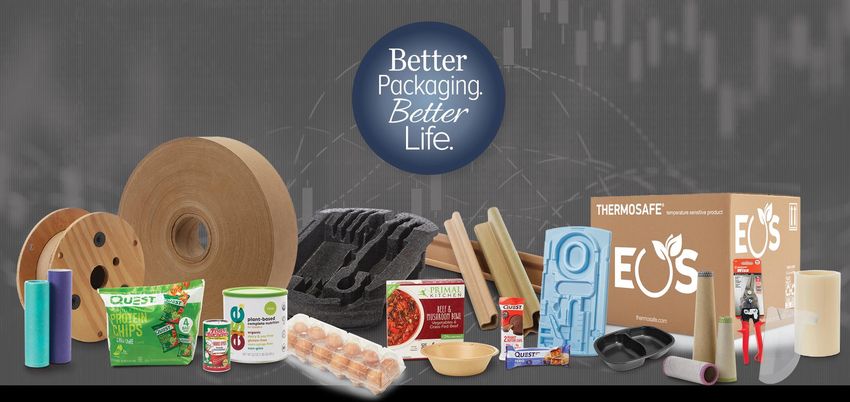
First Quarter 2021
    Key Financial Results
In millions ($), except EPS
                              Q1 2021    Q1 2020                        Comments
                                                   •   Volume / Mix +$46mm or 3.5% vs Q1-20
  Net Sales                    $1,353     $1,303   •   Price +$48mm
                                                   •   Acquisition/Divestiture net impact: ($60) million
                                 $278      $267    •   Strong volume/mix and productivity; Inflation /
  Gross Profit                   20.5%     20.5%       weather / supply chain challenges

 SG&A Expense,                                     •   Higher expenses for incentives, IT spend and
                               $(138)     $(123)       property insurance (as expected)
 Net of Other Income

 Operating Profit                $140      $144
                                 10.3%     11.0%

                                                   •   Delivered at high end of guidance range
  EPS (Base)                    $0.90      $0.94   •   Solid operational results

                                                   •   Good Working Capital management
  Free Cash Flow (YTD)            $99       $57    •   Cap ex spend $39 million

                                                                                                           5
New Segment Structure

                        6
Consumer Packaging
                                                                            ($ Millions)            1Q 2021   1Q 2020
Global Rigid Paper Containers   Plastics – Food        Flexible Packaging   Net Sales                  $583      $541
• North America                 • Prepared and         • Trident            Base Operating Profit       $76       $64
• Europe                            Specialty Foods
• Asia                          • Perimeter of Store
• South America
                                                                            ($ Millions)            FY 2020   FY 2019
                                    (PrOS)
                                                                            Net Sales                $2,230    $2,211
                                                                            Base Operating Profit      $278      $207
                                                                                                                        7
Sonoco Acquires Can Packaging
• Adds advanced innovation and production of sustainable
  paper packaging in Europe
• Featured product: Greencan® recyclable paperboard package
  (92% to 98% paperboard)
• Proprietary manufacturing equipment, suitable
  for global growth markets

                                                              8
Sonoco Divests Europe and U.S. Display & Packaging
• Sold Europe operation to Prairie Industries Holdings
  (backed by The Halifax Group) for $120 million
• Sold U.S. operations to Hood Container for $80 million
• Divestiture aligns with the Company’s effort to focus
  on Consumer and Industrial businesses

                                                           9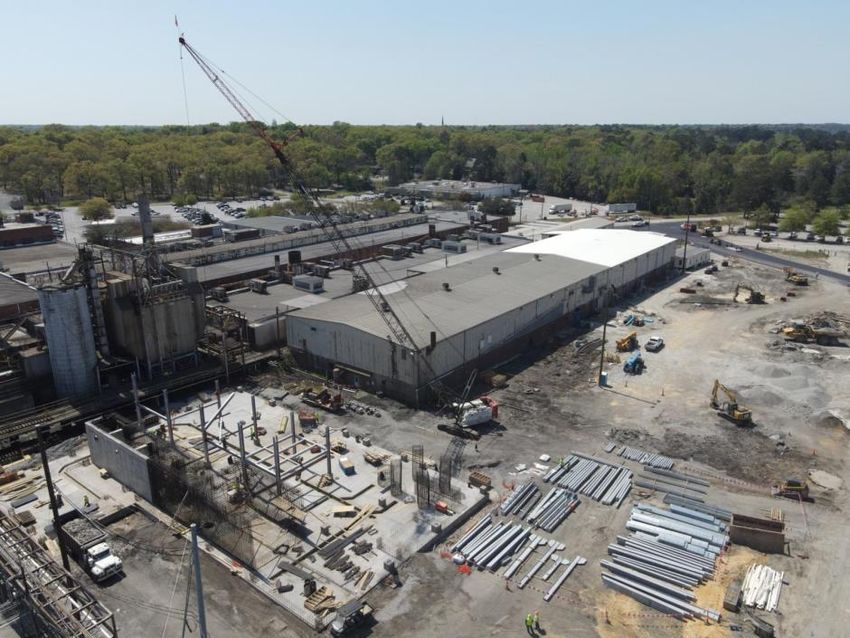
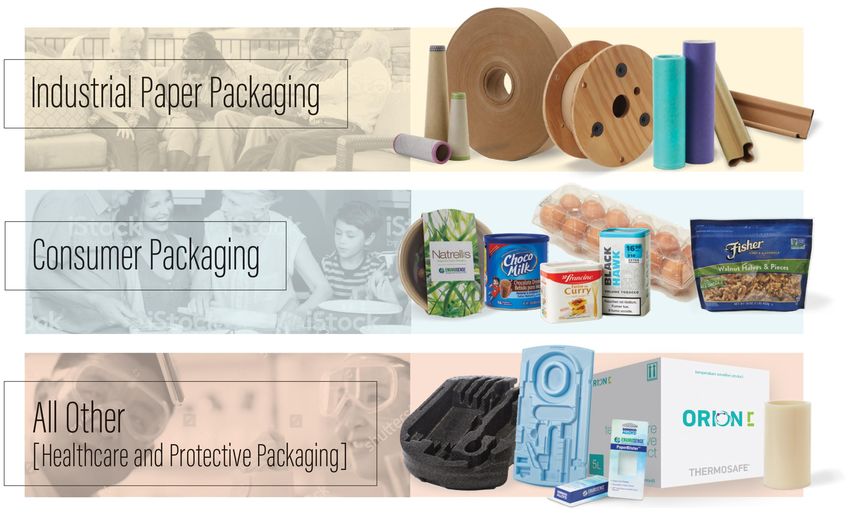
Industrial Paper Packaging
                                                                ($ Millions)            1Q 2021    1Q 2020
Global Paper      Global Tubes & Cores     Other
                                                                Net Sales                  $565       $502
• U.S. & Canada   • North America          • Conitex (Cones)
• Latin America   • Europe                 • Reels              Base Operating Profit       $50        $60
• Europe          • Latin America/Brazil   • Protective Fiber
• Recycling       • Asia                                        ($ Millions)            FY 2020    FY 2019
• Adhesives                                                     Net Sales                 $1,991    $2,037
                                                                Base Operating Profit      $177       $245
                                                                                                             10
Our 2021 Focus – Project Horizon
• Inbound Raw Material Optimization
• New Stock Prep System
• Finished Goods Warehouse
• #10 Conversion
11Making a Step-change in Driving Integrated
Automation and Robotics
Sonoco Partnering with Integrated Systems Inc.
• What is covered under the
agreement?
• ISI will dedicate engineers,
programmers
and project managers to our projects
• Annually, we will dedicate up to $10
million
in automation projects
• Will participate in R&D, prototyping,
testing and project development
12All Other
Healthcare (TEQ) Industrial and Specialty Plastics
($ Millions) 1Q 2021 1Q 2020
ThermoSafe Paperboard Specialties Net Sales $205 $260
Protective Solutions (Protexic) Base Operating Profit $50 $60
Alloyd
($ Millions) FY 2020 FY 2019
Net Sales $1,016 $1,066
Base Operating Profit $72 $73 13Sonoco ThermoSafe Growth
• ThermoSafe business Global Biopharma Sales Trend 2018–2024 ($billions)
highly correlated to
growth of biotech drugs
• Biotech drugs need
temperature control
• Cold chain =
speed-to-market
14Committed to Our Purpose, Our People and Our Planet
15EnviroSense® Packaging
16EPS and Cash Flow Guidance
1st Qtr 2nd Qtr 3rd Qtr 4th Qtr Full Year
2019 Base EPS $0.85 $0.95 $0.97 $0.75 $3.53
2020 Base EPS $0.94 $0.79 $0.86 $0.82 $3.41
2021 Actual Q1 & Guidance $0.90 $0.82 - $0.88 $3.50 - $3.60
($ millions) December 31, 2021
Full Year Cash Flow Guidance Est. Low End Est. High End
Operating Cash Flow $ 570 $ 600
Free Cash Flow $ 270 $ 300
* 2021 Cash flow guidance excludes an estimated pension contribution related to the U.S. pension plan termination.
Projected contribution is estimated to be $150 million.
17Capital Deployment Strategy
Total capital Pursue accretive
expenditures acquisitions in our
in 2021 core Consumer and
$300
Industrial markets
Million
18Appendix
19R. Howard Coker, 59, is President and CEO of Sonoco. In
this role, Coker has global leadership, sales and operating
responsibility for all of the Company’s diversified consumer,
industrial and protective packaging businesses. He previously
served as Senior Vice President, Global Paper/Industrial
Converted Products.
Coker also served as Senior Vice President, Rigid Paper
Containers and Paper/Engineered Carriers International,
where he had responsibility for the Company’s global
composite can operations in North America, South America,
Europe and Asia, as well as paper, tube and core operations in
Europe, Latin America and Australasia.
Prior to that, Coker served as Vice President, Rigid Paper and
Closures, North America. In this role, he had responsibility for
Sonoco's 21 rigid paper container and seven metal and peelable
membrane closure operations in the United States, Canada and
Mexico. He was also elected a Corporate Officer in February
2009.
He also served as Group Vice President and held several
leadership positions running global consumer-related and
industrial businesses.
Coker joined Sonoco in 1985.
He is a 1985 graduate of Wofford College with a B.A. in
Business Administration, and he received an MBA from Wake
Forest University in 1990.
He is married, has three children and lives in Hartsville, SC.
Howard Coker
President and CEO of Sonoco
20EPS Summary
1st Quarter: 2021 Vs. 2020
1st Quarter
2021 2020
Actual EPS $ 0.71 $ 0.80
Addback for:
Restructuring & Asset Impairments 0.05 0.09
Non-Operating Pension Costs 0.05 0.06
Loss on Sale of Display & Packaging US 0.03 —
M&A Costs, Other Items 0.06 (0.01)
Base EPS* $ 0.90 $ 0.94
Sonoco Guidance $0.80 to $0.90
*NOTE: Due to rounding individual items may not sum down
21P&L Summary (Base)
1st Quarter: 2021 Vs. 2020
(Dollars in millions)
Better / (Worse)
2021 2020 $ %
Net sales $ 1,353 $ 1,303 $ 50 3.8%
Gross profit 278 267 11 4.2%
SG&A expenses, net of Other Income (138) (123) (15 ) (12.7)%
Operating profit $ 140 $ 144 $ (4 ) (2.9)%
Net interest (18) (16) (2 ) (10.5)%
Provision for income taxes (31) (33) 2 6.0%
Net Income, after tax $ 91 $ 95 $ (4 ) (4.2)%
Equity in Affiliates and Minority Interest 1 1 — 0%
Net income attributable to Sonoco $ 92 $ 95 $ (3 ) (3.8)%
EBITDA $ 202 $ 206 $ (4 ) (2.0)%
Gross profit % 20.5 % 20.5 %
SG&A % 10.2 % 9.4 %
OP % 10.3 % 11.0 %
EBITDA% 14.9 % 15.8 %
Effective tax rate 25.7 % 26.0 %
NOTE: Totals and percentages are based on unrounded amounts 22Sales Bridge 1st Quarter: 2021 Vs. 2020 (Dollars in millions) NOTE: Totals and percentages are based on unrounded amounts 23
Base Operating Profit Bridge
1st Quarter: 2021 Vs. 2020
(Dollars in millions)

NOTE: Totals and percentages are based on unrounded amounts   24
Segment Analysis
               1st Quarter: 2021 Vs. 2020
               (Dollars in millions)
                                                                     NET SALES                                     BASE OPERATING PROFIT
                                                   2021                2020                % Chg              2021          2020         % Chg

          Consumer Packaging                           $      583          $    541               7.8%          $    76      $    64         18.6 %

          Industrial Paper Packaging                          565               502              12.5%               50           60         (15.8 )%

          All Other                                           205               260              (21.2)%             14           21         (32.5 )%

          Total Sonoco                                 $ 1,353             $ 1,303                3.8%          $ 140        $ 144            (2.9 )%

                                                                                                           OPERATING PROFIT AS % OF       MARGIN
                                                                                                                   SALES                  CHANGE

                                                                    Consumer Packaging                              13.0 %       11.8 %       1.2%

                                                                    Industrial Paper Packaging                      8.9 %        11.9 %       (3.0 )%

                                                                    All Other                                       6.8 %        7.9 %        (1.1 )%

                                                                    Total Sonoco                                    10.3 %       11.0 %       (0.7 )%
NOTE: Totals and percentages are based on unrounded amounts                                                                                             25
Cash Flow
Year to date: 2021 Vs. 2020
(Dollars in millions)
Year To Date
Q1 2021 Q1 2020 Change
Net income $ 72 $ 80 $ (8)
Asset impairment charges / Loss on divestiture 7 1 6
Depreciation and amortization expense 62 61 1
Pension and postretirement plan contributions, net of expenses (12) (10) (2)
Changes in working capital (29) (70) 41
Changes in tax accounts and other operating activity 39 27 12
Operating cash flow $ 139 $ 88 $51
Capital expenditures, net (39) (31) (8)
Free cash flow $ 99 $ 57 $42
Cash dividends paid $ (45) $ (43) $ (2)
NOTE: Totals are based on unrounded amounts 26Balance Sheet
(Dollars in millions)
4/4/2021 12/31/2020 Change $
Cash and cash equivalents $ 588 $ 565 $ 23
Trade accounts receivable, net of allowances 667 659 8
Other receivables 177 104 73
Inventories 474 451 23
Prepaid expenses 45 53 (8)
Current Assets $ 1,951 $ 1,831 $ 120
Property, plant and equipment, net 1,213 1,244 (31)
Goodwill 1,328 1,389 (61)
Other intangible assets, net 307 322 (15)
Right of Use Asset - Operating leases 279 296 (17)
Other assets 204 195 9
Total Assets $ 5,281 $ 5,277 $ 4
Payable to suppliers and others 1,067 1,048 18 Net debt = Total debt minus
Income taxes payable 20 7 13 cash and cash equivalents
Total capital = Net debt plus
Total debt 1,696 1,700 (4) total equity
Pension and other postretirement benefits 170 172 (2)
Noncurrent operating lease liabilities 247 262 (15)
Deferred income taxes and other 169 177 (8) NOTE: Totals and differences
Total equity 1,913 1,911 2 are calculated using unrounded
amounts.
Total Liabilities and Shareholders' Equity $ 5,281 $ 5,277 $ 4
Net debt / Total capital 36.7 % 37.3 %
27OCC: Official Board Market
1st Quarter: 2021 Vs. 2020 Vs. 2019
(Price/Ton)
1st Quarter 2nd Quarter 3rd Quarter 4th Quarter
J F M Avg A M J Avg J A S Avg O N D Avg
2019 85 75 65 75 50 40 35 42 35 35 35 35 35 35 35 35
2020 35 40 50 42 85 125 90 100 70 70 70 70 70 70 80 73
2021 85 85 90 87
28You can also read