The Global Electric Vehicle Market - Trends and outlook Nikolas Soulopoulos October 24, 2019

Page created by Randy George
 
CONTINUE READING
The Global Electric Vehicle Market - Trends and outlook Nikolas Soulopoulos October 24, 2019
The Global Electric
Vehicle Market
Trends and outlook

Nikolas Soulopoulos

October 24, 2019
The Global Electric Vehicle Market - Trends and outlook Nikolas Soulopoulos October 24, 2019
Strategies for a cleaner,
more competitive future

1   October 24, 2019
The Global Electric Vehicle Market - Trends and outlook Nikolas Soulopoulos October 24, 2019
There are now over 6 million
EVs on the road
million vehicles                                         Forecast
    8
                                                                       E-buses and trucks
    7
                                                                       RoW
    6

    5                                                                  South Korea

                                                                                            Passenger EVs
    4                                                                  Japan

    3
                                                                       North America
    2
                                                                       Europe
    1
                                                                       China
    0
     2012        2013      2014   2015   2016   2017   2018     2019
                                                                                  Source: BloombergNEF
2       October 24, 2019
The Global Electric Vehicle Market - Trends and outlook Nikolas Soulopoulos October 24, 2019
…BUT EVs are still only 2-4%
of sales in most markets
        8.0%
        7.0%
        6.0%
        5.0%
        4.0%
        3.0%
        2.0%
        1.0%
        0.0%
                Q1      Q2   Q3   Q4   Q1   Q2   Q3   Q4   Q1   Q2    Q3   Q4   Q1   Q2   Q3   Q4   Q1      Q2
                         2015                2016                2017                 2018           2019

               China               Europe             North America              Japan              Korea
Source: BloombergNEF
3    October 24, 2019
The Global Electric Vehicle Market - Trends and outlook Nikolas Soulopoulos October 24, 2019
The largest driver is still policy, but is
moving away from direct subsidies
    China                  Europe            U.S.

                           EU Parliament's       Corporate
        New Energy
                           CO2 emissions       Average Fuel
       Vehicle (NEV)
                               target         Economy (CAFE)
       credit system
                                                regulations

    Source: BloombergNEF

4       October 24, 2019
The Global Electric Vehicle Market - Trends and outlook Nikolas Soulopoulos October 24, 2019
China vehicle sales targets in
the 2025 auto plan
     Sales in millions                                                                                   7.0
                                                                0.7        1.1                    2.0
                                                     0.3
                                          0.1
                                                                                                                New Energy
                                                                                                                Vehicle (NEV)

                                                     28          28         28                    28     28
                                          24                                                                    Internal
                    22         23
         19                                                                                                     Combustion
                                                                                                                Engine (ICE)

       2012        2013       2014       2015       2016       2017       2018                  2020e   2025e
Source: MIIT, NDRC, BloombergNEF. Note: NEV target includes both passenger and commercial vehicles.

5     October 24, 2019
The Global Electric Vehicle Market - Trends and outlook Nikolas Soulopoulos October 24, 2019
More public EV charging
infrastructure is being installed
    Thousand outlets
      700
                                                                    RoW
      600

      500                                                           Japan

      400
                                                                    U.S.
      300

      200                                                           Europe

      100
                                                                    China
        0
                2012      2013   2014   2015   2016   2017   2018
Source: BloombergNEF

6      October 24, 2019
The Global Electric Vehicle Market - Trends and outlook Nikolas Soulopoulos October 24, 2019
Battery manufacturing
capacity will grow 3x by 2025
Battery manufacturing capacity – 2019                                   Battery manufacturing capacity – 2025
                         3%     1%                                                                11%
                              4%
                       7%

                                                                                          12%
                 12%
                              2019:                                                    1%             2025:
                              319GWh                                                     2%           1,111GWh

                                                                                                                         62%
                                                                                          12%
                                           73%

       China    U.S.     South Korea    Japan    Europe     Other              China    U.S.     South Korea     Japan     Europe   Other
Source: BloombergNEF Note: this is nameplate capacity and utilization   Source: BloombergNEF Note: this is nameplate capacity and utilization
may be lower                                                            may be lower

7     October 24, 2019
We expect battery prices to continue
to fall – below $100/kWh by 2024
    Lithium-ion battery pack price (real 2018 $/kWh)

           1,400

           1,200

           1,000

                                                                                                                                       Observed
             800                                                                                          2030 average                 prices
                                                                                                          lithium-ion battery
             600                                                     2024 average                         price: $62/kWh
                                                                     lithium-ion battery
                                                                     price: $94/kWh
             400                                                                              EV cost parity                           18%
                                                                                                                                       learning rate
             200

               0
                2010        2012         2014          2016   2018   2020        2022      2024       2026         2028         2030

Source: BloombergNEF. Note: Prices have been changed to real 2018 dollars

8       October 24, 2019
Price parity is coming
    Europe: pre-tax retail price for a medium-segment combustion vehicle vs. a BEV
          real 2018 thousand dollars and %
            40
            35     33%
            30
                              28%                                         Home charger
            25                         23%    20%    17%    15%    13%
                                                                          Battery
            20
                                                                          Powertrain
            15
                                                                          Vehicle
            10
                                                                          ICE
             5
             0
                   2018       2020     2022   2024   2026   2028   2030
Source: BloombergNEF 2019 EV Outlook

9     October 24, 2019
Passenger EVs hit 57% of new vehicle
sales globally in 2040
 Global long-term passenger vehicle sales by drivetrain
     Million vehicles
           100
                                                                        Internal combustion
            80

            60
                                                                        Plug-in hybrid

            40

                                                                        Battery electric
            20

             0
                 2015     2020   2025      2030           2035   2040
Source: BloombergNEF

10     October 24, 2019
Shared mobility takes a bite

     ●5%                                                           ●19%
     Proportion of all passenger                                   Proportion of all passenger
     kilometres done in shared                                     kilometres done in shared
     mobility in 2018                                              mobility in 2040

Source: BloombergNEF, Bloomberg Media Source, Didi, mytaxi, Uber
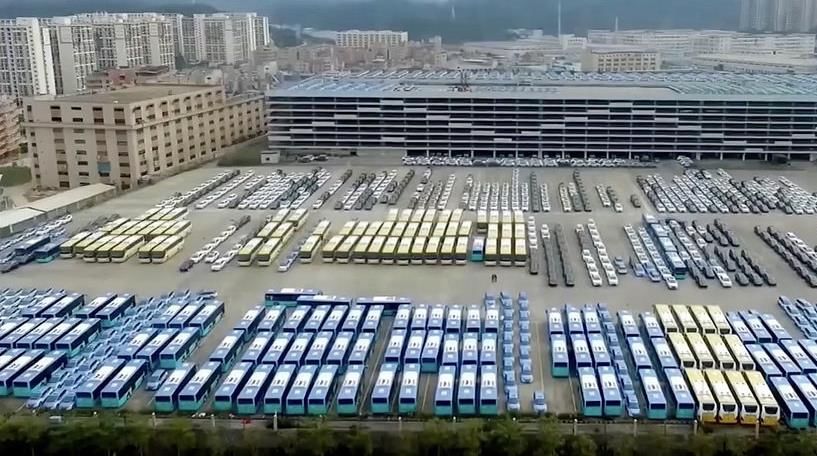
11     October 24, 2019
Buses go electric faster

12   October 24, 2019
Buses go electric faster
                                                                                                        European
                                                                                                        Union

                                                                                                              Oslo
                                                                                                                           Moscow
                              British
                              Columbia
                                                                                      Montreal
                                                         Minneapolis
                                   Seattle                                        Toronto
                                                                           NYC                                                                           Seoul
                              California
                                                                       Virginia                                                                               Tokyo
                                                                                                                                                     China
                       Honolulu                                                                                                                      Taiwan

                                           Mexico City                     Medellin                                             India                                 100% e-bus
                                                                                                                                                                       fleets by
                                                Costa Rica                                                                                                                2020

  Legend                                                   Quito                                                                          Malaysia

  National policy in place

  Regional policy in place                                   Chile
                                                                                            Rio de Janeiro
  Municipal policy in place
                                                                                                                                30+ “Fossil Fuel                  Auckland
  No major policy                                                                                              Cape Town          Free Street”
                                                                                                                                     cities

Source: BloombergNEF, Partnership on Sustainable Low Carbon Transport, governments, C40. Note: Note: Goals vary in terms of metrics and
scope. Only shows cities in places without regional or national policies. E-bus fleet target in China applies to major cities only. Not comprehensive.
13       October 24, 2019
Other segments can also
offer scale

Annual global
two-wheeler                              70 million
sales:

EV share:                                30%
Source: BNEF, various national sources. Image source: Niu

14    October 24, 2019
Commercial vehicles: light and medium go
      electric, heavy vehicles are harder

             Light commercial vehicles                         Medium commercial vehicles                           Heavy commercial vehicles
                      forecast                                          forecast                                            forecast
Million vehicles                                      Million vehicles                                    Million vehicles
 10                                                    0.7                                                1.4
                                                       0.6                                                1.2
  8
                                                       0.5                                                1.0
  6                                                    0.4                                                0.8
  4                                                    0.3                                                0.6
                                                       0.2                                                0.4
  2
                                                       0.1                                                0.2
  0                                                    0.0                                                0.0
           2020   2025    2030     2035    2040              2020     2025    2030     2035     2040               2020      2025     2030    2035   2040
                                                                                      0.0 Hydrogen
                                                                                      0.7
                                                                                      0.6
                                                                                      0.5
                                                                                      0.4
                                                                                      0.3
                                                                                      0.2
                                                                                      0.1
      Source: BloombergNEF Note: Sales correspond to the U.S., Europe and China only Million vehicles    Electric      Natural gas       Diesel
                                                                                                2020    2025        2030       2035       2040
      15      October 24, 2019
Impacts
Electricity demand, emissions and risks

16   October 24, 2019
Looking ahead: impact on
electricity markets is varied
TWh
                                                                                               Share of total
                                                                                      9%
 45,000

 40,000                                                                                        global electricity
 35,000
                                                                                               demand by 2050
 30,000

 25,000
                                                                           Electric vehicles
 20,000                                                                    Air conditioning

 15,000                                                                    Net demand

 10,000

  5,000

      0
       2012       2019      2025     2030      2035   2040   2045   2050

Source: BloombergNEF New Energy Outlook 2019

17    October 24, 2019
Oil-demand outlook
Demand declines by 1.4MMbd combined
                                                   Light and heavy-duty vehicles
                  MMbd                               Demand projection assuming
                                                                                                                Demand reduced
                   60                                no alternative drive trains or fuel                        due to FE
                                                     economy improvements                         -9.9MMbd
                                                                                                                improvements

                   50                                                                             -14.5MMbd
                                                                                                                Demand reduced due to
                                                                                                                alternative drive trains
                                                                                                                and shared mobility
                   40
                                                   Diesel
                   30

                   20

                   10
                                                   Gasoline                                                              LDV
                                                                                                                         HDV

                    0
                     2018 2020                2025                  2030                   2035               2040
Source: BloombergNEF. Note: Excludes buses, two and three wheelers

18    October 24, 2019
Thank you
            Find the public executive summary of BNEF’s “Long-Term Electric Vehicle Outlook 2019”
            at about.bnef.com and the full report on the Bloomberg Terminal

Source: BloombergNEF

19   October 24, 2019
Copyright and disclaimer
Copyright
© Bloomberg Finance L.P. 2019. This publication is the copyright of Bloomberg Finance L.P. in connection with BloombergNEF. No portion of this document may be
photocopied, reproduced, scanned into an electronic system or transmitted, forwarded or distributed in any way without prior consent of BloombergNEF.
Disclaimer
The BloombergNEF ("BNEF"), service/information is derived from selected public sources. Bloomberg Finance L.P. and its affiliates, in providing the
service/information, believe that the information it uses comes from reliable sources, but do not guarantee the accuracy or completeness of this information, which is
subject to change without notice, and nothing in this document shall be construed as such a guarantee. The statements in this service/document reflect the current
judgment of the authors of the relevant articles or features, and do not necessarily reflect the opinion of Bloomberg Finance L.P., Bloomberg L.P. or any of their
affiliates (“Bloomberg”). Bloomberg disclaims any liability arising from use of this document, its contents and/or this service. Nothing herein shall constitute or be
construed as an offering of financial instruments or as investment advice or recommendations by Bloomberg of an investment or other strategy (e.g., whether or not
to “buy”, “sell”, or “hold” an investment). The information available through this service is not based on consideration of a subscriber’s individual circumstances and
should not be considered as information sufficient upon which to base an investment decision. You should determine on your own whether you agree with the
content. This service should not be construed as tax or accounting advice or as a service designed to facilitate any subscriber’s compliance with its tax, accounting or
other legal obligations. Employees involved in this service may hold positions in the companies mentioned in the services/information.
The data included in these materials are for illustrative purposes only. The BLOOMBERG TERMINAL service and Bloomberg data products (the “Services”) are
owned and distributed by Bloomberg Finance L.P. (“BFLP”) except (i) in Argentina, Australia and certain jurisdictions in the Pacific islands, Bermuda, China, India,
Japan, Korea and New Zealand, where Bloomberg L.P. and its subsidiaries (“BLP”) distribute these products, and (ii) in Singapore and the jurisdictions serviced by
Bloomberg’s Singapore office, where a subsidiary of BFLP distributes these products. BLP provides BFLP and its subsidiaries with global marketing and operational
support and service. Certain features, functions, products and services are available only to sophisticated investors and only where permitted. BFLP, BLP and their
affiliates do not guarantee the accuracy of prices or other information in the Services. Nothing in the Services shall constitute or be construed as an offering of
financial instruments by BFLP, BLP or their affiliates, or as investment advice or recommendations by BFLP, BLP or their affiliates of an investment strategy or
whether or not to “buy”, “sell” or “hold” an investment. Information available via the Services should not be considered as information sufficient upon which to base an
investment decision. The following are trademarks and service marks of BFLP, a Delaware limited partnership, or its subsidiaries: BLOOMBERG, BLOOMBERG
ANYWHERE, BLOOMBERG MARKETS, BLOOMBERG NEWS, BLOOMBERG PROFESSIONAL, BLOOMBERG TERMINAL and BLOOMBERG.COM. Absence of
any trademark or service mark from this list does not waive Bloomberg’s intellectual property rights in that name, mark or logo. All rights reserved. © 2019 Bloomberg.
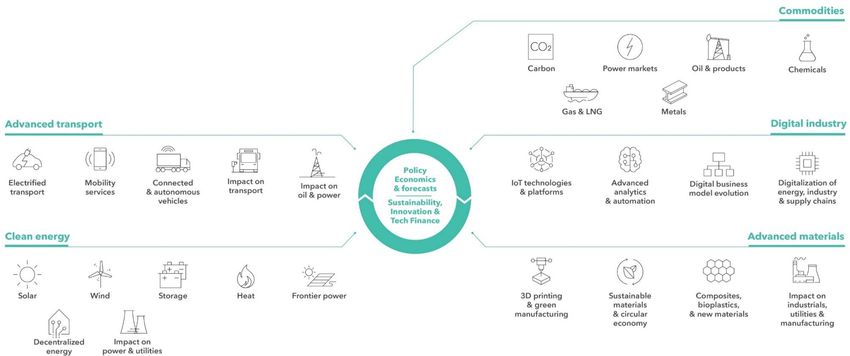
20     October 24, 2019
BloombergNEF (BNEF) is a leading provider
of primary research on clean energy,
advanced transport, digital industry,
innovative materials, and commodities.

BNEF’s global team leverages the world’s
most sophisticated data sets to create clear
perspectives and in-depth forecasts that
frame the financial, economic and policy
implications of industry-transforming trends
and technologies.

BNEF research and analysis is accessible via
web and mobile platforms, as well as on the
Bloomberg Terminal.

Coverage.
Clean energy
Advanced transport
Commodities                                    Nikolas Soulopoulos
Digital industry                               nsoulopoulos@bloomberg.net
                                               Client enquiries:
                                               Bloomberg Terminal: press  key twice
                                               Email: support.bnef@bloomberg.net

                                               Learn more:
                                               about.bnef.com | @BloombergNEF
You can also read