Connected Consumer Survey 2019: mobile customer satisfaction and churn in Australia and New Zealand - Analysys Mason
←
→
Page content transcription
If your browser does not render page correctly, please read the page content below

Connected Consumer Survey 2019: mobile customer satisfaction and churn in Australia and New Zealand

                Connected Consumer Survey
                2019: mobile customer
                satisfaction and churn in
                Australia and New Zealand

                Rémy Pascal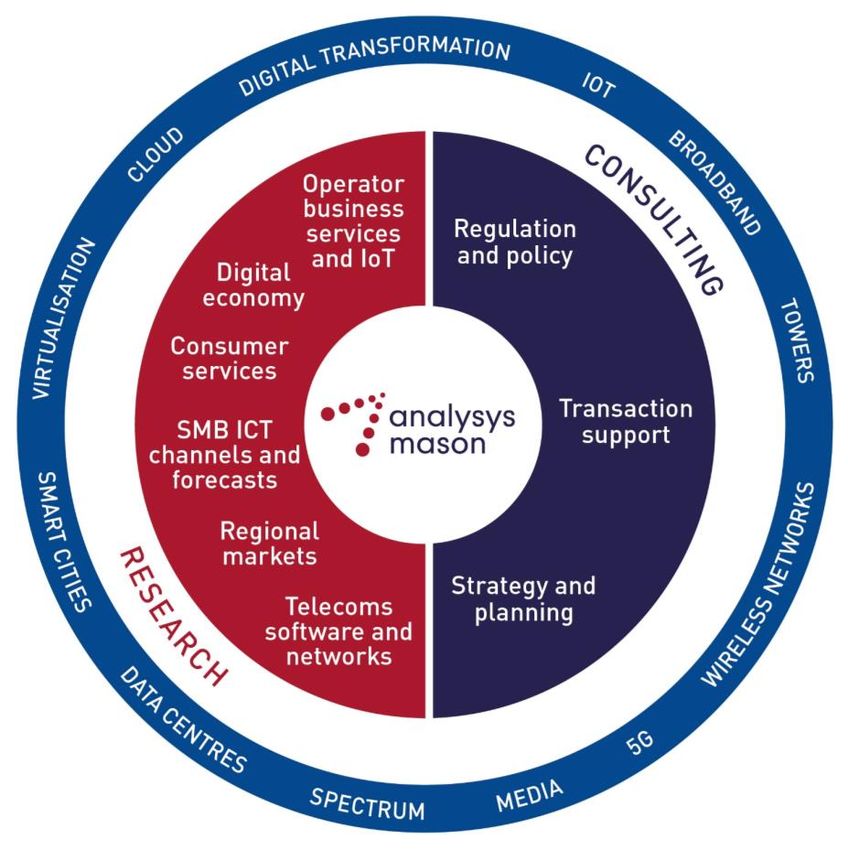
Connected Consumer Survey 2019: mobile customer satisfaction and churn in Australia and New Zealand                                                                         2

About this report

This report focuses on aspects of Analysys Mason’s Connected                                                       GEOGRAPHICAL COVERAGE
Consumer Survey that relate to the behaviour, preferences and
                                                                                              Developed Asia–Pacific (DVAP):
plans of smartphone users in Australia and New Zealand (ANZ). In
particular, it focuses on customer satisfaction, churn and                                    ▪ Australia
retention-related aspects of mobile services.                                                 ▪ New Zealand

The survey was conducted in association with Dynata between
July and August 2019. The survey groups were chosen to be
representative of the mobile-internet-using population in the
region. We set quotas on age, gender and geographical spread to
that effect. There were a minimum of 1000 respondents per
country, and 2000 in the region.

             KEY QUESTIONS ANSWERED IN THIS REPORT                                                             WHO SHOULD READ THIS REPORT

 ▪ What are the drivers of mobile customer experience? How do they vary                       ▪ Operators’ strategy executives and marketing managers who are
   by country and by operator?                                                                  interested in understanding the needs of their consumer customer base,
 ▪ What key factors influence consumers’ intention to churn? How have                           the different drivers of customer experience and the impact of differing
   consumers’ priorities evolved?                                                               approaches to pricing on customer satisfaction.

 ▪ What are the Net Promoter Scores (NPSs) of operators in Australia and                      ▪ Market intelligence and research executives in service providers that are
   New Zealand? Which companies lead and why?                                                   responsible for understanding end-user trends and supporting business
                                                                                                units in identifying and addressing new opportunities.
 ▪ What is the effect of bundling additional services on customer retention?
   How do new service-based pricing models affect KPIs?                                       ▪ Equipment/device manufacturers and software providers that want to
                                                                                                identify end-user trends in service and device usage and help their
 ▪ What is the relationship between customer service and customer                               operator customers to prioritise investments and improve their ability to
   satisfaction?                                                                                address market opportunities.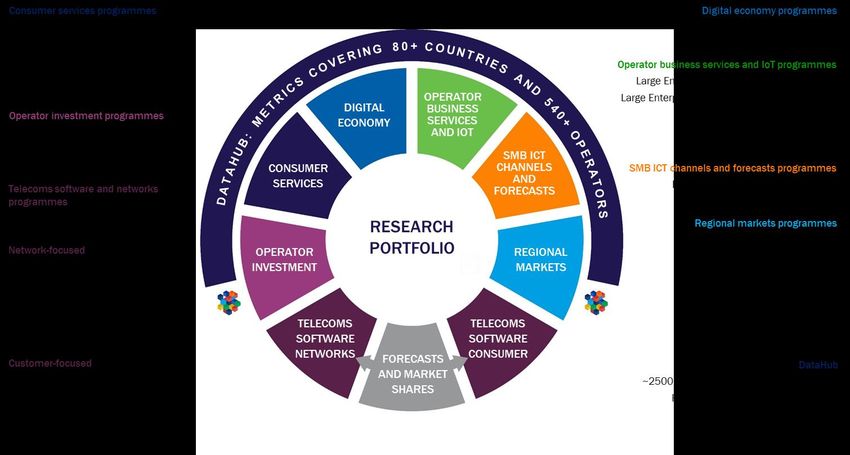
Connected Consumer Survey 2019: mobile customer satisfaction and churn in Australia and New Zealand                                                        7

Vodafone Australia and Spark lead in terms of NPS; most operators in ANZ have
improved their scores since last year
Respondents were asked to rate how likely they were to                                      Figure 2: Net Promoter Score for mobile operators, Australia
recommend their mobile operator on a scale of 0 (not at all likely)                         and New Zealand 1
to 10 (definitely). The NPS is calculated by subtracting the
percentage of subscribers that rated their operator 6 or below
(detractors) from the percentage that rated it 9 or 10 (promoters).
NPSs reflect consumers’ overall satisfaction with their operators.
The best-performing mobile providers (in terms of NPS) were
Spark (+20.2) and 2degrees (+20.1) in New Zealand and                                       Australia
Vodafone in Australia (+11.9). Five of the six main operators in
ANZ improved their score between 2018 and 2019.
The gap between operators in Australia has decreased, and all
three operators now have very similar NPSs. Vodafone received
the lowest score in 2018, but was in first place in 2019 (with an
increase of 17.7 points). Telstra also significantly improved its
score (+12.0 points since 2018). Optus received the lowest NPS,
but its score was still higher than that in 2018 (by 1.1 point).                          New Zealand

Spark’s score increased the most out of all operators in New
Zealand (+24.4 points since 2018, and it became the NPS leader
with a slim lead over 2degrees (whose score increased by 4.8
points since 2018). Vodafone New Zealand was the only operator
in the region with a negative NPS (–4.4) and the only one with a
lower NPS in 2019 than in 2018 (–3.4 points) due to issues with
price and customer service.

1   Please refer to the appendix for sample size and relevant survey questions.

Connected Consumer Survey 2019: mobile customer satisfaction and churn in Australia and New Zealand                                                                                   8

Price and customer service continue to bring down the levels of satisfaction in
Australia
Australian operators improved their satisfaction scores in                                                 Figure 3: Average customer satisfaction scores for different
2019.                                                                                                      elements of the mobile service, by operator, Australia 1,2
We asked respondents how satisfied they were with specific
elements of their mobile services.1 The highest levels of                                                                                  Telstra   Optus          Vodafone
satisfaction were for voice and SMS allowances; this is not
surprising as large and unlimited allowances are commonplace in                                              Overall                        4.1       4.0               4.1
ANZ. The lowest satisfaction ratings were for price and customer
service, as in 2018. Vodafone led in most categories except                                                  Call/SMS
                                                                                                                                            4.2       4.1               4.2
network coverage and data speeds, where Telstra dominated.                                                   allowance
Telstra improved its scores in all categories but price. Its plans                                           Network
tend to be expensive given the company’s premium positioning,                                                                               4.2       3.9               4.0
                                                                                                             coverage
but its customer service satisfaction does not meet the high
expectations. Optus’s scores were roughly identical to those from                                            Data speed                     4.1       3.9               4.0
last year, but its competitors have made improvements meaning
that Optus has lost its edge, particularly for allowances.                                                   Data allowance                 3.9       3.9               4.1
Vodafone’s investment in network performance has paid off.
                                                                                                             Price                          3.7       3.9               4.0
Australian customers were, on average, reasonably satisfied with
their network performance. Telstra maintained its lead, but
Vodafone significantly improved its network coverage, which was                                              Customer service               3.7       3.8               4.0
one if its key weaknesses last year. For Vodafone’s customers,
network coverage moved from being the second-most commonly                                                                                                   Source: Analysys Mason

cited reason to churn in 2018 (40% of churners) to the fifth most-
commonly cited reason in 2019 (16% of churners). Vodafone
expanded its coverage with new sites and capacity during 2019
by refarming its 2100MHz spectrum.
1   Respondents rated their satisfaction on a scale of 1 to 5, where 1 is ‘very dissatisfied’, 3 is ‘neutral’ and 5 is ‘very satisfied’.
2   Please refer to the appendix for sample size and relevant survey questions.
Connected Consumer Survey 2019: mobile customer satisfaction and churn in Australia and New Zealand

               Contents                            Executive summary

                                                   Drivers of customer satisfaction and churn

                                                   Focus on plans and pricing

                                                   Focus on digital experience

                                                   Methodology and panel information

                                                   About the author and Analysys Mason
Connected Consumer Survey 2019: mobile customer satisfaction and churn in Australia and New Zealand                                                               29

About the author

                       Rémy Pascal (Senior Analyst) joined Analysys Mason’s Asia–Pacific research team in August 2018 and is based in the Singapore office. He also
                       contributes to other research programmes including those in the Consumer Services research practice. Rémy has more than 8 years of
                       experience in the telecoms and ICT sectors. Before joining Analysys Mason, Rémy worked in various market intelligence positions at Samsung
                       Electronics’ Networks Business in South Korea, Orange in France and the French Trade Commission in South Korea and Taiwan. Rémy holds a
                       master’s degree in management from Rouen Business School in France.
Connected Consumer Survey 2019: mobile customer satisfaction and churn in Australia and New Zealand 30
Analysys Mason’s consulting and research are uniquely positioned
Analysys Mason’s consulting services and research portfolio Consulting
We deliver tangible benefits to clients across the telecoms
industry:
▪ communications and digital service providers, vendors,
financial and strategic investors, private equity and
infrastructure funds, governments, regulators, broadcasters
and service and content providers
Our sector specialists understand the distinct local challenges
facing clients, in addition to the wider effects of global forces.
We are future-focused and help clients understand the challenges
and opportunities new technology brings.
Research
Our dedicated team of analysts track and forecast the different
services accessed by consumers and enterprises.
We offer detailed insight into the software, infrastructure and
technology delivering those services.
Clients benefit from regular and timely intelligence, and direct
access to analysts.Connected Consumer Survey 2019: mobile customer satisfaction and churn in Australia and New Zealand 31 Research from Analysys Mason
Connected Consumer Survey 2019: mobile customer satisfaction and churn in Australia and New Zealand   32

Consulting from Analysys Mason
Connected Consumer Survey 2019: mobile customer satisfaction and churn in Australia and New Zealand

                 PUBLISHED BY ANALYSYS MASON LIMITED IN JANUARY 2020
                 Bush House • North West Wing • Aldwych • London • WC2B 4PJ • UK
                 Tel: +44 (0)20 7395 9000 • Email: research@analysysmason.com • www.analysysmason.com/research • Registered in England and Wales No. 5177472
                 © Analysys Mason Limited 2020. All rights reserved. No part of this publication may be reproduced, stored in a retrieval system or transmitted in any form or by any means – electronic,
                 mechanical, photocopying, recording or otherwise – without the prior written permission of the publisher.
                 Figures and projections contained in this report are based on publicly available information only and are produced by the Research Division of Analysys Mason Limited independently of any
                 client-specific work within Analysys Mason Limited. The opinions expressed are those of the stated authors only.
                 Analysys Mason Limited recognises that many terms appearing in this report are proprietary; all such trademarks are acknowledged and every effort has been made to indicate them by the
                 normal UK publishing practice of capitalisation. However, the presence of a term, in whatever form, does not affect its legal status as a trademark.
                 Analysys Mason Limited maintains that all reasonable care and skill have been used in the compilation of this publication. However, Analysys Mason Limited shall not be under any liability for
                 loss or damage (including consequential loss) whatsoever or howsoever arising as a result of the use of this publication by the customer, his servants, agents or any third party.
You can also read