"Photovoltaics: Current Trends & Vision to 2030" - ICTP

Page created by Roberto Chan
 
CONTINUE READING
"Photovoltaics: Current Trends & Vision to 2030" - ICTP
The Abdus Saiam
            International Centre for Theoretical Physics
                                                                                                                      g>

ICTP Experts Meeting on "Science & Renewable Energy"
              January 15 - 18, 2007
      Venue: ICTP Adriatico Guest House - Lundqvist Lecture Hall
                                                                                                        310/1905

                          "Photovoltaics:
                 Current Trends & Vision to 2030"

                                          F. Ferrazza
                                      EniTechnologies Spa
                                          Rome, Italy

Stratfa Ctxiiera It. 34011 Trieste. Italy - Tel. +3* 040 2240 I I I; Fax +39 040 214 l63-scMnlo@ittp.ii.www.icrp.it
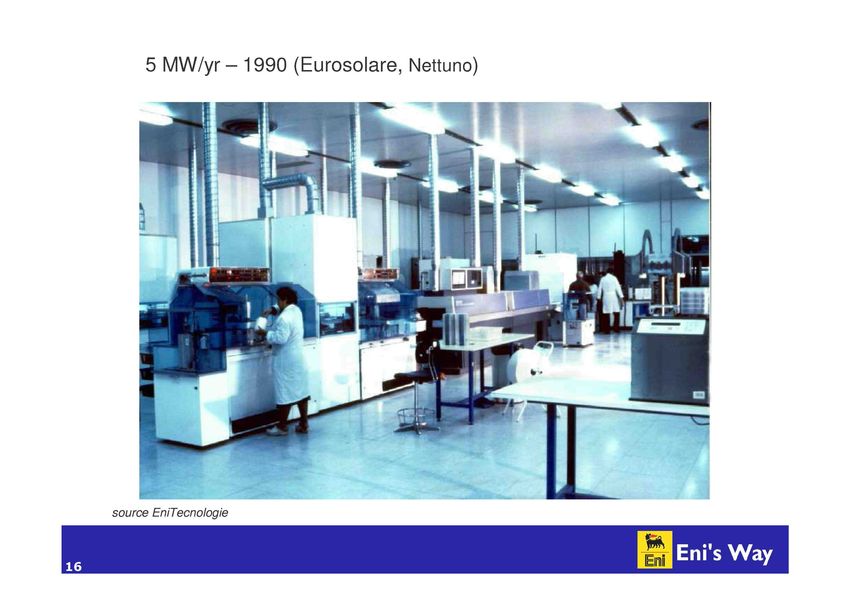
"Photovoltaics: Current Trends & Vision to 2030" - ICTP
Photovoltaics:
            current trends and vision to 2030

                            F.Ferrazza
                 Eni S.p.A., P.le E. Mattei I, Italy

francesca.ferrazza@eni.it
"Photovoltaics: Current Trends & Vision to 2030" - ICTP
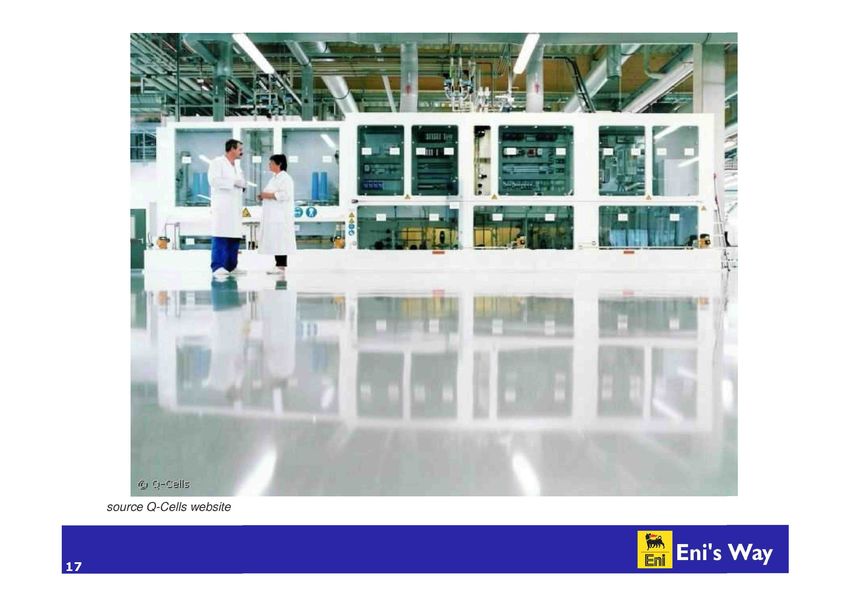
Module worldwide production

                                                     • Resto del Mondo •Europa BGiappone • Stali Uniti nTotale
      CAGR 2000-2004: > 40%

                      90    91   92        93        94    95       96       97    98       99    00       01    02        03        04        05

                                      90        91    92       93       94    95       96    97       98    99       00    01        02        03        04   05

               Resto del Mondo          5                        4        6        6    10   c 19 21 23 33 56                                   84 139 150
                   Europa              10        13       16    17       22       20    19 30 34 40 61 86 135                                  193 314 350
                  Giappone             17        20       19    17       17       16    21 35 49 80 129 171 251                                364 602 800
                  Stati Uniti          15        17       18    22       26       35    39 51 54 61 75 100 121                                 103 139 150
                    Totale             47        55       58    60       69       78    89 126 155 201 288 390 562                             744 1194 1450

                Crescita annua    (%)            19                 4    15       12    14       42    23       30    43        36        44        32    60 21

Fonte: EU COMMISSION PV STATUS REPORT2005
"Photovoltaics: Current Trends & Vision to 2030" - ICTP
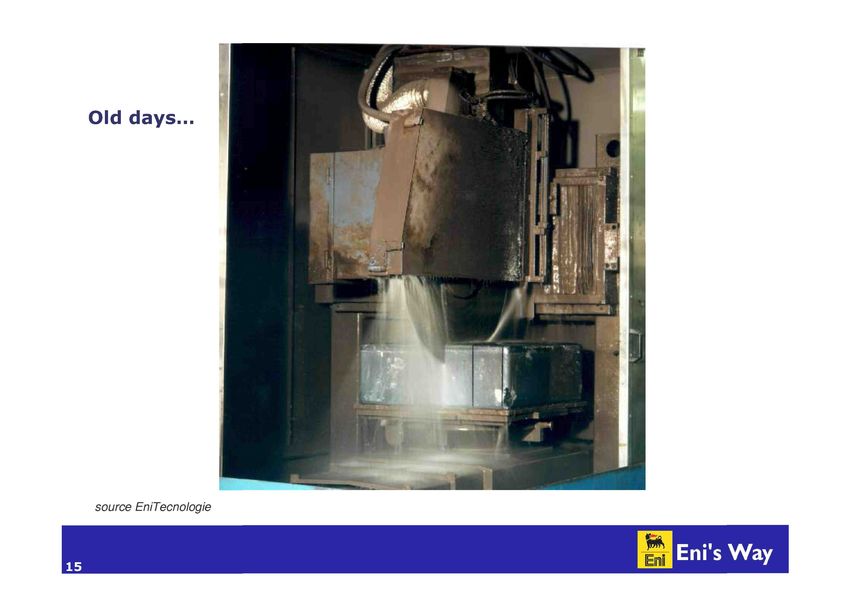
Cumulative installed power

                              1992 1993 1994 1995 1996 1997 1998 1999 2000 2001 2002 2003 2004 2005 2006 2007

Source: IEA REPORT PVPS t1-14 2005
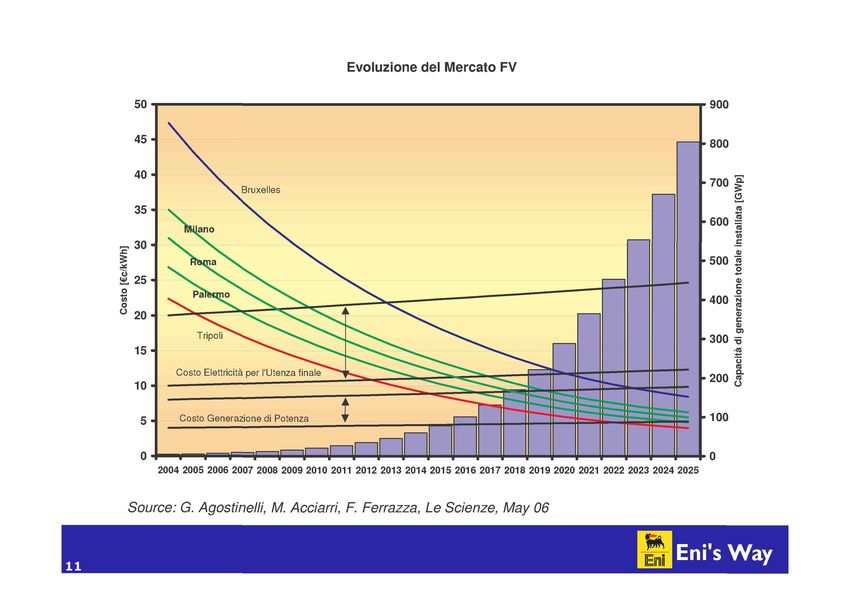
"Photovoltaics: Current Trends & Vision to 2030" - ICTP
Top Players

                 Altri operatori

                                     Mitsubishi

        Gruppo attivo nel settore:                Societa specializzata
                  elettronica                     nel fotovoltaico
            __ Oil&Gas                    * Nel 2006 Shell Solar ha venduto gran
                  vetro                    parte dei suoi impianti a SolarWorld
                                           (Germania, specializzata nel fotovoltaico)
"Photovoltaics: Current Trends & Vision to 2030" - ICTP
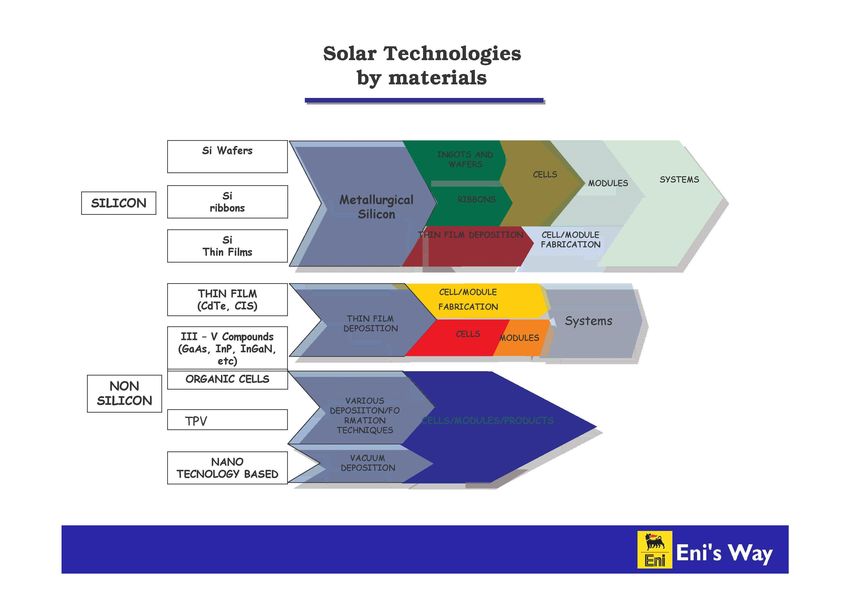
Energy pay-back time can be less than two years

        Localita              Parametro             Tetto       Facciata
                                                 (inclinato)   (verticale)
         Roma            Produzione annua, kWh     1.300          860
                              EPBT,mesi              23            35

   (1.552 kWh/m2/anno)    Fattore di ritorno         14             9
                             energetico
        Milano           Produzione annua, kWh     1.000          680
                             EPBT, mesi              30           44

   (1.251 kWh/m2/anno)    Fattore di ritorno         11             7
                             energetico
"Photovoltaics: Current Trends & Vision to 2030" - ICTP
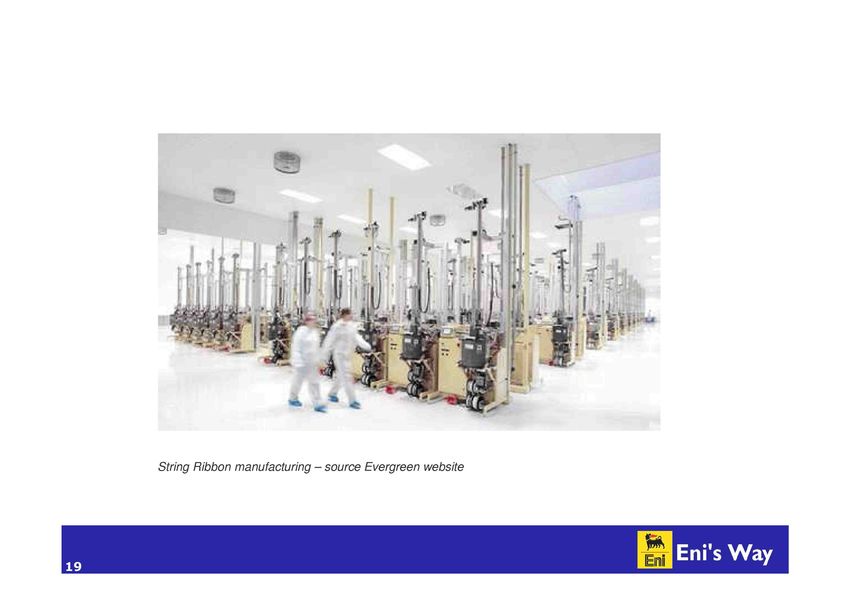
Energy Pay-Back Time of PV systems
                           (grid-connected, roof-top PV system:
                                 irradiation 1700 kWh/niZyr)

    3
I

     1
"Photovoltaics: Current Trends & Vision to 2030" - ICTP
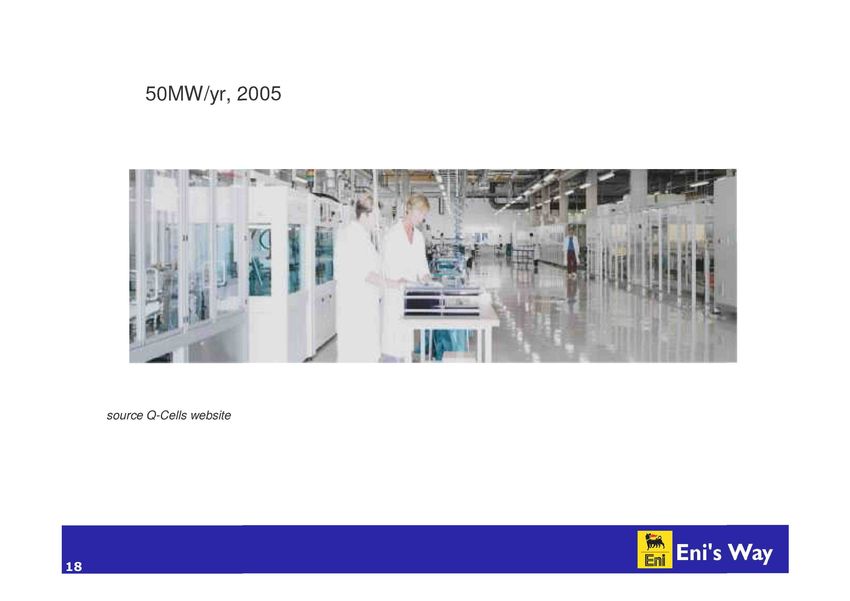
Solar is a minor player in the global energy sector

                Gas                                     Altre
               21.2%                                     0.5%                 Maree 0.0005%
                             N ucleare                                ]   |   Eolico 0.051%
                              6.5%                 Idroeletrico2.2%           Solare 0.039%

                                                   Biomassa
 Petrolio                            Rinnovabili   combustibile
34.4%                                                                         Geotermico
                                                   e rifiuti                    0.416%

                                                         10.6%

                       Carbone
                       24.4%
"Photovoltaics: Current Trends & Vision to 2030" - ICTP
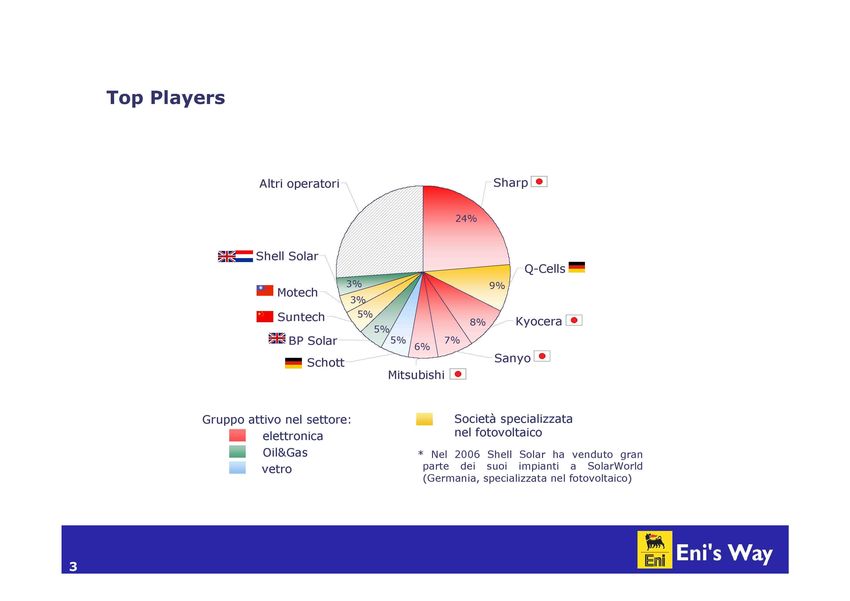
Market is strongly regional-based

       2003                              2004                          2005
       • Germani a Resto d'Europa • Giappone • USA   Resto del Mondo
"Photovoltaics: Current Trends & Vision to 2030" - ICTP
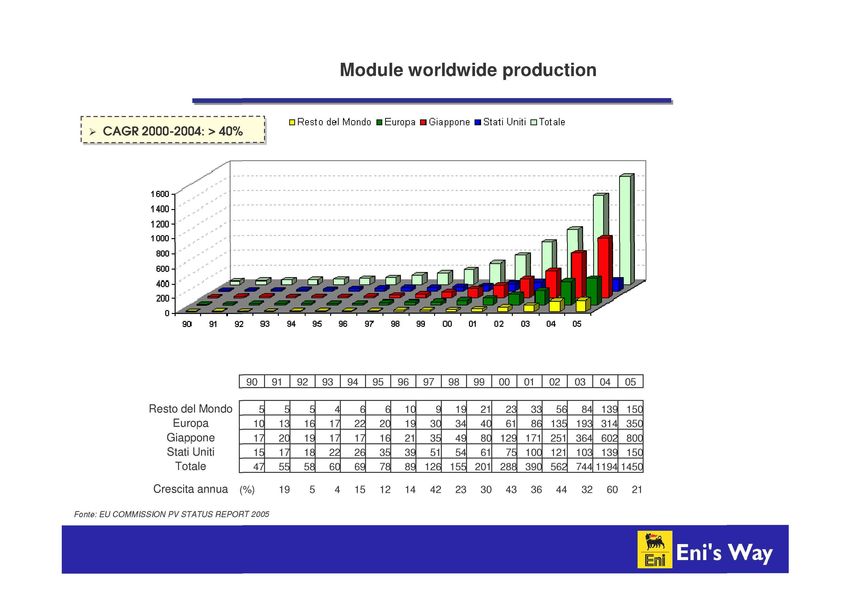
Solar in general is more expensive than conventional fossil
                    fuel based electricity

                                                            prezzo al
                                                     8-20   consumo nei
                                                            paesi OCSE

          Fonti       Fotovoltaico       Solare
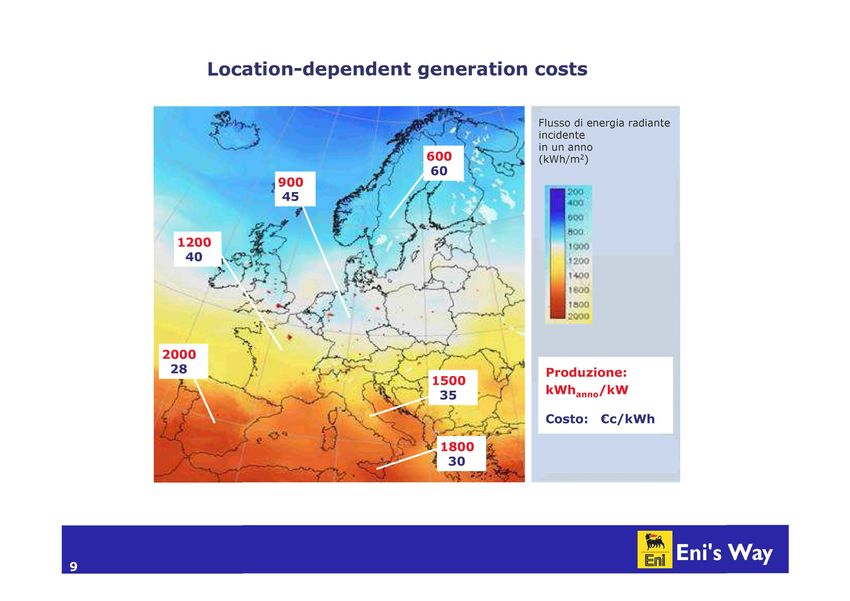
      convenzionali                  termodinamico
Location-dependent generation costs

                              Flusso di energia radiante
                              incidente
                              in un anno
                              (kWh/m 2 )

                                   I TOO

                                   HO

                                   !12001

                               Produzione:
                               kWh anno /kW

                               Costo: €c/kWh
Price Learning curve
     100

0)
o

O
      10
Q.
                 20% price decrease
                 by doubling
                 cumulative volume
                 until 2003

           0,1                10         100     1000   10000   100000
                                   MWp accumulated
 source EPIA website
Evoluzione del Mercato FV

                                                                                                                         900

            Costo Elettricità per l'Utenza finale

             Costo Generazione di Potenza

                               y—y—y                IT!
         2004 2005 2006 2007 2008 2009 2010 2011 2012 2013 2014 2015 2016 2017 2018 2019 2020 2021 2022 2023 2024 2025

     Source: G. Agostinelli, M. Acciarri, F Ferrazza, Le Scienze, May 06

11
                                                                                                         El
                                                                                                         •ill Eni •s Way
Market by technology
source JRC PV Status report 2005,
Photon International..

               1985 1986 1987 1988 1989 1990 1991 1992 1993 1994 1995 1996 1997 1998 1999 2000 2001 2002 2003 2004 2005

                                       Cz-Si       mc-Si     • Si-Ribbon       a-Si       CdTe        CIS
C-Si share of the PV market
Solar Technologies
                                    by materials

              Si Wafers

                                                                                MODULES   SYSTEMS
                   Si
SILICON         ribbons

                                                                        CELL/MODULE
                  Si                                                    FABRICATION
              Thin Films

             T H I N FILM                        CELL/MODULE
             (CdTe. CIS)                         FABRICATION
                                                                            Systems
           I I I - V Compounds                      CELL       ODULES
          (GaAs. InP, InGaN.
                    etc)

  NON
SILICON
                                 DEPOSIITON/FO
                                   RMATION
                                  TECHNIQUES

          TECNOLOSy BASED
Old days...

source EniTecnologie
5 MW/yr - 1990 (Eurosolare, Nettuno)

source EniTecnologie
, « .           H

source Q-Cells website
50MW/yr, 2005

source Q-Cells website
I t\tt              •

String Ribbon manufacturing - source Evergreen website
Long-term outlook

                                                                     Indicative figures what could
200,000
                                                                     be the demand for Si by 2020:
                 PVS gxnith scenario 27%
                 PVSgx3wthscenario15%

150,000          rejected
                 excess capacity eg-Si
                                                                     • growth to 45 GWp;
                 dedicated non-prime

100,000
                                                                     • c-Si 70% of PV production;
 50,000

                                                                     • Si consumption 5 g/Wp or
          1995      2000          2005
                                         year
                                                2010   2015   2020
                                                                     less;
                                                                        Si demand ~105 tons/a
Silicon price strongly affects cell costs

                    Cost of silicon

     1,20

     1,00
                                                11,5 T/MW
     0,80
                                                10,5
     0,60                                       7
                                                5
I    0,40                                       03

     0,20

     0,00
            10                          100
                 feedstock price €/kg
Silicon feedstock production chain

Quarzite           Chemical   SiCl4                    SiHCl3   Thermal
                                        Purification
           MG-Si   Reaction   SiHCl3                            Decomposition
                                        Conversion
   Coke            HCI        SiH2Cl2                  SiH4     CVD
SOLSILC process
Carbon removal/solidification

Si (liquid)

              precipitate
                                     purge
                            decant           Directional
                                             Solidification (DS)
                                                 I
Silicon Feedstock Demand

       35'000
                                                                                             30'000
       30'000
                                              Shortage!                             25'000
       25'000                                                              22'000
   ^ 20'000                                                       17'000
   £                                    14'
       15'000
                      10'416
       10'000
         5'000
                0
                         2003             2004      2005   2006     2007     2008     2009     2010

Fonte: Workshop EPIA 22nd of December
Price learning curve

                                                                   10 0

                                                                                               History
       10               Forecast
                                                                           20% price decrease
                                                                           by doubling
                                                                           cumulative volume
                                  EPIA Price Scenario                      until 2003

                                                                     0,1         1      10         100     1000      10000   100000
                                                                                             MWp accumulated

  E                                                                                  experience f actor"
I                                                                                                 15%
f I
                                                                                                               18%
                      1,1 GWp/a        3,3 GWp/a        31 GWp/a                     300 GWp/a
                         2004             2010            2020                          2030

        0
                                  10               100                        1000                                10000
source EPIA website                         GWp accumulated
Discrete and fragile,

   source EPIA website
relatively low efficiency

source EPIA website
The challenges                                                hoto oltaic
                                      1000 GWp globally
                                 200 GWp in EU (200,000 jobs)

            BOS = Bal a nce-Of-System

                                                                    A Vision far
               typical 4-                                          Photovoltaic
                                                                   Technology
              turn-key 3
               system
                price 2
               (€/Wp) -i
                        0
                            2004 2010 2020 2OJ0 2050
                                         year

                        competing
                                                 f
                                                competing
            consumer & peak prices              wholesale prices

source W. Sinke, PV
Platform GA
possible evolution of module
H   price & performance

                                     tf-Si = thin-film silicon
                                        CIGSS = copper-
                                         indium/gallium-
                                         selenium/sulfur
                                        c-Si = wafer-type
                                        crystalline silicon
                                      OSC = "organic" solar
                                                cells
                                        new concepts =
                                      advanced versions of
                                      existing technologies
                                        & new conversion
                                             principles

                                     (free after
                                     W. Hoffmann)

           10         15   20   25
        module efficienc
Tecnology eviution map

                                   ' m u It ij unctionfconcentiatoi
                                    cells
                                   •wafer crystalline Si cells

                                   •thin-film CIGS cells

                                   thin-film CdTe cells

                                   •thin-film amorphous Si
                                    cells
                                   •wafer crystalline Si
                                    modules
                                    GIGS modules

                                   amorphous Si modules

                                   •dye-sensitized cells
                                    (typical)
                            year    organic cells (typical)

  source G. Agostinelli,
  Imec, Crystal Clear ,..
Progress of the overall PV sector

    Some important research issues are shared
    > efficiency, stability and lifetime
    > materials use (quality & quantity)
    > high-throughput      manufacturing
    > in-process monitoring & control
    > environmental sustainability

source W. Sinke, WG3
PV Platform
Efficiency is an important driver
Cost reductions + increased efficiency + higher productivity + lower EPBT +.

                               direct costs

     2,5

       2

      1,5                                                          module
                                                                   cel
        1                                                          wafer

      0,5

       0
              2005          2013         2020         2030
> Wafer-based crystalline silicon

         high efficiency
         low overall silicon consumption
         feedstock quality / cost optimum
         low-cost encapsulation materials and
         module concepts

source W. Sinke, WG3
PV Platform
Silicon consumption reduction as a first measure for cost reduction
Thin!

Thin RGS ribbon - source ECN website
Thin and efficient!

                 Highly diiciwYl TjaLi cell an
                 thin aid UraiUe wafer (dD \im\. The cdh
                       producrd whh LK
source FHG-ISE
website
New thin film manufacturing facility - silicon on glass

    Csg solar, Germany
Concentrators - new initiatives

               solar radiation

                                      lens F

                                  solar cell F

              heat transport         Concentrix Solar GmbH (D)

                                       www.concentrix-solar.de
High efficiency multijunction cells for space applications

Spectrolab's record cells > 4 0 % efficient!
The Silicon shortage has

- contributed to bump in price learning curve

But has also

- allowed faster reduction of silicon specific consumption
- induced faster progress in automation
- opened a window of opportunities for other technolgies:

• Thin Films-ALL
• Concentrators
• Organic

Many initiatives under way. Thin film production may be as
high as 1 GW in 2010
Technology mix in time - evolutionary scenario

 100%

  90%                           -     -

  80%

  70%

  60%
                                                  • New Concepts
  50%                                             • Thin Film
                                                  • c-Si
  4 0%

  30%

  2 0%

  10%

   0%
         2006    2010               2020   2030
                        yea r
Conclusions - 1

Progress in silicon wafer-based technology with time has determined the price-
learning curve of PV modules that shows a decrease of about 20% for each
doubling of capacity.
This progress has two driving forces: market size and technological
improvement.
This did not happen by chance but is the result of the combination of market
assisting measures and research, development and demonstration activities with
both private and public support.

Crystalline silicon based technology has the capability to continue following the
established price experience curve, with direct production costs expected to
achieve significant reduction to around 1.00 €/W in 2013 and 0,75 €/W in 2020
and even lower in the long term.

This will happen if R&D effort is directed to address the most critical issues and
the technology areas most likely to allow a continued progress of PV towards full
sustainability.
Conclusions - 2

In the long term, it is expected that silicon technology will still play an important
role in the PV sector, although there is uncertainty regarding the precise module
efficiency, the silicon consumption, the cell and module architecture and
component materials after 2020, when the market size is expected to be around
30 GW/year.

It is likely that silicon technology by this time will have incorporated aspects
which are now related to novel or emerging technologies, and that new materials
will also be included in the processing sequences.

In the long run, true distinctions between wafer and thin film technologies and
between cells and modules may no longer be appropriate.

In the long term, it is expected that module efficiency will exceed the current
laboratory record.
This may only be possible by incorporating technologies at the periphery of the
device such as up or down converters. For this reason, basic and applied
research on advanced concepts and materials should be included in crystalline
silicon projects.
•

      hotovoltciic
TECHNOLOGY PLATFORM

   www.eupvplatform.org

           Thank you!
You can also read