HYDROGEN KEY DRIVERS, OPPORTUNITIES AND NEL'S POSITION IN THE MARKET - AksjeNorge
←
→
Page content transcription
If your browser does not render page correctly, please read the page content below

HYDROGEN
                         KEY DRIVERS, OPPORTUNITIES AND NEL’S
                                POSITION IN THE MARKET

Bjørn Simonsen
VICE PRESIDENT INVESTOR RELATIONS AND CORPORATE COMMUNICATION
bjorn.simonsen@nelhydrogen.com
YY

     90 years
         Hydrogen Fueling   Hydrogen Solutions

                                                 2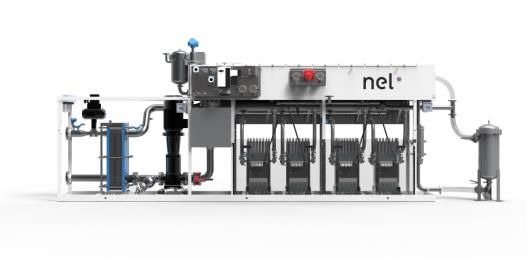
Nel ASA

 • Pure play hydrogen technology company listed on the Oslo Stock Exchange (NEL.OSE)

 • Manufacturing facilities in Norway, Denmark and U.S. & global sales network

 • World’s largest electrolyser manufacturer, with >3500 units delivered in 80+ countries since 1927

 • World leading manufacturer of hydrogen fueling stations, 50+ H2Station® solutions delivered to 9 countries

          Alkaline and PEM electrolysers                                   Compact hydrogen fueling stations
          Converting water and electricity to hydrogen and oxygen –        Hydrogen fueling stations capable of fueling any kind
          for industry and energy purposes                                 of vehicle. Nel compressor, chiller & dispenser.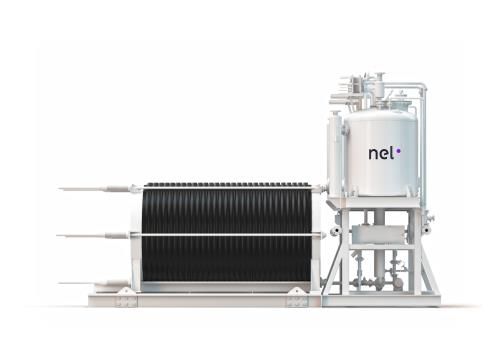
Financial highlights

                                                                            2019            2019           2018           2018           2018              2017
 (NOK million)                                                            Q1 Adj*             Q1             Q1             Q4
 Operating revenue                                                           122.4         122.4          112.5          124.9           489.0             302.2
 Total operating expenses                                                    174.4         174.4          144.3          185.6           685.1             419.4
 EBITDA                                                                       -20.1         -34.8          -15.8          -41.9         -131.6             -77.4
 EBIT                                                                         -37.3         -52.0          -31.9          -60.7         -196.1         -117.2
 Pre-tax loss                                                                 -38.5         -53.2          -32.9          -55.8         -197.5         -124.4
 Net loss                                                                     -36.6         -51.3          -30.1          -54.5         -189.0             -52.4
 Net cash flow from operating activities                                      -33.1         -33.1          -37.9          -44.6         -142.6         -113.0
 Cash balance at end of period**                                             743.2         743.2          250.8          349.7           349.7             295.0

                • *EBITDA negatively impacted in Q1’19 by non-recurring and ramp-up costs of NOK 14.7 million
                  • The high cost levels mainly due to significant ramp-up activities in California, South Korea, and Notodden
                  • In addition, there are high costs related to certain projects, legal assistance, BD activities and non-cash costs of NOK 3.3 million
                     related to stock options

                • ** The figures do not include NOK 68.1 million in gross proceeds from the subsequent offering (oversubscribed 3.5 times)
                                                                                                                                                                   4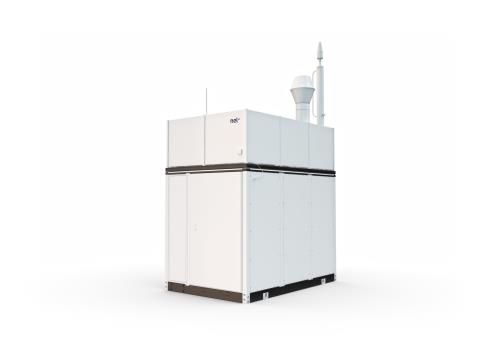
SHARE PRICE AND SHAREHOLDER           20100

           DEVELOPMENT IN NEL        16661

                            14793

                   12037

          8967

2800
Majority of shareholders from Norway, however only 47.7% of company owned by Norwegians
6Hydrogen – the key drivers, and the market opportunity
Necessary for electrifying the transport sector – commercially available today
Hydrogen = 100% zero emission, and technology is ready for commercial rollout
Renewable hydrogen can be competitive with diesel – already today
Cost reductions in the entire value chain – from power to dispenser – makes hydrogen competitive with fossil alternatives
Hydrogen enables increased share of intermittent renewables and can balance the grid
Electrolysis based hydrogen production can balance the grid and increases the value/use of the electricity
Large industry sectors are making the first moves to transition to renewable hydrogen
Fertilizer and steel industry alone account for about 10% of global emissions – have no other feasible alternatives
An already big market is set to grow significantly, fuelled by current megatrends
Hydrogen market today 56 M tons/year – and set to grow 10x in the coming 30 years
7Hydrogen is key to electrify the transport sector
Hydrogen as preferred future fuel alternative:
PASSENGER CAR
FAST FERRY
− True zero emission from production to use
TRAIN
− Can beat fossil fuel applications on a TCO-basis
− Low weight (compared to e.g. batteries),
especially relevant in the heavy duty segment
− Fast recharging (fueling) time
DELIVERY TRUCK
− Long driving range
CRUISE SHIP
− Low/no need for electric grid upgrades
BUS
− Not dependent on rare earth metals
(e.g. cobalt, lithium)
− Global standards for fueling established
− Same quality fuel used for small to large
applications
− Cleans the surrounding air
CAR FERRY
FORKLIFT
TRUCK
8Freight activity / heavy duty transport exhibiting strong growth towards 2050
Expected to double by 2050
• Heavy duty vehicles responsible for 47% of CO2 emissions from
land-based mobility and ~8% of total global CO2 emissions
• Freight activity (ton-km) projected to double by 2050
• Hydrogen most promising zero-emission fuel for heavy trucks
9
Source: Miller, J. & Façanha, C. (2014, August). The state of clean transport policy, ICCTDiesel is the most resilient petroleum product in Norway
Sale of diesel has stabilized on a high level despite transition to electrical vehicles
New sales of passenger vehicles in Norway BEVs at Sales of petroleum products in Norway total
>30% share in 2018 decrease 2% since 2014, diesel up 4%
100 % 8000000
90 % 7000000
80 %
6000000
70 %
5000000
60 %
50 % 4000000
40 % 3000000
30 %
2000000
20 %
1000000
10 %
0% 0
2012 2013 2014 2015 2016 2017 2018 2014 2015 2016 2017 2018
Diesel Gasoline Hybrid Plug in hybrid Battery electric Gasoline Diesel Machinery Marine Aviation
10Cost of wind and solar has dropped by 69% and 88% during the last decade – renewable
hydrogen following on the same path
Wind and solar is on a trajectory to become the cheapest form of electricity
• With falling LCOE1) of wind and solar prices,
Wind LCOE Solar PV LCOE
renewable hydrogen follows the same path, as
Unsubsidised levelized cost of energy ($/MWh) 2) Unsubsidised levelized cost of energy ($/MWh)2)
electrical power constitute 70-80% of the total
cost of hydrogen
$ 359
• Record low auction prices for solar PV and
wind has seen prices as low as $17.7/MWh and
$17.86/MWh respectively (as of 2017) 3)
$ 248
• Prices are expected to drop further, LCOE of
solar PV and onshore wind are expected to fall
$ 157 by 71% and 58% respectively by 20504)
$ 135
$ 124 $ 125
• At $50/MWh renewable hydrogen is becoming
$ 98
$ 79 competitive with fossil fuels and at $30/MWh
$ 71$ 72 $ 70 $ 59 $ 55 $ 64 $ 55
$ 47 $ 45 $ 42 $ 50 $ 43 renewable hydrogen is becoming competitive
in most markets
2009 2010 2011 2012 2013 2014 2015 2016 2017 2018 2009 2010 2011 2012 2013 2014 2015 2016 2017 2018
Note: 1) LCOE = Levelised cost of energy, which is a way of calculating the total production cost of building and operating an electricity-generating plant
Source: 2) Lazard; Renewables Now, 3) IRENA (International Renewable Energy Agency); 4) BloombergNEF New Energy Outlook 2018 11Growth in renewable hydrogen will accelerate with reduced capex for electrolysers
Hydrogen production - capex price • SMR – “steam methane reforming” is dominating
hydrogen production today, using natural gas and steam
$/kW
• Nel is establishing a new manufacturing plant targeting a
800 >40% cost reduction
700 • Expect to see further reduction in capex with increase
Fossil parity at production volume, and further size scaling of products
600 $500/kW
capex level • Nel targets capex to drop below SMR over time
500 • Electrolysis expected to be the preferred production
400
method if opex (i.e. power prices) are low enough (or at
SMR w/o CCS – capex range parity) with the alternative production methods
300
200
historic under construction
With current ongoing Futurefuture scale up
large scale
expansion (New products/ technology development)
Large scale natural gas reformers Nel large scale alkaline electrolysis
Source: Nel
12LCOE of new-build wind and solar is now competitive with the alternatives
$ 70
$ 60 $ 56
$ 50 $ 47
$ 44 $ 45
$ 41
$ 40
$ 31
$ 36
$ 30 $ 32
$ 29
$ 27
$ 20 $ 24
$ 10 $ 14
$0
Onshore wind Onshore wind Solar PV - utility Solar PV - utility Coal Nuclear
(subsidized) scale scale (subsizdized)
LCOE of new build wind and solar vs coal and nuclear [$/MWh], Source: LAZARD 13Decreasing cost of renewable hydrogen (and oxygen) opening up new business areas
• Wide variety of existing and new markets
METHANOL
AMMONIA
REFINERY
where electrolysis can play a major role
– Exchanging fossil hydrogen with
renewable hydrogen (f.ex fertilizer)
– Exchanging coal with renewable
hydrogen (f.ex steel manufacturing)
TITANIUM OXIDE
REMOTE POWER
– Oxygen & heat adds value
STEEL
• Electrolysis “bridges the gap” between the
power and industry sector, increasing the
value of electrons
• Ability to adapt to diverse and intermittent
renewable energy sources becoming
ENERGY EXPORT
FISH FARMING
GAS PIPELINES
increasingly important
14Overall hydrogen demand is set to grow 10x by 2050 – representing massive
opportunities for electrolysis
Global hydrogen market today, by end-use: Global hydrogen market until 2050, by end use (mill tons)1)
545
63
63
70
79
196 114
98
56 70
156
2015 2020 2030 2040 2050
Power generation, buffering Existing feedstock users Industrial energy
Ammonia Refineries Methanol Other New feedstock (CCU, DRI) Building heat and power Transportation
Note: 1) Converted from EJ to million tons (1 EJ = 7m tons) | Source: Hydrogen Council, November 2017 15You can also read