Biffa plc - Business Overview and Investment Case - March 2019
←
→
Page content transcription
If your browser does not render page correctly, please read the page content below
Biffa plc – Business Overview and Investment Case

March 2019
Who Are We
The UK’s Leading Waste Management Business

1912       Net revenue
           FY18
                           Underlying
                           EBITDA FY18
                                              Operating across

                                              195+ 2,700
                                                                 Over

Biffa                                                            Front-line
formed     £978m £150m                        locations
                                              nationwide         vehicles

2016       Over
           75,000 10.9m
                           Over
                                              Leading Over
                                                                 7,900
                                              H&S
Floated                    waste collected,
                                              performance in
                                                                 staff
on LSE
                           processed or
           I&C customers                      the waste sector
                           landfilled p.a.

                                                                              3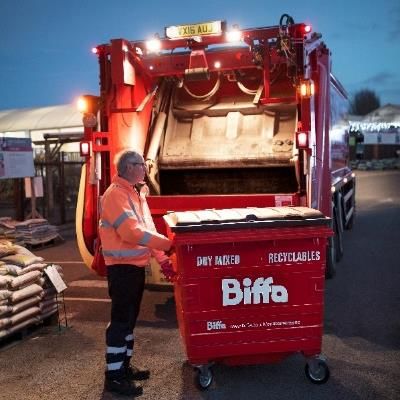
What We Do

                                                                                   Biffa operations
                                                                                   Planned future operations
                                                                                   Biffa has no or limited operations

                               Residual
Collection                                        Waste incineration

                                waste
                                                                               RDF = Refuse Derived Fuel
                                           Mech. and Bio. Treatment (MBT)
 Municipal/       3rd party
 household                                        RDF preparation
                   waste
   waste                                                                            End products

                               Recy-
                                          Materials Recycling Facility (MRF)

                               cling
Industrial and    Transfer                                                           Commodities
                                                 Recyclate recovery
 Commercial      and bulking
 (I&C) waste      of waste                                                              Energy
                                Organic       Anaerobic Digestion (AD)
Construction                                                                              Gas
                                          Soil Treatment & Composting (STC)
   and
                                                                                       Compost
 Demolition
                                             Treatment of hazardous waste
(C&D) waste
                                               Processing of C&D waste                Aggregates

                                                                                          RDF
                                                Landfill disposal

                                                                                                                        4
How We Are Organised
Industrial & Resource Recovery
Municipal Energy
Commercial & Treatment
Waste collection and Household waste and Waste processing Infrastructure including
related services to recycling collections, and disposal Landfill Gas, AD and MBT
industrial and commercial street cleansing and other technology
customers services
FY18 Net Revenue: FY18 Net Revenue: FY18 Net Revenue: FY18 Net Revenue:
£574.0m £194.7m £121.3m £87.7m
FY18 Underlying FY18 Underlying FY18 Underlying FY18 Underlying
Operating Profit: £48.1m Operating Profit: £8.7m Operating Profit: £13.7m Operating Profit: £28.1m
c. 3,200 employees c. 3,600 employees c. 600 employees c.150 employees
74,000 customers 34 municipal contracts 3.1m tonnes landfilled 34 landfill gas locations
Over 95% UK postcode 2.3m households served annually 80.4 MW installed
coverage 5 fully automated MRFs capacity
5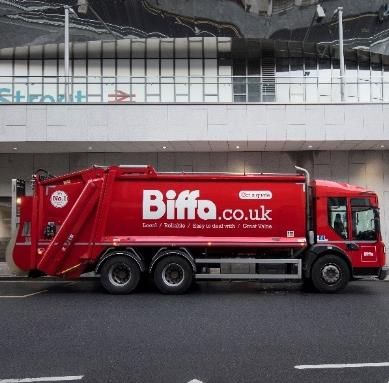
Market Dynamics &
Biffa’s Positioning
UK Waste Market – and Biffa’s Positioning
Fragmented I&C collection market undergoing Biffa #1 with 10+% market share – natural
much-needed consolidation consolidator with proven track record
£1bn investment needed in UK recycling in the Biffa has established capabilities in all areas of
next decade to meet Govt targets recycling and benefits from control of material
feedstock through collection operations. Recent
projects include PET bottle recycling facility
Insufficient Energy from Waste infrastructure.
Significant and persisting under-capacity Biffa partnership with leading US EfW developer
(currently c.13m tonnes p.a.) Covanta to develop two much needed facilities
with a capacity of 350ktpa
Ongoing need for landfill disposal - shortage of
well-engineered, well located sites Biffa has over 10% market share across 9 open
sites
UK shortage of reliable low-carbon energy
supply Existing Biffa Landfill Gas operations (c. 380
GWh p.a.) and new Energy from Waste
infrastructure planned
7
UK Waste Market – Resources & Waste Strategy Highlights
UK signed up to EU Circular Economy recycling Established infrastructure well placed to deal with
targets of 65% by 2035 – requires a 50% increased recycling and domestic reprocessing
increase in recycling from current levels demands
Commitment to mandatory food waste/biowaste Will require more collections for separate food
collections in line with EU law by 2023 waste (Municipal and I&C) and will stimulate
investment in AD plants – where Biffa has a
presence
Tax on plastic withStrategic Priorities and Delivery
Strategic Goals
1
Drive organic growth through leveraging Biffa’s established brand,
reputation and breadth of service offering
Grow market
presence Pursue synergistic acquisitions to leverage operational platform
2
Leverage control of waste streams and expertise to invest in waste
Develop processing, recycling and energy recovery assets
services and
Expand service offering to meet increasingly complex needs of
infrastructure customers
3
Drive value from existing operations through efficient business
Optimise operations
systems and
Further investment to improve efficiency of operations and enhance
process
customer experience
10Grow Market Presence – I&C Organic Growth
High profile customer wins and extensions during H1 2019 across a broad range of sectors
Key contract wins:
Key contract renewals:
Growth of partnership model – embedding our proposition into our customers’ operations
On track to deliver a record level of new business this year
11Grow Market Presence – I&C Acquisitions
Another period of strong acquisition growth:
4 acquisitions completed in H1 2019 – investment of £20m
1 small acquisition completed since H1 2019
All acquisitions in I&C and with good geographic spread
Integration and synergy delivery progressing well
Financing and internal resources in place to facilitate delivery of M&A strategy
Pipeline remains strong
Cash plus
Completion
Acquired business Location net debt
date
(£m)
1 London Recycling Limited* London 0.1 April 2018
2 Bisset Waste Management Limited* Scotland 0.3 July 2018
3 Weir Waste Services Limited West Midlands 16.1 August 2018
4 H&A Recycling Limited* Cornwall 3.5 August 2018
5 Kier Group Companies * ** East Sussex / 1.1 October 2018
Cheshire
* Trade and assets purchased ** Completed after H1 FY19
We continue to deliver against our I&C acquisition strategy
12Develop Services and Infrastructure – Energy from Waste
30 UK Residual Waste Treatment Gap (Mtpa)
A Compelling Investment Opportunity
25
Proven capacity gap 13.6 7.1 5.9 5.9
20
Tightening European market
15
Strong investor and lender appetite, providing the
right technology is chosen 10
Biffa’s increasing control of feedstock makes this 5
even more compelling (Weir acquisition adds 0
c.30kt) 2016 2017 2018 2019 2020 2021 2022 2023 2024 2025 2026 2027 2028 2029 2030
RDF Export Existing EfW Capacity
Strengthened central government support for EfW
Expected EfW Capacity Residual waste suitable for EfW
Source: Reality Gap report
Status of Projects Indicative investment metrics (per site)
EPC and funding processes nearing completion Capital cost £260m - £270m
Both Newhurst (Leicestershire) and Protos Capacity 350ktpa
(Cheshire) sites permit applications progressing Biffa’s share of equity 50%
well Biffa’s equity contribution £33m – £41m
Financial case compelling Leverage 70-75%
Financial close on both projects expected in H1 Equity IRR Mid to high teens
2019 Biffa’s tonnage commitment c.70%
An increasingly compelling investment opportunity
13Develop Services and Infrastructure – PET Recycling
Biffa has a significant opportunity in plastic recycling:
Proven operational credentials – past success in PP and
HDPE
Trusted relationships with major international plastic
packaging groups
Control of significant feedstock
A supportive policy and market context exists:
UK Govt Budget announcement to tax plastic withOptimise Systems and Processes
Ongoing roll-out of on-board technology
Optimising fleet
operations Double and triple shifting of vehicles
Includes frontline operations; back office;
Delivering acquisition procurement; internalisation
synergies All acquisitions on track to deliver targeted
synergies
Leicester contract performance
Stabilising improvement on track (Energy Division)
challenged contracts Municipal under-performing contracts
turnaround plan in progress
Responding to the New products and end markets established
changing recycling Aldridge plant modifications complete
market Revised terms with local authorities agreed
Maximising Biffa Polymers HDPE – record throughputs
production yields Best in class Land Fill Gas operations
15Concluding remarks
Biffa – a compelling investment opportunity
Biffa offers the opportunity to invest in a leading national operator with a strong track record
of delivery in a growing, changing industry
Leading platform and brand with competitive positions in key markets
Track record of profitable growth and strategic delivery
Structural growth drivers in recycling and energy from waste underpinned
by new government strategy
Compelling case for market consolidation in core I&C collections space
Stable defensible business model with limited risk of disruption
17Appendix
Five Year Performance Summary

    £m                                            2018A       2017A        2016A         2015A         2014A
    Statutory revenue                              1,077         990           928           878          860
    Net revenue                                      978         899           830           771          705
     % net revenue growth                           8.8%       8.3%          7.7%          9.4%            NM
    Underlying EBITDA                                150         138           122           105               97
     % margin                                     13.9%       13.9%         13.2%        12.0%          11.3%
    Underlying Operating Profit                        81         74            63            49               34
     % margin                                       7.5%       7.5%          6.7%          5.6%          3.9%
    Underlying FCF                                     44         29            36              4              (4)
    Leverage (uEBITDA / net debt)                    1.9x       1.8x           n/a           n/a           n/a
    Tonnes collected (kTns)                        4,124       3,769         3,603        3,475         3,322
    Tonnes processed (kTns)                        3,693       3,265         3,054        2,904         2,344
    Tonnes landfilled (kTns)                       3,118       2,790         2,800        2,592         3,335
    Energy generation (GWh)                          476         512           530           559          574
   Note: For financial and non-financial definitions see pages 26 and 27 of the H1 FY19 results presentation

                                                                                                                     19
You can also read