Using data to define new logistics collaboration models: Observations from U-TURN with a focus on the Supermarket eCommerce market - Richard ...
←
→
Page content transcription
If your browser does not render page correctly, please read the page content below
Funded by the
                                                         Horizon 2020
                                                           Framework
                                                     Programme of the
                                                      European Union

Using data to define new logistics
collaboration models:
Observations from U-TURN with a
focus on the Supermarket
eCommerce market

Richard Walters (richard.walters@bearingpoint.com)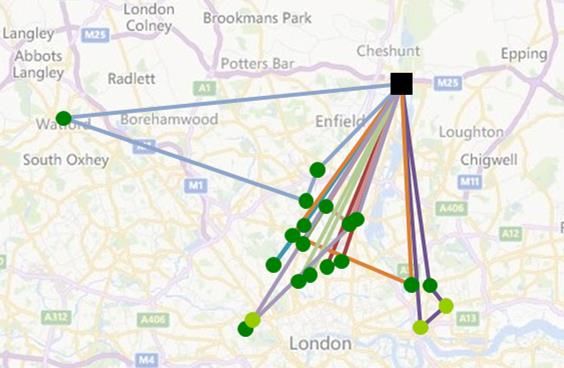
Contents
 Background
              The Grocery eCommerce market

 How we used data
              Data sources
              Data challenges
              Data generation tools
              Modelling scenarios

 Results
              Reducing cost and vehicle impacts
              Applying the learnings (case study)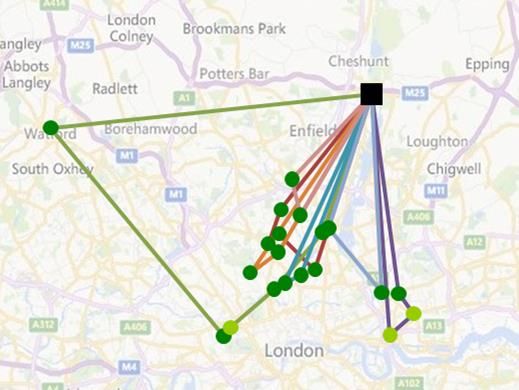
BACKGROUND
UK Grocery eCommerce:
A market facing many challenges
               Against a broadly static grocery retail market, online is growing rapidly
               •   Growth c.17% per annum with projected value of £17bn by 2020

               •   Orders rising from 75million in 2014 to 170million pa in 2020

               •   Delivery vans rising from 10,000 to 20,000

               •   Future environmental impact CO2 175 m tonnes pa with NOX and PM’s

               •   Major concerns on traffic impacts from policy makers

               The Competition amongst retailers is intense:
               •   UK grocery retail is highly concentrated
               •   All of the key retailers are involved and use online to drive customer retention
               •   The big six account for 85% of the market with Tesco the largest (circa 38%)
               •   Evidence they sacrifice margin to maintain share
               •   New businesses (both big and small) are entering the market – based on disruptive business models and / or
                   new technology e.g. Amazon, Farmdrop, HubBub and Starship

               Customers increasingly searching for and expecting online retail solutions:
               •   71% of shoppers have / are or will shop online for groceries – less than 10% only use online
               •   The customer experience is constrained by the delivery arrangements
               •   Customers are offered 1 hour delivery slots with 2-3 hr time reservation windows
               •   The most convenient slots are oversubscribed, so dynamic pricing is used to influence customers’ slot
                   selection to help retailers fill van capacity
               •   Once again this erodes margin
               •   Minimum order values are typically £40 to £50

                                                                                                                           4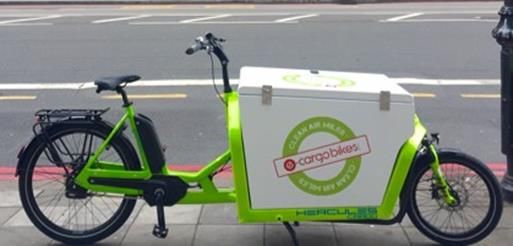
UK Grocery eCommerce:
A market facing many challenges
                3 main Supply Chain models have evolved:
                •   Store based picking fulfilment is the most common operating model
                •   As volumes have grown, there has been investment in upstream capacity e.g. dark stores and fulfilment
                    centres
                •   Dark stores are regional fulfilment that look like stores with no customers and avoid conflict with shop
                    customers and give some productivity improvements
                •   Historically – large central facilities have not proved economic. Now Ocado and Morrisons fulfil from large
                    central facilities with the technology provided by Ocado
                •   There is a cost trade off between picking and delivery – local picking costs more but the delivery is
                    cheaper

                The Economics are Challenging and the retailers have a significant dilemma:
                •   Average Cost per order of c. £21, the delivery element circa £10
                •   Break even order c. £70 ~ embrace growth unprofitably or lose market share
                •   Collaboration is not on retailers’ agendas
                         Customer intimacy and feedback from the final delivery is a key part of the brand
                         Periods of peak demand are unsustainable
                •   So, retailers need to find ways to cut costs and improve customer choice

                Click and Collect is the area of new investment:
                •   Increases convenience for customers and lowers costs – constrained by food control obligations - chill
                •   C&C growth is 30% pa in non-grocery including a widespread use of remote C&C locations e.g. lockers
                •   The fastest growing area of online order fulfilment, but
                •   Collection option for grocery almost entirely limited to ‘at the store’
                •   Expectation that new C&C models will drive growth in customer expectation in Grocery retail
                •   Customers seeking increasingly convenient options not just collection at store locations

                                                                                                                         5
USING DATA
Data Sources:
        We used primary and secondary data
                                                                         Primary data received from 2 retailers:
                                                                         • Covering 1 calendar year and geographic area of London
                                                                         • Circa 7m transactions
                                                                         • Order level including order size, date, delivery time, delivery point at
                                                                           postcode / sector level, and route origination
                                                                         • Retailer 1 is one of the big six, retailer 2 a smaller UK player
                                                                         • Data has been used with market share and demographics to synthesise
                                                                           the market

                                               Orders                 Weighting
                                                                                        A combination of Secondary data was used to
                                                                                        Total
Postcode
                           Sales
                                     Population
                                                     Sales
                                                                Population
                                                                              Sales     synthesise postal sector
                                                                                       Online                  demand per retailer. For
           Population     Index \                    Index                    Index   Grocery
 Sector
                        Population
                                      method
                                                    method
                                                                 method
                                                                             method
                                                                                        example:
                                                                                       Orders
                                                                                      per Year
             5,615        16,227       2,835            702
                                                                                        • Population statistics
                                                                                        1,770
AL1 1                                                              50%        50%
AL1 2        6,716        19,411       3,392            840                            • Market
                                                                                       2,117       and company reports
                                                                   50%        50%
AL1 3        4,303        12,436       2,173            538
                                                                   50%        50%
                                                                                       • Results
                                                                                       1,356        from published surveys
AL1 4        10,090       29,159       5,095            1,262
                                                                   50%        50%      • Undertook
                                                                                       3,180           in house a research survey on Consumer
AL1 5        10,529       30,430       5,317            1,317                              attitudes
                                                                                       3,318         to Grocery Online shopping
                                                                   50%        50%

                                                                                                                                                      7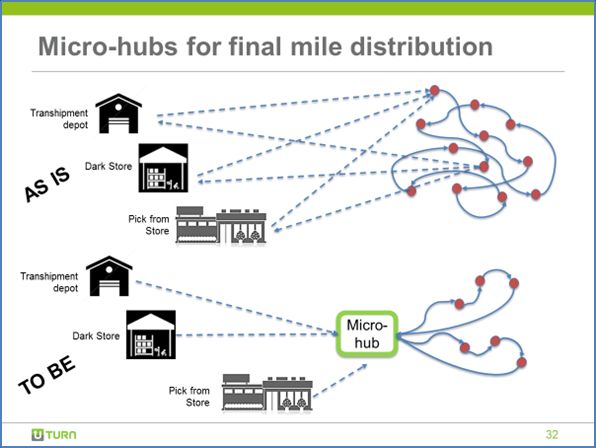
Data Challenges:
Challenges and workarounds led to unintended benefits
                          Significant effort to gain data from other retailers:
                          • 16 meetings and various email correspondence
                          • Genuine interest but competitive landscape has intensified since the
                            outset of project
                          • They have become increasingly guarded about data sharing
                          • However retailer interaction has enabled a very in depth view of the
                            market to be developed and ability to test assumptions and understand
                            capabilities and future strategies
                          • This has helped to develop a community of interest – major event 14th
                            March 2017
                          • As project develops still more opportunity to interact as needed

                          We had to engage with a much wider retail audience:
                          • Key insights on evolution of customer service offer … click and collect the
                            area of new investment
                          • Key insights on opportunities for alternative forms of last mile transport
                          • Key insights around attitude towards collaboration
                          • Key insights into cost of current service
                          • Developed a wide community of interest that eventually led to the case
                            study (see later slide)

                                                                                                     8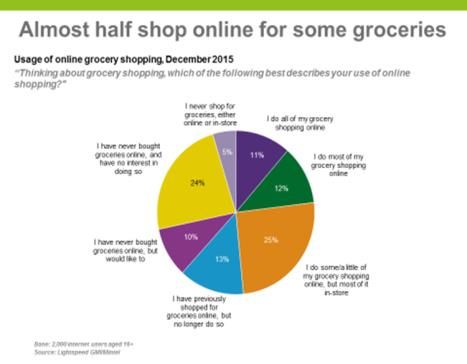
Data Generation:
Monte Carlo Simulation

✓ Estimate demand for 265 postcode sectors for 364 days

✓ Tesco, Sainsbury's, Asda, Waitrose, Ocado, and Morrisons
  Retailer             Tesco

  Postcode Sector     AL10 9
  Annual orders        4,979
                                              Number of
        Week            Day     % of Orders
                                               orders
         13th       Monday        0.31%          15
                    Tuesday       0.27%          13
                    Wednesday     0.23%          11
                    Thursday      0.26%          13
                    Friday        0.33%          16
                    Saturday      0.28%          14
                    Sunday        0.23%          11
                                                          Source:
                                                          Cranfield School of Management

                                                                                       9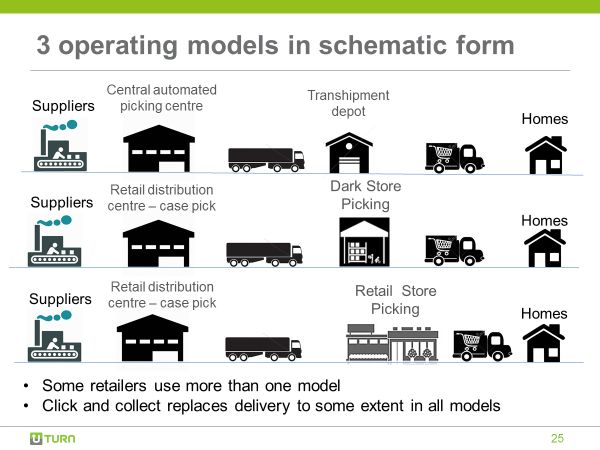
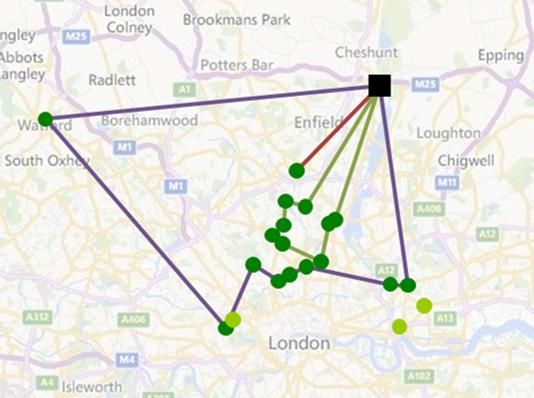
Data Generation:
   Vehicle Routing Problem
                          Supply 20 micro hubs

   R1:                                  R2:

                        10 vehicles are needed, 527 kilometres

       Shared Model:

                                                        Source:
9 vehicles are needed, 425 kilometres                   Cranfield School of Management

                                                                                   10
Modelling Scenarios:
Using Micro Hubs in the ‘To Be’ landscape
We established the typical supply chain Understanding the role for Micro-hubs
models (micro consolidation centres)
11Modelling Scenarios:
Examining Retail Collaboration
We examined the following proposed collaboration scenarios:
A. R1: Morrisons (2%), R2: Ocado (14%)
B. R3: Sainsbury’s (15%), R4: Waitrose (4%)
C. R1: Morrisons (2%), R2: Ocado (14%), R4:Waitrose (4%)
Note: Market shares are based on 2015 sales
Source:
Cranfield School of Management
12Modelling scenarios:
Identifying New supply chain structures
Picking Locations Micro Hubs around
Consumers
of Retailers Residential Areas
Picking Locations Micro Hubs around
Consumers
of Retailers Residential Areas
Picking Locations Micro Hubs around
Consumers
of Retailers Residential Areas
13RESULTS
Results:
A snap shot of the opportunities

                     Improvements up to:

• 23% of the total travelled distance

• 28% of the number of trucks              Last Mile
• 59% of the fleet utilisation

• 12% of the total travelled distance

• 10% of the number of trucks              Stem Mile
• 5% of the fleet utilisation
                                              Source:
                                              Cranfield School of Management

                                                                         15
Results:
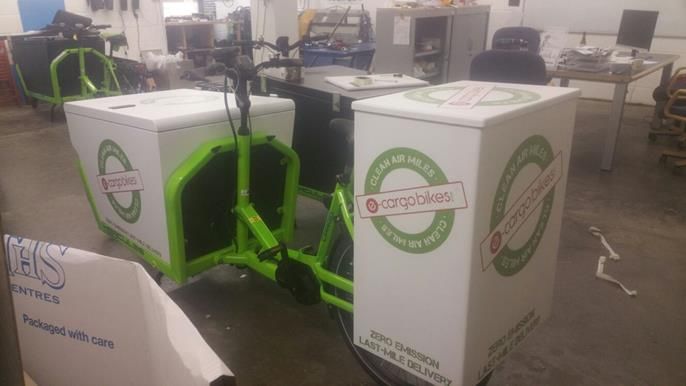
Applying the learnings (E-Cargo bikes Case Study)
Sainsbury’s trials UK’s first grocery deliveries service by zero emission electric
cargobike
• e-cargobikes to deliver online orders to customers in Streatham, London, from
April 17th 2018
• Trial tests greener grocery deliveries in congested cities:, one e-cargobike can
deliver as much as 3.5-tonne lorry in a day
• Trial shows Sainsbury’s strategy to serve customers whenever and wherever they
want
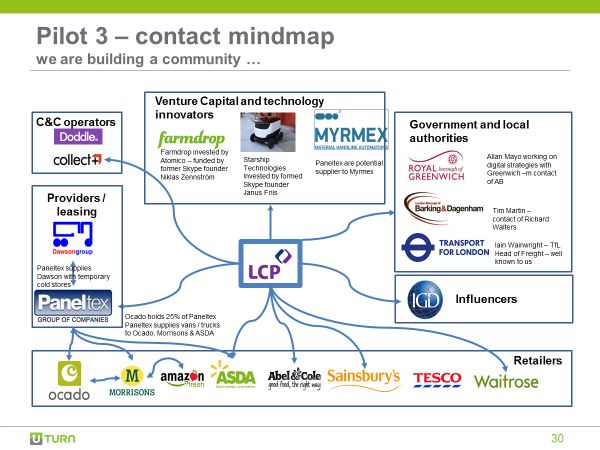
16Results:
Applying the learnings (E-Cargo bikes Case Study)
U-TURN has been supporting and coaching the E-Cargo Bikes team through their
development of the trial with Sainsbury
Professor Alan Braithwaite used elements of the U-TURN analysis and results to:
• Provide regular sense checks and options discussions to the directors as they
pieced their way through the pre-revenue stage of their business planning and
design
• Provide data from U-TURN to validate likely volumes and drop densities to
arrive at the 2 to 3.5 mile radius number
• Supporting the design of the early trial runs, timing and productivity potential
• Coaching on the sales engagement and contractual expectations when
opening discussions with the retailers
• Reviewing the route data provided by the retailers and working on the
consequent productivity assumptions
• Creating revenue, cashflow and investment models
17THANKYOU
You can also read