The most accurate
Vessel & Engine
Performance
Assessment Application
←
→
Page content transcription
If your browser does not render page correctly, please read the page content below

The most accurate Vessel & Engine Performance Assessment Application
Who we are

           At Propulsion Analytics we specialize in
            Performance Management Solutions
                 for the maritime industry.
     We use thermo–fluid dynamic Simulation models,
  Data analytics & Machine learning techniques to provide:

    Engine
 Performance
 Assessment &                                Engine Hyper Cube®
Fault Diagnosis

    Vessel
 Performance                                          QUAD
  Assessment

Vessel & Engine
 Performance                                   VesselQUAD®
  Evaluation
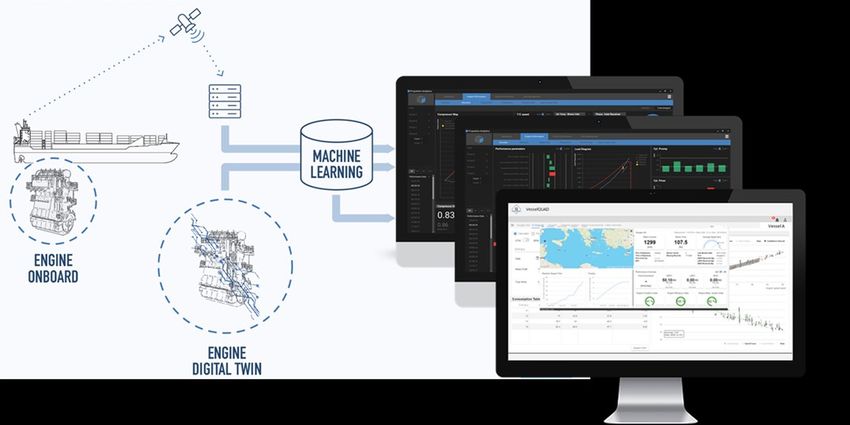
Accurate vessel performance is essen-      In VesselQUAD® the vessel perfor-
tial for continuous up-to-date Fuel Oil    mance evaluation is accomplished
Consumption (FOC) prediction, im-          through a combination of propulsion
proved, fact-based hull and propeller      engine Thermodynamics, plus Analytics
cleaning decisions and any assessment      (Machine Learning-ML) on continuous
of hull/propeller adaptations.             recordings of vessel data, from any
                                           third-party onboard data acquisition
Propulsion Analytics has developed and     system.
introduces a novel “inside-out” meth-
odology for the most accurate vessel &     The inclusion of engine thermo-
engine      performance      evaluation.   dynamics is necessary in order to en-
“Inside-out” refers to the fundamental     sure that the analytics algorithms are
process in ship operation of the conver-   fed with highest quality data attained
sion of money into vessel speed.           through consecutive filtering, validation
                                           and enrichment of recorded data. This
                                           also leads to increased accuracy (>97%)
                                           which allows the determination of
                                           small changes in FOC (error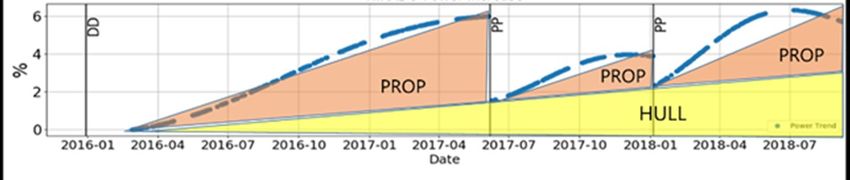
VesselQUAD® validates and augments         The purified and enriched datasets are
several important but tricky to measure    subsequently scanned in the QUAD
parameters such as Torque, Power, FOC      vessel performance application using
by high fidelity calculated values pro-    analytics algorithms and Machine
duced by the propulsion engine digital-    Learning techniques, to extract behav-
twin application Engine Hyper Cube®,       ior patterns in vessel speed/FOC, de-
which also detects any possible engine     duce profiles in vessel operation and
faults / underperformance.                 accurately determine the FOC gradual
                                           increase over time and the FOC chang-
                                           es resulting from cleaning or other
                                           events.

                           The VesselQUAD® application
                    integrating QUAD with Engine Hyper Cube®
                     can cover with authority, in one package,
                                the Vessel & Engine
                              Performance Evaluation
                           needs of a shipping company.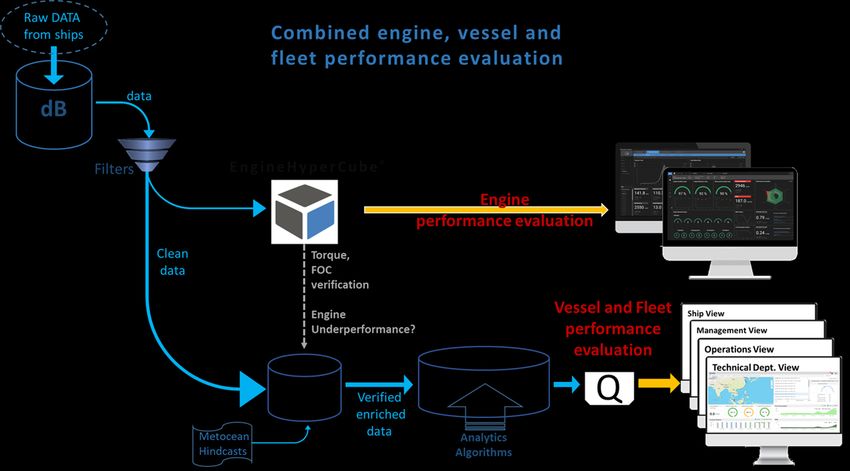
PROPELLER/HULL
FOULING DISSECTION

The assessment of the relative contribu-          VesselQUAD®, the most accurate Vessel
tion from propeller and hull to the overall       and Engine Performance Assessment Ap-
fouling penalty is required primarily for         plication, uses thermodynamics on the
decision support in cleaning actions.             propulsion engine in order to validate and
                                                  supplement torque and FOC measure-
As the fouling is a slow developing phe-          ments. This, combined with Machine
nomenon, the fouling related FOC in-              Learning, evaluates the evolution of foul-
crease cannot be detected                         ing penalty over time, & the effectiveness
by conventional methods.                          of each cleaning action.

The detailed analysis leads to charting of power demand increase over time:

    The analytics algorithms use the data recordings from the periods shortly before or
    after a major event as “training” to create a reference and then scrutinize the power
    demand for each subsequent sailing condition.

    The algorithms remove the effects of weather conditions and vessel attitude and extri-
    cate the pattern of the slow developing overconsumption due to fouling over time.

    The slope between events signifies the rate of fouling increase. After a period of time
    VesselQUAD® will amass sufficient data to also stratify and reveal accurately the effects
    of composite cleaning events.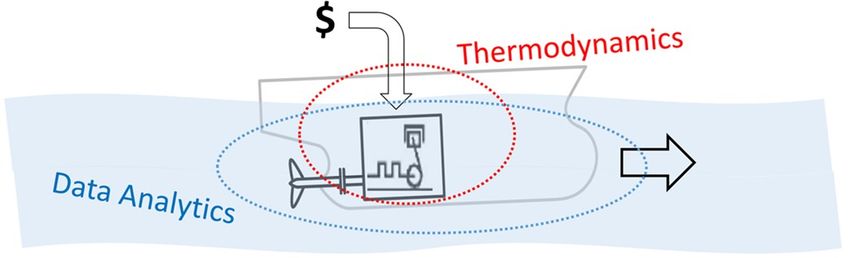
EVALUATION OF                              CLEANING
 ENERGY SAVINGS                             EVENT EVALUATION

                                            Cleaning events are characterized by
                                            several items such as:

                                            ▪Type (propeller cleaning, combination
                                            propeller/hull, hull portions)
                                            ▪Technique (type of brushes, usage)

                                            ▪Contractor

                                            ▪Location

                                            ▪Cost, etc.

                                            Meta-data on the cleaning event char-
                                            acteristics, allows further profiling and
The evaluation of vessel retrofits for      evaluation of different geolocation,
propulsion system optimization, such        contractors and techniques.
as propeller ducts, fins, bulbs influenc-   The cleaning event evaluation and re-
ing the torque to thrust conversion, as     lated KPI in the VesselQUAD®, involves
well as various hull resistance reduc-      comparison of FOC before/after. It has
tion measures, is an intricate task due     been found that propeller cleaning
to the complex interaction of many pa-      events usually result in approximately
rameters.                                   1.5-3% improvement in FOC. Such a
The Propulsion Analytics “inside-out”       comparison is only possible with accu-
methodology in the VesselQUAD® ap-          racies >97% in prediction (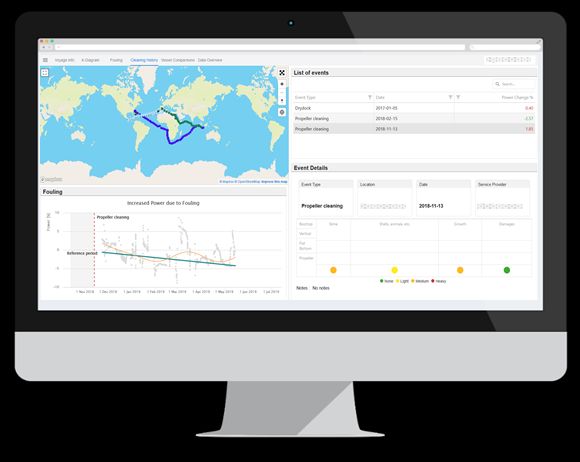
SPEED/FOC TABLES                           TRIM/FOC TABLES

To achieve the requisite accuracy in       The raw data from the vessel, after
FOC estimation, a combination of           cleaning, verification and enrichment
techniques is used in the QUAD appli-      are available in a data repository in
cation, involving thermodynamics,          the VesselQUAD® application, as a
statistical analysis and corrections for   multitude of sample sets, each sample
fuel and operational issues.               set obtained at a respective time in-
                                           stant and containing measurements
In the VesselQUAD® application once        (elements) from respective sensors
the raw data has been cleaned and          (Draft, STW, Power, etc.).
verified, data mining is employed to
establish speed/FOC relations for any      Subsequently, using data mining tech-
specific hull condition and weather        niques, the relations of various pa-
state, also considering any engine un-     rameters of interest can be extracted,
derperformance.                            based on actual measured ship data.
In such a way the FOC/speed tables         It is then possible to construct related
can be produced with authority, to be      Tables and a procedure to advise on
further used as needed by the ship-        Trim so as to minimize Power (FOC)
ping company.                              for a certain ship attitude and condi-
                                           tions.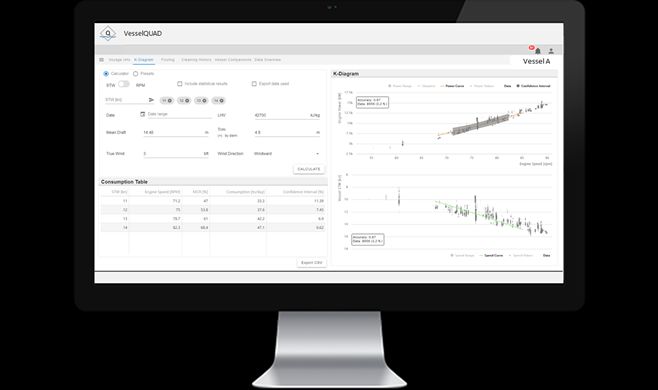
CO2 EMISSIONS INTENSITY
DURING OPERATION

The fusion of engine and vessel perfor-    The engine performance facility Engine
mance assessment in VesselQUAD®,           Hyper Cube®, can provide at any in-
provides the requisite data quality to     stant, for any fuel, thermodynamically
allow for the detection of even small      correct values of:
changes in performance, resulting in       ▪Fuel consumption
the most accurate evaluation.              ▪CO2 emissions

The VesselQUAD® application, when          The vessel performance facility QUAD
linked to an onboard data-acquisition      can provide :
system, can accurately calculate the ac-
                                           ▪   Actual Deadweight (or cargo load) for
tual GHG emissions intensity of a voy-
                                               a certain voyage.
age using real operating data. A voyage
should be considered from the dis-         ▪   Distance travelled per time-interval
charge of the previous cargo to the dis-       using log (STW) and GPS (SOG) speed.
charge of the present cargo. The car-      ▪   CO2/speed projections for a specific
bon intensity evaluation requires the          hull condition and any intended voy-
calculation of CO2 emissions for a spe-        age, cargo loading, weather (for clean
cific transport work.                          & fouled vessel).
                                           To assess the climate alignment of a
                                           single voyage of a vessel, the voyage
                                           carbon intensity can subsequently be
                                           compared with the decarbonization
                                           trajectory for its respective ship type
                                           and class. Supplemental comparisons
                                           of CO2 emissions intensity can be made
                                           on sister vessels and across a fleet.
                                           Aggregates of vessel or fleet emissions
                                           intensity over any time period, such as
                                           per day or per year, can be composed.
CO2 EMISSIONS REDUCTION
OPTIONS EVALUATION
The VesselQUAD® application can pro- The VesselQUAD® methodology is fu-
vide a true baseline for subsequently ture proof. The engine performance
benchmarking a GHG emission reduc- core is reconfigurable and can account
tion SEEMP plan. for practically any retrofit on the en-
gine, such as derating measures, turbo-
It can provide accurate ex post evalua-
charger upgrades, auto-tuning, eco
tion of any effected measures for emis-
cams and nozzles, but also future hy-
sions reduction, such as engine power
brid thermal/electric arrangements.
limitations or efficiency improvements,
alternative fuels, operational changes, Any vessel effected retrofits, aiming to
such as slow steaming or weather reduce the thermal power demand for
routing, as well as vessel related propulsion, including even futuristic
measures, such as hull friction reduc- measures for creating thrust such as
tion and propeller thrust improve- sails, foils etc., will lead to different be-
ments. havior patterns and will be evidenced
in the incoming monitoring data. This
will be picked up by the analytics
(machine learning) algorithms and then
reflected in the CO2 emissions intensity
calculation.You can also read