A PLASTIC FUTURE PLASTICS CONSUMPTION AND WASTE MANAGEMENT IN THE UK - WWF-UK is
←
→
Page content transcription
If your browser does not render page correctly, please read the page content below
A PLASTIC FUTURE PLASTICS CONSUMPTION AND WASTE MANAGEMENT IN THE UK
Plastics Consumption and
Waste Management

Final Report

Tim Elliott
Laurence Elliott

26th March 2018
Report for WWF

Prepared by Eunomia Research and Consulting Ltd

Approved by

………………………………………………….

Tim Elliott
(Project Director)

Eunomia Research & Consulting Ltd          Tel: +44 (0)117 9172250
37 Queen Square                            Fax: +44 (0)8717 142942
Bristol                                    Web: www.eunomia.co.uk
BS1 4QS
United Kingdom

Disclaimer
Eunomia Research & Consulting has taken due care in the preparation of this report to
ensure that all facts and analysis presented are as accurate as possible within the
scope of the project. However no guarantee is provided in respect of the information
presented, and Eunomia Research & Consulting is not responsible for decisions or
actions taken on the basis of the content of this report.

ii                                                                       26/03/2018
Contents
1.0 Main Plastic Consuming Sectors ............................................................................ 1
  1.1 Introduction.............................................................................................................. 1
  1.2 Plastic Consumption in Europe ................................................................................ 1
  1.3 UK Plastic Waste Generation ................................................................................... 2
  1.4 Recycling Rates and other Waste Management Routes .......................................... 3
2.0 Key Single Use Plastic Products .............................................................................. 5
  2.1 Introduction.............................................................................................................. 5
  2.2 Plastic Consumption ................................................................................................. 5
  2.3 Recycling Rates and other Waste Management Routes .......................................... 7
  2.4 Litter ......................................................................................................................... 8

     WWF – Plastics Consumption                                                                                                       iii
1.0 Main Plastic Consuming Sectors
1.1 Introduction
This brief report summarises available data on plastic consumption and waste
management in the UK, both historic trends and future projections.1 Future projections
for plastic consumption, waste growth and management routes are based on forward
projections of key measures (such as GDP) which show a demonstrable correlation with
changes in consumption, and also take into account the potential impact of current and
upcoming European legislative measures. The data presented here were taken from a
range of data sources, including Eurostat, Plastics Europe, and other industry
associations and national statistical bodies. Full details of data sources are available in
the annex to the Plastics Strategy report prepared by Eunomia on behalf of the European
Commission.2
1.2 Plastic Consumption in Europe
Data on the total production of plastics and demand by consumers is available only for
the 28 EU member states (‘EU28’) collectively. The total demand for plastic waste
increased from 47.5 million tonnes in 2005 to 52.5 million tonnes in 2007.3 Over the next
two years, the impacts of the financial crisis led to a reduction in demand down to 45
million tonnes in 2009. Since this time, demand levels have fluctuated but are on a
general uptrend, and the most recent data (2015) reports demand of 49 million tonnes.
Total plastics production was 58 million tonnes in 2015, suggesting that 16% (9 million
tonnes) of plastics produced in the EU28 is exported outside the EU. Around half of all
the plastics consumed in the EU in 2014, the latest year for which waste data is available,
became waste or went into stocks (for example into vehicles or buildings).
1
All sources of plastic waste are included in this analysis, split across the following sectors: non packaging
household (e.g. housewares, toys, leisure equipment etc); packaging; construction and demolition; waste
from electrical and electronic equipment (WEEE); automotive; agriculture; fishing / aquaculture; and
other.
2
ICF & Eunomia Research and Consulting Ltd (2018) Plastics: Reuse, Recycling and Marine Litter, Report for
DG Environment
3
These figures do not include plastics in imported products or packaging, and nor do they take account of
the use of secondary plastics. Hence they are (i) an underestimate, and (ii) the proportions may differ once
imports are taken into account.
WWF – Plastics Consumption 11.3 UK Plastic Waste Generation
Of the total plastic waste generated in the EU in 2014, 4.9 million tonnes was generated
in the UK. Based on forward projections, current (2018) waste arisings are estimated at
5.2 million tonnes, and are forecast to increase to around 6.3 million tonnes by 2030 – a
20% increase over this 12 year period. This is a significant increase in the quantity of
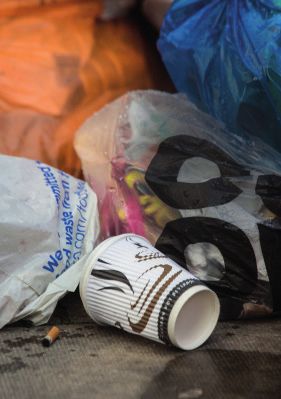
plastic waste. The sources of this waste by sector are shown in Figure 1. Packaging
accounts for the majority (67%) of the UK plastics waste stream. Higher than the
proportion across the EU, which is most likely due to a much stronger market for
convenience food in the UK compared to many other European countries, either from
takeaway restaurants or pre-packaged, often single serve, food in supermarkets. In
addition, it is important to point out that the generation of packaging waste indicated
here is considered higher than reported in official statistics, due to likely under-reporting
of waste through EPR schemes. This issue is set out in a recent report by Eunomia.4
Figure 1: Sources of Plastic Waste in the United Kingdom, by Sector
Figure 2 presents the total forecast waste arisings in 2018 and 2030, and the overall %
change in waste growth over this 12 year period.
Some further points on these forecasts for key waste streams are as follows:
Packaging – Consumption levels are expected to continue to grow in line with
positive economic forecasts. Considerable light-weighting of bottles has already
been achieved, so unit weights may not fall much beyond current levels.
4
http://www.eunomia.co.uk/reports-tools/plastic-packaging-shedding-light-on-the-uk-data/
2 26/03/2018 Construction & demolition – C&D waste growth is coupled with GDP growth,
however, as one recent study has shown, for more wealthy countries such as the
UK, which have adopted more resource efficient behaviour, waste arisings will
increase at a slower pace than overall economic growth. However, the
proportion of plastic in C&D is changing over time, with increases due to more
plastic components being used in new buildings and from more modern buildings
(with more plastic used in their construction) being demolished.
Automotive – historic waste arisings of end-of-life vehicles (ELVs) were shown to
correlate with the number of vehicles registered 11 years previously – equivalent
to the average age of the EU car fleet. Vehicle numbers are expected to continue
to rise, as well as historical and expected changes in the plastic composition of
vehicles. This has increased from 13% in 1990 to 16% in 2010, and by 2020 this is
predicted, by one source, to increase to 18%.
Figure 2: Projected Waste Arisings in 2018 and 2030
1.4 Recycling Rates and other Waste Management
Routes
According to the latest available data (2014), 26% of UK plastic waste was recycled. A
small fraction (< 1% was littered) and the remaining waste was sent to residual disposal.
55% of generated waste was disposed of at landfill sites, and a further 18% sent to
energy recovery (incineration). Higher recycling rates, of 38% and 40% respectively are
achieved for packaging and construction waste – 85% of all plastic recycling is packaging
material. However, as the recent Eunomia report indicates (see above) the UK’s
packaging recycling rate is very likely to be overstated. Recycling rates for automotive
WWF – Plastics Consumption 3and agricultural plastic waste are in the range of 11-14%, whilst all other sectors have
recycling rates lower than 6%.
It is estimated that 31% of plastic waste is currently (2018) recycled, and this is
projected to increase to 42% by 2030 as a result of future policies taking effect. The
proposed revisions to the Packaging and Packaging Waste Directive, which specify a 55%
plastic packaging target by 2025, have the greatest impact on the overall recycling rate.
Energy recovery is predicted to become the second largest plastic waste destination,
driven primarily by the Waste Framework Directive revisions, which include a maximum
level of landfilling of 10% by 2030. Rates are forecast to increase from a current (2018)
estimated rate of 23% to 39% in 2030 – a 16% increase in energy recovery.
However, increased incineration is not necessarily good for the environment, and there
is an increasingly strong case against this management option.5 Burning plastic creates
harmful dioxins and if incinerators are inefficient, these leak into the environment,
although modern incinerators are said to have largely solved this problem. Climate
change is another consideration – after coal, incinerators are the most CO2-intensive
form of generation. Environment groups also fear that if the UK builds new incinerators
to cope with the stockpile created by China's rejection of waste plastic, this will lock in
demand for burning waste plastic that ideally should get recycled.
5
http://www.bbc.co.uk/news/science-environment-43120041
4 26/03/20182.0 Key Single Use Plastic Products
2.1 Introduction
This brief report summarises available data on single use plastic consumption and waste
management in the UK, both historic trends and future projections, and considers the
UK’s performance relative to other European countries. The data presented here was
primarily taken from market reports for each product type under license. European and
national statistical databases, reports written by trade bodies and consultancies, and
academic studies were also used as data sources. Full details of data sources are
available in the annex to the Plastics Strategy report prepared by Eunomia on behalf of
the European Commission.6 The latest year of available data for most of the information
presented here is 2016, with a few data points from 2015 and 2017. From this point
onwards, future projections are applied. Consumption forecasts are sourced from
market reports and projections for recycling rates and other management routes are set
based on the potential impact of current and upcoming European legislative measures.
2.2 Plastic Consumption
Data on the number of items consumed each year in 2018, for the range of single use
plastic item types included in this analysis, are shown in Table 1.7 The consumption per
capita was calculated and then used to rank the UK against the other EU28 Member
States (a ranking of 1 would indicate that the UK has the highest consumption per capita
of any Member State). Overall, the UK ranks 5th highest in the EU for consumption of
single use plastic products, although this rank is somewhat skewed by cigarette filters,
for which the UK has lower consumption than all but three countries. Citizens in the UK
consume more cotton buds and sanitary towels than in any other Member State, and
have the 2nd highest consumption for 7 other items.
Table 1: UK Plastic Consumption and Ranking within EU28
Consumption (2018), billion Ranking within EU28 based on
Product
items consumption per capita
Cotton buds 13.2 1
Sanitary towels 4.1 1
Crisp packets 8.3 2
6
ICF & Eunomia Research and Consulting Ltd (2018) Plastics: Reuse, Recycling and Marine Litter, Report for
DG Environment
7
Note that as the items are single use and so are quickly disposed of, these consumption statistics are
equivalent to waste generated.
WWF – Plastics Consumption 5Consumption (2018), billion Ranking within EU28 based on
Product
items consumption per capita
Wet wipes 10.8 2
Cutlery 16.5 2
Straws 42.0 2
Stirrers 44.1 2
Drinks cups and lids 4.1 2
Food containers 5.2 2
Sweet wrappers 6.0 8
Drinks bottles 10.1 9
Cigarette filters 45.8 25
Total 210.2 5
Figure 3 shows how consumption is forecast to change from 2018 to 2030, and the
overall % growth over this 12 year period. A significant growth in consumption is
forecast for most product types, with 8 out of the 12 products estimated to demonstrate
growth of over 20% during this period. Negative growth rates are projected for cigarette
filters and cotton buds. For cigarette filters it is predicted that recent negative trends in
smoking burnable tobacco will continue, while plastic cotton buds are increasingly being
replaced by non-plastic alternatives.
6 26/03/2018Figure 3: Projected Consumption in 2018 and 2030
2.3 Recycling Rates and other Waste Management
Routes
Most types of single use plastic products are not easily recyclable. The overall UK
recycling rate for single use plastic products for 2018 (based on projections from the
latest year of data – 2016) is estimated at 29%, the majority of this recycling is from
drinks bottles, however, which have a 56% recycling rate. Stirrers and food containers
have recycling rates of less than 10%, while all other product types are rarely recycled,
with recycling rates of less than 1%.8
Recycling rates are unlikely to increase by much in the future. The projected rate for
2030 is 37%, an increase of only 8% in 12 years. The main driver of this change is the
proposed revisions to the Packaging and Packaging Waste Directive, which set a 55%
plastic packaging recycling target by 2025. This policy is expected to mainly impact the
recycling of larger SUP items, such as bottles and food containers. The projections used
here assume that the UK will achieve a 70% recycling rate in 2030 for plastic bottles,
similar to the maximum recycling rate found in countries without a deposit return
scheme. For food containers, it was assumed that the recycling rate increases to 25% by
8
ICF & Eunomia Research and Consulting Ltd (2018) Plastics: Reuse, Recycling and Marine Litter, Report for
DG Environment
WWF – Plastics Consumption 72030. Small increases, up to a maximum of 5% recycling by 2030, are projected for
cutlery, straws, stirrers and drinks cups.
The remaining waste is sent to residual disposal, mainly landfill (48%), with the
remainder (22%) sent to energy recovery (incineration) facilities. Energy recovery is
predicted to become the second largest plastic waste destination in the future, driven
primarily by the Waste Framework Directive revisions, which include a maximum level of
landfilling of 10% by 2030. Rates are forecast to increase to 34% in 2030 – a 12%
increase in energy recovery.
2.4 Litter
Current litter and flushing rates were estimated from a review of available data on the
quantity of litter dropped, litter compositions and rates of items flushed down toilets. 9
The rate of littering / flushing of plastic items is estimated at 7% (of total plastic
consumption) for the UK in 2018, a total of 24 billion items. A breakdown of the quantity
of litter and litter rates by product type is provided in Table 2.
Table 2: UK Litter Quantities and Litter Rates (2018)
Product Litter quantity, billion items Litter Rate, %
Cigarette filters 14.6 31.9%
Drinks bottles 0.7 6.9%
Cotton buds* 1.8 13.5%
Crisp packets 0.3 3.7%
Sweet wrappers 0.2 3.1%
Wet wipes* 3.4 31.3%
Sanitary towels* 0.9 21.3%
Cutlery 0.1 0.5%
Straws 1.3 3.1%
Stirrers 0.1 0.2%
Drinks cups and lids 0.5 13.1%
Food containers 0.3 5.1%
9
Ibid.
8 26/03/2018Product Litter quantity, billion items Litter Rate, %
All products 24.1 7.0%
*flushed items
WWF – Plastics Consumption 9• A PLASTIC FUTURE – PLASTICS CONSUMPTION AND WASTE MANAGEMENT IN THE UK
COVER IMAGE © ELIZABETH DALZIEL / WWF/UK
WWF.ORG.UK
For a future where people and nature thrive wwf.org.uk
© 1986 panda symbol and ® “WWF” Registered Trademark of WWF. WWF-UK registered
charity (1081247) and in Scotland (SC039593). A company limited by guarantee (4016725)You can also read