Equity mapping:
Visualizing community vulnerability to COVID-
19 and vaccine access

U.S. Public Health Accompaniment Unit
14 September 2021
←
→
Page content transcription
If your browser does not render page correctly, please read the page content below
Equity mapping: Visualizing community vulnerability to COVID- 19 and vaccine access U.S. Public Health Accompaniment Unit 14 September 2021
Context for these materials

 This deck is intended to provide guidance for community leaders in the use of mapping processes
 that proactively engage community members in the co-creation of vaccination information resources
 and vaccination opportunities.
 Mapping and visualization are discussed here in relation to COVID-19 vaccines and developing
 equitable systems for vaccine distribution. The concepts and the tools discussed are applicable to
 other health issues, and relevant for strengthening community engagement outside of the current
 pandemic context.

The ideas presented in this deck reflect the latest public health thinking and scientific evidence as of
September 2021. However, the COVID-19 landscape is changing dramatically daily, and so must our
recommendations over time.

Partners In Health does not provide medical advice, diagnosis or treatment in the United States. The
information, including but not limited to, text, graphics, images and other material contained in this
slide deck, are intended for informational purposes only.
Strategic planning for equitable vaccine access

Deployment of COVID-19 vaccine in the United
States has again highlighted the
pervasive inequity of our health system, leaving
the most vulnerable communities more likely to
experience severe health and economic
consequences as a result of under-vaccination.

For vaccine rollout to be efficient and
equitable, distribution plans must be:
• Evidence-based
• Community-driven
• Inclusive of resource opportunities and
  constraints
                                                   Source: Surgo Ventures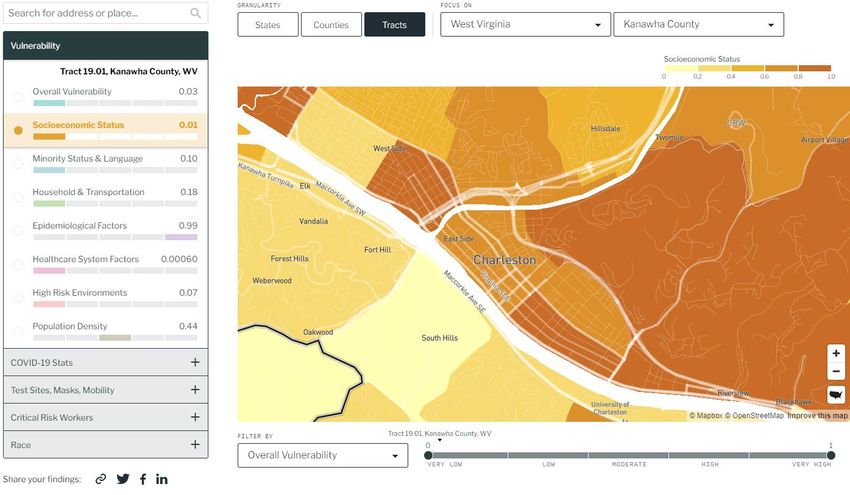
From abstraction to reality: transforming data through
   mapping

Mapping is an accessible data visualization approach that
can be used to spark discussion and drive collaborative      Mapping adds visual context to quantitative data,
planning among community stakeholders with the                 highlighting the spatial reality for vulnerable
shared goal of improving vaccine access.                     communities versus where resources are located.

Visualizing equity and access through mapping can:
• Illuminate key aspects of vaccine supply and demand
• Highlight where health care and community resources
   are situated
• Visually represent patterns of historical and structural
   marginalization

Readily available mapping tools paired with deliberate
 and inclusive processes can enhance transparency in
   decision-making and elicit community insights.
                                                                                                          Source: NPR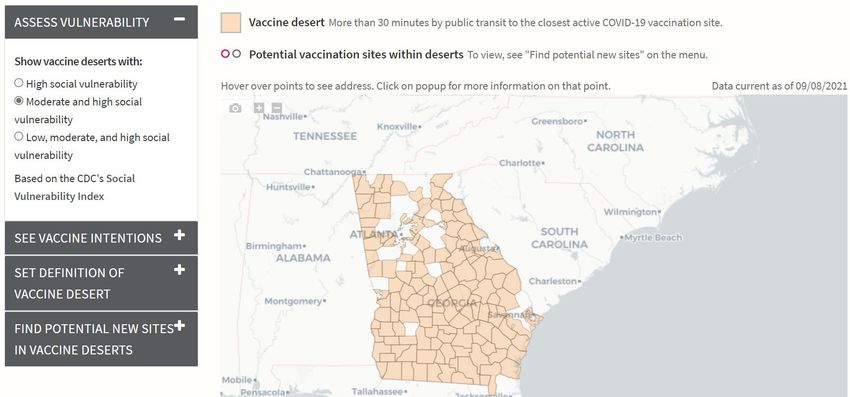
Overview of mapping process: 4 steps to drive equitable
  vaccine distribution

       1. Plan              2. Map            3. Engage            4. Act

     Convene             Synthesize       Collaboratively     Deploy resources.
  stakeholders.        available data.    explore results.     Follow up with
Identify priorities.     Generate        Identify areas of    further analysis.
                          visuals.       vulnerability and
                                         discuss solutions.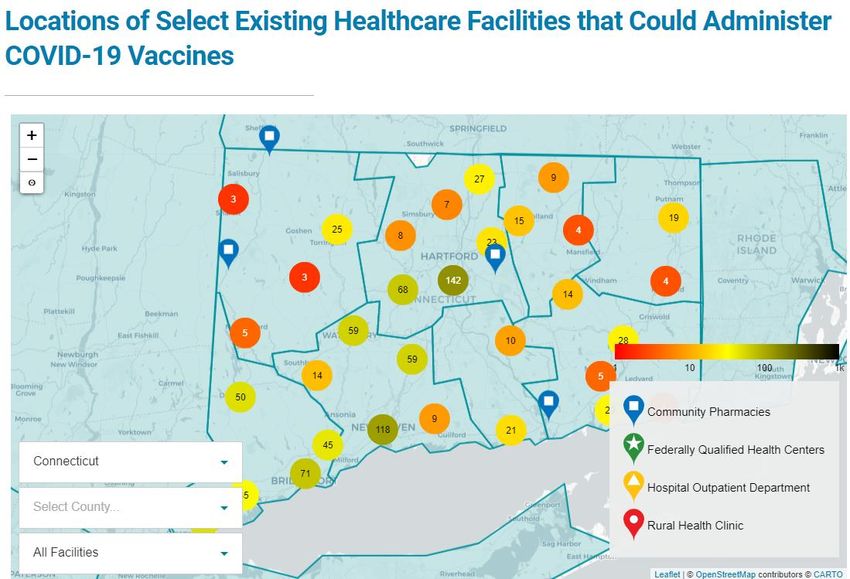
Mapping process in detail

           Plan                       Map                    Engage                        Act

                            Synthesize equity and        Explore data
 Convene stakeholders                                                               Deploy resources
                                 access data        and facilitate discussion
• Community members         Demographic data:
• Community-based           • Race and Ethnicity
                            • Age                     • Vaccine site            • Mobile units
  organizations
                            • Population density        clusters and gaps       • Pop-up clinics
• Local Health Department
                                                      • Multiple                • At-home vaccination
• Faith-based               Infrastructure data:
                                                        perspectives of         • Transportation
  organizations             • Current and planned
                                                        vulnerability             opportunities
• Health systems (FQHC,        vaccination sites
                                                      • Layered                 • Social and medical
  hospitals)                • Transit routes
                                                        perspectives              resources
• Retail Pharmacy           • Walkability
• Local transit, housing    • Community resources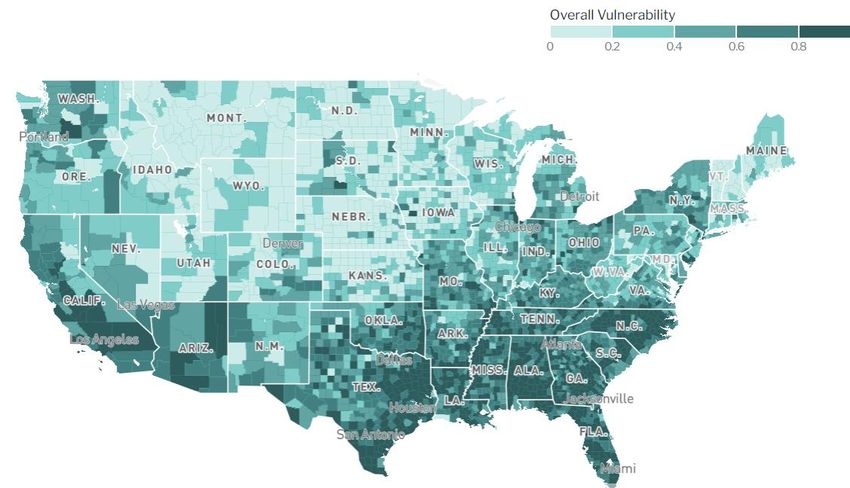
1. Determine priority analyses with community stakeholders

                            Plan                         Map                        Engage                          Act

                    1 What are the anticipated vaccine access issues in your community?
                         • Inadequate public transportation and infrastructure                 Data requirements for mapping
                         • Scarcity of vaccination locations, vaccine allotments
                                                                                           • Quality: trustworthy data sources that
Guiding questions

                         • Vaccine hesitancy
                                                                                             include your geographical area of focus
                         • Limited community engagement
                                                                                             (e.g., ACS, surveys from systematic CHW
                    2 What demographic and social factors exacerbate barriers to access?     outreach, etc.)
                         • Poverty
                         • Advanced age and mobility                                       • Relevance: data sufficiently represents
                         • Co-morbidities                                                    phenomena of interest (e.g., low-SES as
                         • Work environment                                                  proxy for resource-constrained)
                    3 What assets exist in the community?                                  • Actionability: Indicators representing
                         • Vaccination sites & testing infrastructure                        resources, vulnerability, vaccine
                         • CBOs, Faith-based organizations                                   information, and vaccine outcomes can
                         • Places of worship, public spaces (e.g. libraries)                 be modified through intervention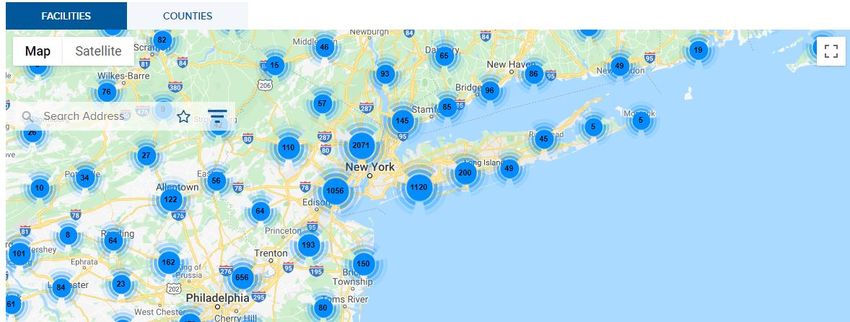
Consider different data when using mapping platforms or
  creating custom maps

    Start simple—examine single
dimensions of access and vulnerability,                                                Social
                                                                 US Census          Vulnerability
  and expand analyses as additional                                                  Index (SVI)
            questions arise                                                       COVID-19 Community
                                              Centralized,    COVID-19 cases,
                                                                                   Vulnerability Index
                                            systematic data     mortality               (CCVI)
  Ready-made resources:   Do it yourself
  • Surgo Ventures        tools:                                                      Places of
  • RTI                   •ArcGIS                             Vaccine locations
                                                                                      worship
  • Westhealth Vaxmap     •Shiny R Studio
  • Johns Hopkins         •Excel             Community-        Transportation
  • RxOpen                •Google maps      generated data                             Schools
                                                                hubs/routes
  • Vaccine allocation
                                              Community                               Libraries,
  • Google maps                                                 Health care
                                            health outreach                          community
                                                                 facilities
                                               locations                               centers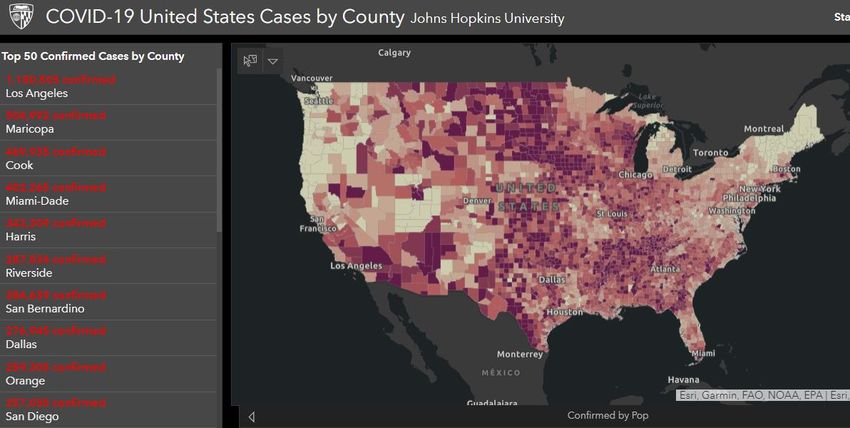
2. Use existing tools to generate maps

            Plan       Map                     Engage   Act

                                Facilities able to
                               administer vaccines
                               Westhealth Vaxmap

    COVID-19
   Community
Vulnerability Index                                     Places of worship
      (CCVI)
                                                          Google maps
 Surgo Ventures
Or compile data to generate custom visuals

    Plan               Map            Engage                        Act

                                   Place of
                                   worship

                    Darker                     Vaccination
                                                  site
                   shading
                  indicates
                   greater
                 vulnerability                     Sources: Surgo Ventures &
                                                   ArcGIS
3. Explore maps with community members
Plan Map Engage Act
What features stand out? What isn’t visualized? What interventions should occur? Where?
• Disparities and/or trends in Community members can Community engagement:
vulnerability and access, between and highlight access opportunities • Areas under-represented
across map locations and barriers that don't show up • Areas where information has been
• Resource clusters and gaps on initial visualization (e.g., inconsistently available, and hesitancy
(vaccination sites, community current community outreach may be a factor
infrastructure) initiatives, CHW coverage, Vaccine sites:
• Proximity of community resources trustworthiness of clinics, unsafe • Pharmacy and health care “deserts”
within areas of varying demographic areas for walking, etc.) • Co-location with social care resources
and social make-up
Collaborate with epidemiologists to increase accuracy and consistency of
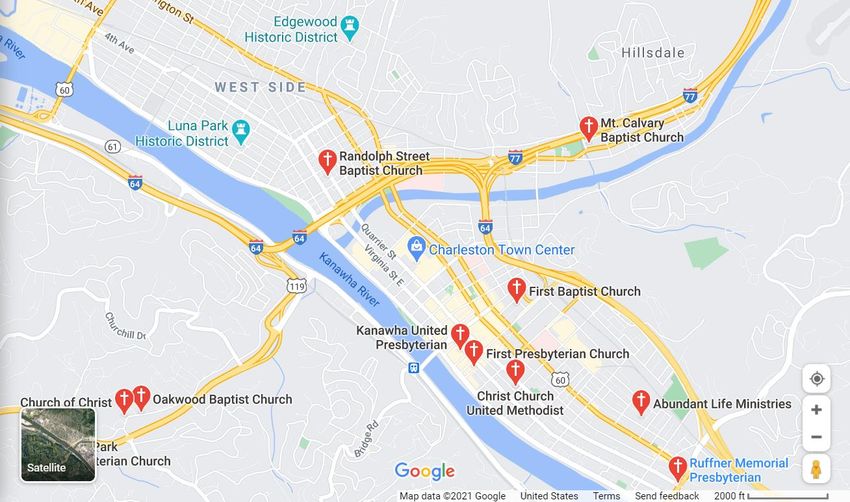
analyses, and to help ensure alignment between stakeholders.Explore mapped resources and gaps with community members
Plan Map Engage Act
Where should
interventions occur?
Possible site for mobile
vaccination
What features stand out?
Census tract with high
vulnerability (CCVI), and no What isn’t visualized?
vaccine sites Does public transit allow
sufficient access for those Sources: Surgo Ventures &
ArcGIS
without cars?From questions to collaboration: Integrating community voices in data
analysis
Including community members in
mapping exploration and discussions Mapping and other visuals used in
ensures that: planning equitable vaccination can be
• Data is subject to diverse discussed alongside other information
interpretations during:
• Decision-making is transparent, • Community town halls
and accountable to community • CBO-hosted webinars
interests • Ongoing community outreach by
• Planned initiatives and trade-offs • trusted messengers
are proactively workshopped and
socialized4. Determine course of action based on shared insights
Plan Map Engage Act
Prioritize solutions:
• Community outreach How can accountability be ensured?
• Vaccine site establishment and operations
• Encourage decision-making authorities
• Social and medical resource coordination with vaccine sites
to utilize maps AND include community
Coordinate efforts: perspectives in their creation and
interpretation
• Leverage community and faith-based organization outreach
mechanisms, and infrastructure • Revisit maps at subsequent public fora,
highlighting resource allocation changes
• Determine roles and responsibilities among government, or on-going implementation challenges
technical, medical, and community partners based on
experience working in the communityData considerations and interpretation of results
Assess the quality of your data:
• Reliability: Who is the publisher? What sources have they used?
• Relevance: When was the dataset last updated?
• Completeness: How comprehensive is the dataset?
• Equity: Is your data disaggregated? Along which dimensions?
Determine scale of your analysis:
• At what level are you examining and interpreting vaccine access
information?
• At what level do you need data for your analysis (e.g., state, county,
census tract)?
Orient towards action: Will the results yield useful information? Is mapping
going to drive decision-making, or is it purely a thought exercise?
Interpret critically: Patterns or gradients of vulnerability, and perceived
distance to resources may be artificially enhanced in some maps and not
accurately reflect real-life disparities or access barriers
Source: CDCPlatforms for mapping Using existing tools for visualizing resources and gaps
Using existing tools: Mapping Vaccine Desserts

This platform displays vaccine desserts. Such information can help with prioritizing
equitable vaccine outreach and identifying gaps in vaccine deployment. Different
dimensions of vaccine deserts can be visualized at state and zip code levels.

                                                Learn more at Vaccine Equity Planner
Using existing tools: COVID-19 among American Indians/Alaskan Natives
This platform displays COVID-19 disease burden among America Indians/ Alaskan
Natives across multiple dimensions (cases, deaths, etc.). Information can be
visualized by state, county, or census tract.
Learn more at Urban Indian
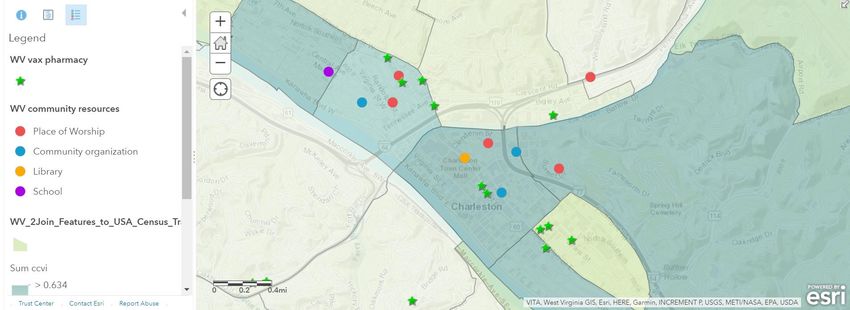
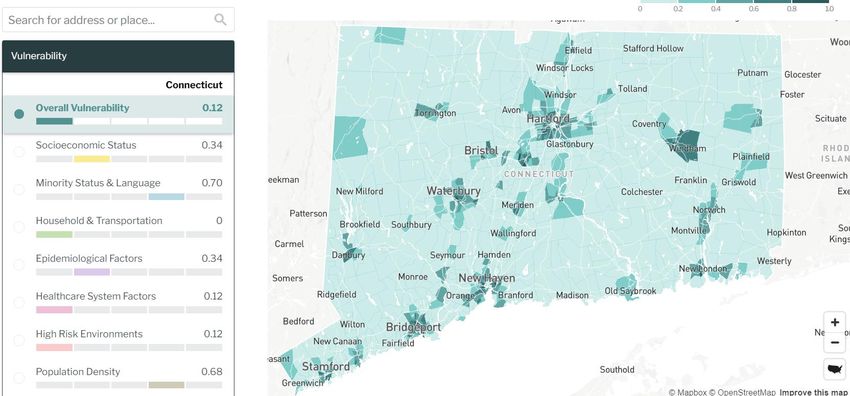
Health InstituteUsing existing tools: Mapping community vulnerability
These platforms display social vulnerability. Such information can help with
prioritizing vaccine distribution locations and deploying outreach efforts. Different
dimensions of vulnerability can be visualized at state, county, or census tract level.
Learn more at Surgo Ventures Learn more at CDCUsing existing tools: Vaccine site locations
These platforms display vaccine sites. Quantity and distribution of sites can be estimated
for various geographic levels, and specific locations can be identified at the street level
by zooming in.
Learn more at RxOpen Learn more at Westhealth VaxmapUsing existing tools: COVID-19 information
This platform displays COVID-19 disease burden across multiple dimensions (cases,
deaths, etc.). Information can be visualized by state, county, or census tract.
Learn more at Johns HopkinsUsing existing tools: Integrated perspectives
This platform integrates vulnerability, COVID-19 statistics, and vaccine infrastructure data.
Users can visualize where vaccine sites are located relative to disease burden and
vulnerability and highlight possible gaps.
Learn more at RTI InternationalThank You!
Visit PIH.org/usphau
U.S. Public Health Accompaniment UnitYou can also read