Deformation analysis for Padang earthquake using GPS data
←
→
Page content transcription
If your browser does not render page correctly, please read the page content below

Journal of Physics: Conference Series

PAPER • OPEN ACCESS

Deformation analysis for Padang earthquake using GPS data
To cite this article: Rahmat Iqbal et al 2021 J. Phys.: Conf. Ser. 1876 012029

View the article online for updates and enhancements.

                                This content was downloaded from IP address 46.4.80.155 on 17/08/2021 at 15:53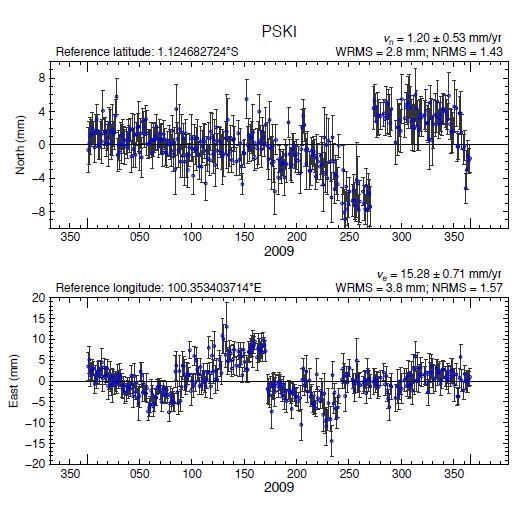
3rd International Conference on Research and Learning of Physics (ICRLP) 2020             IOP Publishing
Journal of Physics: Conference Series            1876 (2021) 012029 doi:10.1088/1742-6596/1876/1/012029

Deformation analysis for Padang earthquake using GPS data

                     Rahmat Iqbal1, Syafriani1*, D Arisa2, B Setiadi2
                     1
                       Department of Physics, Faculty of Mathematics and Natural Sciences, Universitas
                     Negeri Padang, Jl. Prof Hamka, Padang 25131, Indonesia
                     2
                       Research Center for Geotechnology, Indonesian Institute of Sciences, LIPI, Jl.
                     Sangkuriang, Bandung 40135, Indonesia

                     *syafri@fmipa.unp.ac.id

                     Abstract. On September 30, 2009, an Mw 7.6 earthquake occurred off the coast of Sumatra.
                     This earthquake caused deformation in the area around the center of the earthquake. Surface
                     deformation in the area around the epicenter was Analyzed carried out using GPS data from the
                     SuGAr (Sumatran GPS Array) network. The observed SuGAr stations were TIKU, PSKI,
                     NGNG and MSAI. Data processing used GAMIT / GLOBK software. GPS data were observed
                     for 100 days before and after the main earthquake occurrence. The measurement results
                     indicate that the MSAI and NGNG stations in Mentawai deformed towards the south-weast
                     direction, varies between 38 - 50 mm, and TIKU and PSKI stations on the mainland of
                     Sumatra were deformed in north-west directions, varies from 5 - 12 mm. This indicates that
                     this Earthquake deformed the area of Western Sumatra and nearby Mentawai regions, in
                     Siberut Island.

1. Introduction
West Sumatra Province is a province where earthquakes often occur. This region includes part of the
Eurasian plate and the Indian Ocean plate which moves slowly following its direction. The province of
West Sumatra is located in the western part of Sumatra Island, which is part of the Eurasia Plate and
Indian Ocean which moves very slowly and is relative to the southeast and north with speed about 0.4
- 7 cm/year[1]. This region also has faults, namely the Sumatra Fault and the Mentawai Fault. The
Sumatra Fault System moves across the island of Sumatra while the Mentawai Fault Zone an
ascending fault around the Mentawai islands [2]. This causes West Sumatra Province to have a high
level of seismicity. One of the earthquakes with a high seismic level occurred on September 30, 2009
in West Sumatra.
    The earthquake that occurred had a high enough magnitude, causing severe damage to several areas
in West Sumatra. Earthquakes occur due to vibrations and shaking on the surface due to the release of
seismic wave energy in the earth's crust. This energy respiration causes deformation of tectonic plates
in the earth's crust[3]. This large earthquake has a strength of Mw 7.6 at a depth of 80 km in West
Sumatra[4]. Several areas in West Sumatra major building damage, where 135,448 houses with severe
damage, 65,380 houses with moderate damage, and 78,604 houses with minor damage[5]. The large
amount of damage to infrastructure and other material losses was caused by the earthquake.
    The movement of deformation changes can be done with a geodetic approach, namely using InSAR
technology (Interferometry Synthetic Aperture Radar) and GPS (Global Positioning System)
technology. The suitable technology for measuring deformation due to seismicity is GPS, because it
              Content from this work may be used under the terms of the Creative Commons Attribution 3.0 licence. Any further distribution
              of this work must maintain attribution to the author(s) and the title of the work, journal citation and DOI.
Published under licence by IOP Publishing Ltd                          1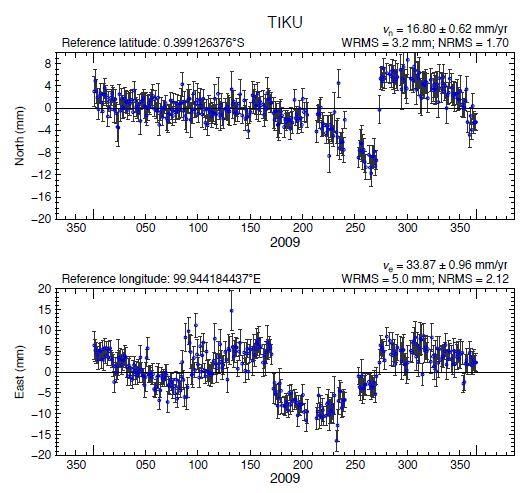
3rd International Conference on Research and Learning of Physics (ICRLP) 2020             IOP Publishing
Journal of Physics: Conference Series            1876 (2021) 012029 doi:10.1088/1742-6596/1876/1/012029

has a higher order precision compared to InSAR[6]. GPS technology can provide vector values for the
deformation of the earth's crust in three dimensions, meaning that GPS can provide deformation
information in horizontal and vertical directions with a degree of precision up to the order of
millimeters and good consistency[7]. The islands of Sumatra and the Mentawai Islands have GPS
stations that are used to store tectonic plates, namely the SuGAr (Sumatran GPS Array) station. The
SuGAr used is installed and operated by the Earth Observatory of Singapore (EOS) and the Indonesian
Institute of Sciences (LIPI)[8]. SuGAr works by recording the position of the station every time
interval (15 minutes) to find out the value of the shift or movement of the earth's tectonic plates in the
lithosphere layer. Based on the research that has been done, there is still little that discusses the
estimation of deformation changes due to earthquakes using GPS data.

     Figure 1. Geological map of the study area. The darkgreen circle shows the location of the
     SuGAr station used in the deformation analysis. Black beach-call shows Mw7.6 earthquakes
     that occurred 30 September 2009. Plate boundaries for megathrust were plotted based on
     Bird 2003 with additional plot for the Sumatran Fault and Mentawai Back Thrust[9].

2. Data and Methods
This research was be observed in a span of 100 days before (Preseismic), during (coseismic), and after
(pascaseismic) an earthquake occurred using GPS technology, also known as GNSS (Global
Navigation Satellite System) through the SuGAr station, Sumatran GPS Array (SuGAr) is GPS
stations spread along 1300 km along the west coast of Sumatra Island. SuGAr was initiated by
Professor Kerry Sieh, et al., from the California Institute of Technology (CalTech) Tectonics
Observatory (TO) in collaboration with the Indonesian Institute of Sciences (LIPI) in 2002. The total
number of SuGAr stations installed is 58 stations on Sumatra Island. The SuGAr station directly sends
data to the central server located on the LIPI Bandung and EOS Singapore campus. There are four
SuGAr stations used in this study, namely TIKU, PSKI, MSAI and NGNG.

                                                     2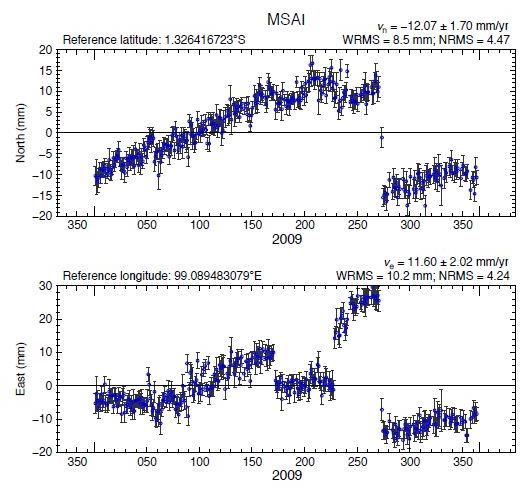
3rd International Conference on Research and Learning of Physics (ICRLP) 2020             IOP Publishing
Journal of Physics: Conference Series            1876 (2021) 012029 doi:10.1088/1742-6596/1876/1/012029

                              Table 1. Location of Station SuGAr used for analysis
No      Station                                   Coordinate
                           Location                                   First Epoch        Last Epoch
        Name                                Latitude     Longitude
1
     PSKI           Sikuai Island          -1.1247       100.3530     2009 01 02       2009 12 31
2
     TIKU           Tiku                   -0.3991       99.9442      2009 01 02       2009 12 31
3                   Muara Saibi,
     MSAI                                  -1.3264       99.0895      2009 01 02       2009 10 04
                    Siberut Island
4                   Nyang-Nyang,
     NGNG                                  -1.7996       99.2683      2009 01 02       2009 12 29
                    Siberut Island
   The form of data used in deformation analysis via GPS is in the RINEX (Independent Exchange
Receiver) format. The RINEX format is used to calculate the deformation associated with an
earthquake by using the changes in each point caused by the earthquake.This research was assisted by
using the GAMIT / GLOBK (GPS Analysis of Massachusset Institute of Technology) software (ver.
10.70) to obtain daily position data. GAMIT results were processed based on the Kalman Filtering
method using the program GLOBK (Global Kalman Filter VLBI and GPS analysis)[10]. Determination
of the Size and Shift Direction of the SuGAr Station. SuGAr observation data for 2009 which were
processed using GAMIT / GLOBK, resulted in data in the form of changes in the daily coordinate
position of the SuGAr station, namely the latitude and longitude positions[11].

      Figure 2. Position data from GLOBK which applied Kalman Filtering Method. Each point
                     (in dark blue) shows the observation data with the error bars.

                                                     3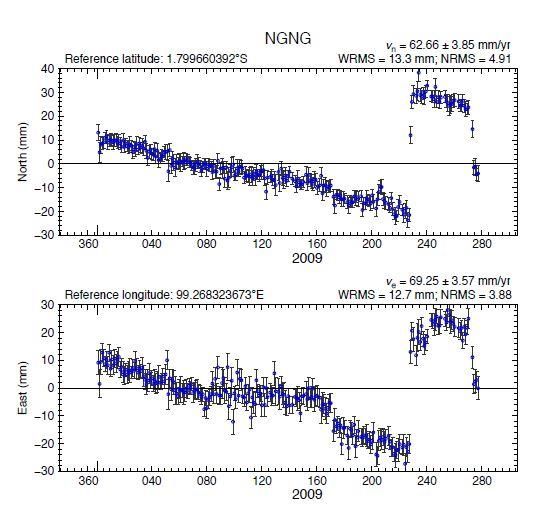
3rd International Conference on Research and Learning of Physics (ICRLP) 2020 IOP Publishing
Journal of Physics: Conference Series 1876 (2021) 012029 doi:10.1088/1742-6596/1876/1/012029
Figure 2 is a time series of 1 year position data from GLOBK which applied Kalman Filtering
Method. The error bars and NRMS value indicate the error level of the calculation, which seems quite
significant (WRMS = 5 mm) in TIKU due to the incomplete data, and WRMS < 3 mm for PSKI.
Other two stations: MSAI and NGNG are having largest WRMS because the calculation included the
correction of other earthquake occurred 47 days before Padang earthquake, and was centered closed to
this three sites.
The data on the change in position of each SuGAr station can be seen using the deformation shift
vector at each SuGAr station point calculated in the coordinate system using the equation:
dE12 ( E 2 E1 ) x111320 m (1)
dN 12 ( N 2 N1 ) x111320 m (2)
Where :
dE12 = Deformed of SuGAr Station to the east
dN 12 = Deformed of SuGAr Station to the north
E1 = Longitude position at the start of the SuGAr station
E2 = Longitude position at the last of the SuGAr station
N1 = Latitude position at the start of the SuGAr station
N2 = Latitude position at the last of the SuGAr station
1 degree (latitude or longitude) = 111320m
The value dE12 and dN12 obtained are still coordinates in degrees. To convert coordinates to
distance in meters is to multiply by the value 111320 m. The direction and magnitude of the
displacement of the SuGAr station can be determined by calculating the resultant shift vector of the
SuGAr station. The resultant amount is calculated using the equation :
R (dE12 ) 2 (dN 12 ) 2 2dE12 dN 12 cos (3)
Where :
R = Resultant deformaed SuGAr station
= The Angle formed dE12 and dN 12
Resultant direction is calculated using:
dN 12
tan
dE12
dN 12
arc tan (4)
dE12
Based on the results of processing assisted by GAMIT / GLOBK software, the value of the
deformation shift of the four observed stations is obtained:
43rd International Conference on Research and Learning of Physics (ICRLP) 2020 IOP Publishing
Journal of Physics: Conference Series 1876 (2021) 012029 doi:10.1088/1742-6596/1876/1/012029
MSAI
NGNG
PSKI
TIKU
Figure 3. Timeseries including seismic cycle (Pre-, Co-, and Post-seismic) recorded by
SuGAr. Green dashed vertical line is the epoch of Padang earthquake, and the grey dashed
line is other earthquake in Mentawai recorded by MSAI and NGNG in Siberut. Each point
(in dark blue) shows the observation data and and darkred is curve-fit for each observation.
Figure 4. Geological map of the area and measurement points
53rd International Conference on Research and Learning of Physics (ICRLP) 2020 IOP Publishing
Journal of Physics: Conference Series 1876 (2021) 012029 doi:10.1088/1742-6596/1876/1/012029
Figure 4 shows the SuGAr horizontal deformation vector in the preseismic phase from the first
available epoch (2009 01 02) to a day before the jump. It can be seen that SuGAr stations have
different horizontal shift directions but all indicated stable movement before the earthquake[9].
The coseismic phase is the process by which an earthquake occurs and causes a large deformation.
Figure 5 shows the vector displacement of the SuGAr station during the September 30, 2009 Padang
earthquake. Table 2 shows that SuGAr stations have various movement direction and opposite to the
preseismic direction.
Table 2: Coseismic Jump recorded on SuGAr stations
Horizontal
Lon Lon East North
Site name Movement Direction
(deg) (deg) (mm) (mm)
(mm)
MSAI 99.090 -1.326 -40.2 -31.1 50.83 south-west
NGNG 99.268 -1.780 -22.3 -30.8 38.03 south-west
PSKI 100.353 -1.125 -3.6 4.7 5.92 north-west
TIKU 99.944 -0.399 4.6 10.5 11.46 north-east
Figure 5. Map showing the coseismic jump of Padang Earthquake. Yellow arrows is
indicating the movement of each SuGAr station during the event, and red circle is indicating
error ellips with 95 confidence level[9].
3. Conclusions
From the RINEX processing of 4 SuGAr stations in 2009, before the earthquake occurrence, it can be
concluded that most stations in the Forearc Islands Mentawai is moving toward the south-west,
following the subduction trend of the Sunda megathrust, and this trend is also seen after the
earthquake.
63rd International Conference on Research and Learning of Physics (ICRLP) 2020 IOP Publishing
Journal of Physics: Conference Series 1876 (2021) 012029 doi:10.1088/1742-6596/1876/1/012029
For the of stations in the northeast Sumatra, the trend of deformation is supported by the
combination of subduction force towards the northeast and the dextral-strike-slip fault of Sumatran
Fault or Semangko Fault. Where, the measurement results indicate that the MSAI and NGNG stations
in Mentawai were moved south-west ward, varying between 38 - 50 mm, and TIKU and PSKI stations
on the mainland of Sumatra were deformed in north-west directions, varying from 5 - 12 mm. The
same trend of similarities for both preseismic and postseismic is seen in most mainland stations. in this
condition there is also no anomaluous behavior prior to this intraslab earthquake as a precursor to be
taken into account. This study also requires further analysis to model faults affecting the surrounding
area.
References
[1] Setyonegoro, W. 2011. Gempabumi Padang 30 September 2009 dan Potensi Tsunaminya. Buletin
Meteoorologi dan Klimatologi dan Geofisika. Vol.3 No.3
[2] Sieh, K., and Natawidjaja, D.H. 2000. Neotectonics of The Sumatera Fault, Indonesia. Journal of
Geophysical Researc. 105(B12) :28,295-28,326.
[3] Syafriani, Zalmi. N, Rahmat. T, dan Hamdi. A. 2018. Pemetaan Bahaya Gempabumi
Deterministik dengan pendekatan Peak Ground Acceleratiom (PGA) di Kota Padang. Pillar of
Physics 11(2).
[4] Madrinovella, I., Sri W., Irwan M. 2011. Relokasi Hiposenter Gempa Padang 30 September 2009
Menggunakan Metode Double Difference. JTM Vol. XVIII No. 1
[5] BNPB. 2009. Laporan Hasil Pusdalops BNPB jumat, 02 oktober 2009. Jakarta
[6] Gumilar, I., Abidin,H.Z., dan Hutasoit, L.M., 2012. Studi Pemantauan Penurunan Muka Tanah di
Cekungan Bandung dengan Metode Survei GPS dan InSAR, Indonesian Journal of Geospatial,
Vol.1, No. 4, hal 44-53, Faculty of Earth Science and Technology, ITB.
[7] Abidin, H. Z., Andreas, H., Meilano, I., Gamal, M., Gumilar, I., & Abdullah, C. I. 2009.
Deformasi koseismik dan pascaseismik gempa Yogyakarta 2006 dari hasil survei
GPS. Indonesian Journal on Geoscience, 4(4), 275-284.
[8] Abidin, H. Z, .2006. Penentuan Posisi GPS dengan Aplikasinya, Pradnya Paramita, Jakarta.
[9] Arisa. D, W. S. Priyanto, R. Iqbal, S. Syafriani. 2020. Pre- and Coseismic Analysis of the Mw7.6
Padang Earthquake 2009 from Geodetic Approach. Research Center for Geotechnology,
Indonesian Institute of Sciences (LIPI), Bandung, Indonesia
[10] Herring,T. A., King, R.W., Floyd, M. A., dan McClusky, S. C. 2018. GAMIT Reference Manual,
Departement of Earth Atmospheric and Planetery Sciences, Massachusetts Institute of
Technology.
[11] Van Sickle. 2015. GPS For Land Surveyor: 4th edition. CRC Press.
7You can also read