Social Determinants of Health and COVID-19 Among Patients in New York City
←
→
Page content transcription
If your browser does not render page correctly, please read the page content below
Social Determinants of Health and COVID-19 Among
Patients in New York City
Jennifer Woo Baidal ( jw3286@cumc.columbia.edu )
Columbia University Irving Medical Center
Amanda Y. Wang
Columbia University Vagelos College of Physicians & Surgeons
Katarina Zumwalt
Columbia University Mailman School of Public Health
Dahsan Gary
NewYork-Presbyterian
Yael Greenberg
NewYork-Presbyterian
Ben Cormack
NewYork-Presbyterian
Stephanie Lovinsky-Desir
Columbia University Irving Medical Center
Kelsey Nichols
Columbia University Irving Medical Center
Neil Pasco
Columbia University Irving Medical Center
Andres Nieto
NewYork-Presbyterian
Jessica S. Ancker
Weill Cornell Medicine
Jeff Goldsmith
Columbia University Mailman School of Public Health
Dodi Meyer
Columbia University Irving Medical Center
Research Article
Keywords: Covid-19, racial/ethnic disparities, testing, housing
DOI: https://doi.org/10.21203/rs.3.rs-70959/v1
License: This work is licensed under a Creative Commons Attribution 4.0 International License. Read Full
License
Page 1/9Abstract
Background: Covid-19 testing and disease outcomes according to demographic and neighborhood
characteristics must be understood.
Methods: Using aggregate administrative data from a multi-site academic healthcare system in New York from
March 1 – May 14, 2020, we examined patient demographic and neighborhood characteristics according to
Covid-19 testing and disease outcomes.
Results: Among the 23,918 patients, higher proportions of those over 65 years old, male sex, Hispanic ethnicity,
Medicare, or Medicaid insurance had positive tests, were hospitalized, or died than those with younger age, non-
Hispanic ethnicity, or private insurance. Patients living in census tracts with more non-White individuals,
Hispanic individuals, individuals in poverty, or housing crowding had higher proportions of Covid-19 positive
tests, hospitalizations, and deaths than counterparts.
Discussion: Variation exists in Covid-19 testing and disease outcomes according to patient and neighborhood
characteristics. There is a need to monitor Covid-19 testing access and disease outcomes and resolve racist
policies and practices.
Introduction
New York experienced a surge in patients with Covid–19 in 2020, with 188,545 cases in New York City through
May 14, 2020 [1]. Social determinants of health such as racism, income, and housing conditions play key
upstream roles in etiologies of health and health disparities [2]. A recent ecological study showed variation in
hospitalizations and deaths across New York City according to borough [3]. Variation in Covid–19 testing results
and disease outcomes according to both individual and neighborhood characteristics has not been reported. In
order to design approaches to contain Covid–19, the epidemiology of Covid–19 test results and disease
outcomes must be understood.
Here, we describe patient demographics and neighborhood social determinants of health among consecutive
patients who underwent Covid–19 testing at a multi-site health care system in New York. We also display the
geographic distributions of outcomes.
Methods
NewYork-Presbyterian (NYP) is the largest academic healthcare system in New York City, with more than 2
million encounters annually, and is a liated with both Columbia University Vagelos College of Physicians and
Surgeons and Weill Cornell Medicine. NYP encompasses 10 campuses located in New York City and
Westchester. In this retrospective, observational cohort study, patients of any age who underwent a Covid–19
test at NYP from March 1, 2020 through May 14, 2020 were included if their residential address was geocoded
to New York City. Results from nasal swab SARS-CoV–2 polymerase chain reaction (PCR) tests and
administrative data were used to categorize outcomes. Covid–19 outcomes according to demographic
characteristics, zip code, and census tract were obtained from existing aggregate administrative data across all
NYP campuses. Analyses were deemed non-human subjects research by the authors’ Institutional Review Board.
Page 2/9Covid–19 test results and disease outcomes were de ned in discrete categories as negative test, positive test
without hospitalization or known death (termed positive test), positive test with hospitalization but no known
death (termed hospitalized), and positive test with known death (termed known death). Patients were
represented once in the dataset. If a patient had multiple tests, the results of the most recent test were used.
Patient age, sex, race, ethnicity, insurance type according to each Covid–19 test and disease outcome were
provided in aggregate from administrative data. Patients with both Medicaid and Medicare were included only in
the Medicaid insurance category. Because data was provided in aggregate, counts of 1 were masked by
providing a count of 1.5 for zip codes and census tracts to summarize those areas with a range of 1 to 2
individuals. Aggregate counts for zip code and census tract according to Covid–19 outcome were calculated as
0, 1.5, and then ordinally for 2. Neighborhood characteristics were calculated using 2018 American Community
Survey data on race, ethnicity, poverty, and housing crowding in census tracts. Using descriptive statistics, we
calculated census tract characteristics by quintiles according to Covid–19 outcomes. To align with publicly
available maps of New York City which display data by zip code, zip codes were used to map the proportion of
negative tests; proportion of New York City Covid–19 cases attributable to NYP patients [4]; proportion of NYP
cases hospitalized without death; and death-to-case ratio to map using ArcGIS ArcMap (Version 10.6.1.
Redlands, CA: Environmental Systems Research Institute, Inc., 2018). Zip codes with fewer than 50 tests
performed at NYP were excluded from this visualization, as was Staten Island (only 1 zip code with 50 tests).
Results
Overall, 24,461 patients with mean age 51.9 (SD 22.2) years and 57.5% female had a test performed at NYP and
lived in New York City. Some patients had indeterminate test results, leaving a total 23,918 patients with
con rmed test results included here.
Table 1 shows patient demographic characteristics according to Covid–19 test results and disease outcomes
for those with con rmed test results. Mean age was lowest among those with negative tests and highest among
those with known death. The majority of females had negative tests while males had higher proportions of
positive tests, hospitalizations, and deaths. Hispanic patients tended to have a lower proportion of negative
tests and higher proportion of hospitalizations and deaths than other racial/ethnic groups. Compared to those
with private insurance or other payor type, patients with Medicare or Medicaid had lower proportions of negative
tests and higher proportions of positive tests, hospitalizations, and known deaths.
Table 1 and Figure 1 show neighborhood characteristics according to Covid–19 test results and disease
outcomes. Those living in neighborhoods with fewer non-White individuals, fewer Hispanic/Latino individuals,
fewer individuals living below the federal poverty line (FPL), or less housing crowding tended to have higher
proportions of negative Covid–19 tests and lower proportions of hospitalizations and known deaths compared
to those in neighborhoods with more non-White individuals, more Hispanic/Latino individuals, more individuals
living below the FPL, and more housing crowding.
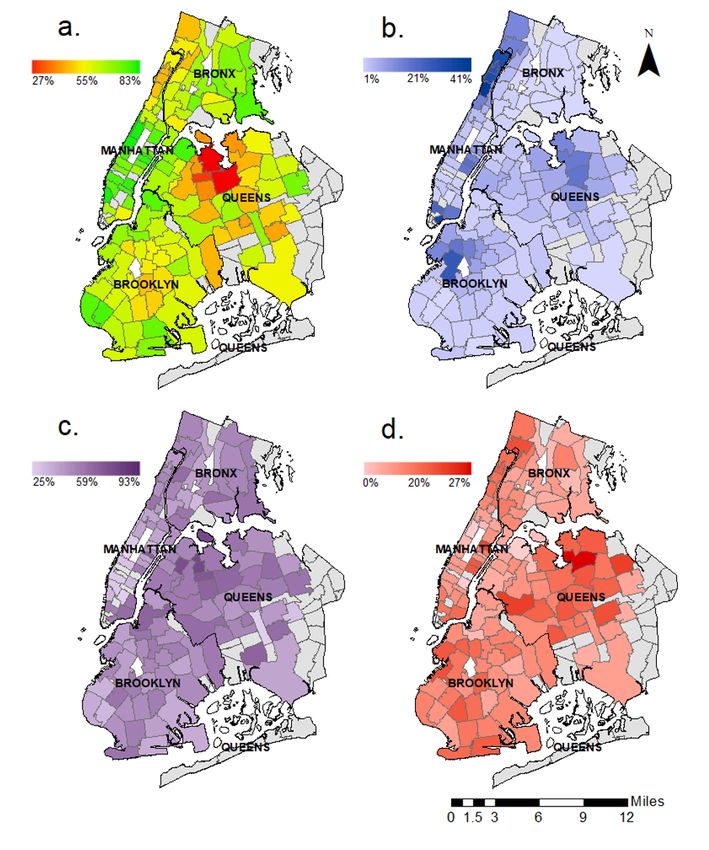
Figure 2 shows maps of Covid–19 test results and disease outcomes among NYP patients in New York City.
NYP patients made up a substantial proportion of New York City cases of Covid–19 in northern Manhattan, the
lower tip of eastern Manhattan, and parts of the Bronx, Brooklyn, and Queens. Lower Manhattan, northern Bronx,
and parts of Brooklyn had a high proportion of negative tests; these are all relatively a uent areas of the city.
Page 3/9Some zip codes in Queens had the highest rates of Covid–19 positive tests, hospitalizations, and known deaths
for NYP patients.
Discussion
In this large sample of consecutive patients in a multi-site healthcare system in New York, differences in Covid–
19 test results and disease outcomes according to age, sex, race/ethnicity, and insurance types were identi ed.
Variation according to neighborhood-level social determinants of health and zip code existed. Those living in
census tracts with more racial/ethnic minorities, individuals living in poverty, and more housing crowding had
higher proportions of Covid–19 positive tests, hospitalizations, and known deaths than counterparts in other
neighborhoods.
These results align with New York City data that show Hispanic/Latino individuals have the highest death rates
from Covid–19, and that case rates are higher among those living in northern Manhattan and the outer
boroughs than those in the more a uent areas of Manhattan [5]. These ndings also suggest that those living
in neighborhoods with more poverty and housing crowding—which are social determinants of health rooted in a
history of structural racial and ethnic segregation and discrimination [6]—had higher proportions of positive
tests, hospitalizations, and deaths. A higher proportion of negative tests were found in more a uent,
predominantly White neighborhoods, which could signal greater testing accessibility and less severe disease in
those neighborhoods compared to neighborhoods with greater poverty and more racial/ethnic minorities.
Notably, however, as shown in Figure 1, the proportion hospitalized and died was slightly lower in the
neighborhoods with the highest poverty than in neighborhoods with the next level of poverty, a disruption in the
pattern which may re ect lack of access to healthcare rather than improved outcomes. Our results also align
with ndings in a recent study of critically ill patients at two NYP hospitals a liated with Columbia University
Irving Medical Center where 62% of patients admitted to intensive care units were Hispanic/Latino [7]. A series
of 5,700 patients at another New York health care system with mostly White patients found that those with older
age and male sex were among the majority of hospitalized patients [8]. Most existing Covid–19 literature has
focused on hospitalizations and deaths. Little is known about those with negative tests or non-hospitalized
patients. The current study adds to the literature by including a diverse patient population, those with negative
tests, and those with Covid–19 who were not hospitalized.
This study has several limitations. The data were aggregate; thus individual-level statistical analysis was not
possible and conclusions about causality cannot be drawn. This study is not representative of the entire city and
not all census tracts and zip codes were equally represented.
In sum, among this cohort of over 20,000 patients in New York City, variation in Covid–19 test results and
disease outcomes according to age, sex, race/ethnicity, insurance status, and neighborhood characteristics was
identi ed. Widespread testing and contact tracing will be required to contain Covid–19 long-term. The ndings
support the need to monitor Covid–19 testing access and disease outcomes according to patient and
neighborhood characteristics, resolve long-standing structural racial/ethnic discrimination and segregation, and
address modi able factors such as poverty and housing crowding in order to achieve health equity and reduce
transmission of disease among the entire population.
Declarations
Page 4/9Acknowledgments
The authors have no con icts of interest to disclose.Research reported in this publication was supported by the
National Institute Of Diabetes And Digestive And Kidney Diseases of the National Institutes of Health under
Award Number K23DK115682. Research was also supported by the National Institute on Minority Health and
Health Disparities of the National Institutes of Health under Award Number 1 R01 MD014872–01. This work is
solely the responsibility of the authors and does not represent the o cial views of the NIH.
References
1. Amid Ongoing COVID-19 Pandemic, Governor Cuomo Announces Fifth Region Hits Benchmark to Begin
Reopening May 15th. Governor Andrew M. Cuomo. Published May 14, 2020. Accessed May 31, 2020.
https://www.governor.ny.gov/news/amid-ongoing-covid-19-pandemic-governor-cuomo-announces- fth-
region-hits-benchmark-begin
2. Social Determinants of Health | CDC. Published April 9, 2019. Accessed May 31, 2020.
https://www.cdc.gov/socialdeterminants/index.htm
3. Wadhera RK, et al. Variation in COVID-19 Hospitalizations and Deaths Across New York City Boroughs.
JAMA. 2020;323(21):2192-2195. doi:10.1001/jama.2020.7197
4. nychealth/coronavirus-data. GitHub. Accessed June 1, 2020. https://github.com/nychealth/coronavirus-
data
5. COVID-19: Data Summary - NYC Health. Accessed May 31, 2020.
https://www1.nyc.gov/site/doh/covid/covid-19-data.page
6. Segregation Scores: Census 2010. Accessed May 31, 2020.
https://www.psc.isr.umich.edu/dis/census/segregation2010.html
7. Cummings MJ, et al. Epidemiology, clinical course, and outcomes of critically ill adults with COVID-19 in
New York City: a prospective cohort study. Lancet Lond Engl. 2020;395:1763-1770. doi:10.1016/S0140-
6736(20)31189-2
8. Richardson S, et al. Presenting Characteristics, Comorbidities, and Outcomes Among 5700 Patients
Hospitalized With COVID-19 in the New York City Area. JAMA. 2020;323(20):2052-2059.
doi:10.1001/jama.2020.6775
Tables
Table 1. Patient Demographics and Neighborhood Characteristics According to Covid-19 Test Res
and Disease Outcomes. Data from 23,918 NYP Patients with Covid-19 Testing Results Between Ma
1, 2020 - May 14, 2020.
Page 5/9Covid-19 Test Results and Disease Outcomes
Total tested with Negative Positive Positive Positive
results available Test test, test, test,
(N = 23,918) Not Hospitalized Known
Hospitalized Death
Patient Demographics
Age, mean (SD), years 46.4 49.2 (18.3) 60.7 (18.0) 74.8
(22.4) (13.7)
Age, n (%), years
0-21 1,483 1,290 105 (7.1) 86 (5.8) 2 (0.1)
(87.0)
22-45 8,484 6,288 1,191 (14.0) 949 (11.2) 56 (0.7)
(74.1)
46-65 6,620 3,327 1,048 (15.8) 1,907 (28.8) 338 (5.1)
(50.3)
>65 7,331 3,187 575 (7.8) 2,194 (29.9) 1,375
(43.5) (18.8)
Sex, n (%)a
Female 13,733 9,024 1,623 (11.8) 2,366 (17.2) 720 (5.2)
(65.7)
Male 10,181 5,064 1,296 (12.7) 2,770 (27.2) 1,051
(49.7) (10.3)
Race/Ethnicity, n (%)b
Hispanic 6,245 3,011 856 (13.7) 1,810 (29.0) 568 (9.1)
(48.2)
White, non-Hispanic 4,619 3,209 453 (9.8) 653 (14.1) 304 (6.6)
(69.5)
Black, non-Hispanic 3,481 1,974 540 (15.5) 720 (20.7) 247 (7.1)
(56.7)
Asian, non-Hispanic 1,793 1,136 155 (8.6) 346 (19.3) 156 (8.7)
(63.4)
Other, non-Hispanic 943 518 114 (12.1) 239 (25.3) 72 (7.6)
(54.9)
Unknown, non- 474 295 63 (13.3) 86 (18.1) 30 (6.3)
Hispanic (62.2)
Insurance type, n (%)c
Medicaidd 7,677 4,209 744 (9.7) 1,977 (25.8) 747 (9.7)
(54.8)
Medicare 3,238 1,556 273 (8.4) 934 (28.8) 475
(48.1) (14.7)
Private 6,551 4,311 1,031 (15.7) 950 (14.5) 259 (4.0)
(65.8)
Other 4,411 2,892 671 (15.2) 718 (16.3) 130 (3.0)
(65.6)
Neighborhood
Characteristics
Percent Non-White
Individuals
Quintile 1 (0% - 4,257 2,951 459 (10.8) 612 (14.4) 235 (5.5)
32.67%) - lowest (69.3)
Quintile 2 (32.67% - 4,412 2,796 511 (11.6) 769 (17.4) 336 (7.6)
60.76%) (63.4)
Quintile 3 (60.76% - 5,780 3,105 749 (13.0) 1,372 (23.7) 554 (9.6)
86.42%) (53.7)
Quintile 4 (86.42% - 6,153 3,218 819 (13.3) 1,571 (25.5) 545 (8.9)
96.95%) (52.3)
Quintile 5 (96 .95% 3,710 1,991 530 (14.3) 917 (24.7) 272 (7.3)
- 100%) - highest (53.7)
Percent
Hispanic/Latino
Individuals
Page 6/9Quintile 1 (0% - 3,674 2,367 431 (11.7) 630 (17.1) 246 (6.7)
7.39%) - lowest (64.4)
Quintile 2 (7.39% - 4,417 2,810 588 (13.3) 721 (16.3) 298 (6.8)
14.08%) (63.6)
Quintile 3 (14.08% - 4,333 2,595 541 (12.5) 864 (19.9) 333 (7.7)
24.12%) (59.9)
Quintile 4 (24.12% - 4,661 2,691 534 (11.5) 1,051 (22.6) 385 (8.3)
47.6%) (57.8)
Quintile 5 (47.6% - 7,225 3,597 973 (13.5) 1,975 (27.3) 680 (9.4)
100%) - highest (49.8)
Percent Below Federal
Poverty Threshold
Quintile 1 (0% - 4,344 2,921 482 (11.1) 672 (15.5) 269 (6.2)
7.4%) - lowest (67.3)
Quintile 2 (7.4% - 3,906 2,491 502 (12.6) 712 (17.8) 201 (7.3)
12.3%) (62.4)
Quintile 3 (12.3% - 4,421 2,480 575 (13.0) 980 (22.2) 386 (8.7)
18.8%) (56.1)
Quintile 4 (18.8% 6,384 3,219 854 (13.4) 1,724 (27.0) 587 (9.2)
-28.4%) (50.4)
Quintile 5 (28.4% - 5,167 2,949 655 (12.7) 1,153 (22.3) 410 (7.9)
88.4%) - highest (57.1)
Percent with
Household Crowding
Quintile 1 (0% - 3,599 2,390 429 (11.9) 549 (15.3) 231 (6.4)
3.1%) - lowest (66.4)
Quintile 2 (3.1% - 4,969 3,215 583 (11.7) 846 (17.0) 325 (6.5)
6%) (64.7)
Quintile 3 (6% - 4,380 2,517 570 (13.0) 919 (21.0) 374 (8.5)
9.4%) (57.5)
Quintile 4 (9.4% - 5,453 3,067 688 (12.6) 1,256 (23.0) 442 (8.1)
14.6%) (56.3)
Quintile 5 (14.6% - 5,913 2,872 799 (13.5) 1,671 (28.3) 571 (9.7)
100%) - highest (48.6)
aExcludes 4 patients with missing data; bIncludes 17,555 patients with self-reported race or
ethnicity;
cIncludes 21,877 patients with insurance information; dIncludes Medicaid/Medicare dual-eligible
recipients
Abbreviations: NYP = NewYork-Presbyterian
Figures
Page 7/9Figure 1
Neighborhood characteristics according to Covid-19 hospitalizations without death and known deaths. Data
from 23,918 patients in New York City with Covid-19.
Page 8/9Figure 2
Covid-19 testing and disease outcomes by zip code. Data from 22,488 NewYork-Presbyterian (NYP) Patients
living in New York City. Caption: Data from zip codes with fewer than 50 Covid-19 tests at NYP and Staten Island
were excluded in all panels a. Proportion of negative tests per zip code b. Proportion of total cases attributable
to NYP patients per zip code c. Case ratio of hospitalizations without known death per zip code d. Death-to-case
ratio per zip code
Page 9/9You can also read