Improvement of Prediction Errors Based on Standardized Infrared Spectra for a Calibration-free Approach
←
→
Page content transcription
If your browser does not render page correctly, please read the page content below
MATEC Web of Conferences 333, 06001 (2021)                                                       https://doi.org/10.1051/matecconf/202133306001
APCChE 2019

      Improvement of Prediction Errors Based on Standardized
      Infrared Spectra for a Calibration-free Approach
      Shojiro SHIBAYAMA1, Kimito FUNATSU1*
      1School   of Engineering, the University of Tokyo, 7-3-1 Hongo, Bunkyo-ku, Tokyo, 113-8656 Japan

                    Abstract Continuous manufacturing (CM) in the pharmaceutical industry has been paid attention
                    to, because it is expected to reduce the costs of manufacturing. One of technical hurdles in CM is
                    establishment and maintenance of predictive models for process monitoring. Conventionally,
                    calibration models with optic spectra such as infrared or Raman spectra have been used as the
                    predictive models for process monitoring. The calibrated models predict product qualities such as
                    active pharmaceutical ingredient’s content, moisture content, particle size, and so on. However,
                    any changes in rots, ratio of ingredients, or operation conditions may affect the relationship
                    between sensor information and the product qualities, which results in deterioration of predictive
                    models. Operators must update calibration models to assure predictive accuracy; however,
                    calibration always requires data acquisition. Thus, the use of calibration models intrinsically
                    increases economical costs. To tackle this problem, the authors have been attempting to propose
                    a calibration-free approach with infrared spectra, which employs an equation in physics. To apply
                    the calibration-free approach to real processes, it is important that a model provides accurate and
                    reliable prediction. In this study, we propose a method to improve predictive accuracy of a
                    calibration-free approach after assessing predictive errors using a rational indicator. We verified
                    that the post-processing method succeeded in non-ideal binary mixtures.

      1 Introduction                                                         IHM are not the best methods as calibration-free methods,
                                                                             because they have many parameters to be fitted. On the
      Continuous manufacturing (CM) has been paid attention                  other hand, IOT is expected to be effective as a
      to nowadays because of its efficiency in terms of human                calibration-free method, because IOT has as many
      labour. However, there are several technical hurdles to                constraints and equation as parameters.
      realize CM. One of them is to construct and maintain                       Nonetheless, IOT has several limitations. One of them
      predictive models for process monitoring. Conventionally,              is application to non-ideal mixtures. IOT could be
      calibration models are used as process monitoring.                     applicable for more various mixtures, if it is able to be
      Calibration models constructed by statistical regression               applied to non-ideal mixtures. However, IOT assumes
      models such as partial least squares predict product                   that a mixture spectrum follows Beer’s law at all
      quality such as active pharmaceutical ingredient (API)                 wavelengths, though it is not possible for real mixtures
      content, moisture content, particle size, and so on from               because of molecular interactions’ effects. Thus,
      optic spectra. Constructing and maintaining the                        wavelength selection is required to eliminate wavelengths
      calibration models requires economic costs for data                    where Beer’s law does not hold [Kaneko et al. 2015,
      acquisition. To avoid this problem, use of calibration-free            Shibayama 2016]. However, once wavelength selection is
      methods is effective.                                                  conducted with a couple of spectra, the selected
          One of useful calibration-free methods involving optic             wavelengths are only fit to spectra similar to ones in non-
      spectra is iterative optimization technology (IOT) [Muteki             ideal mixtures that were used for wavelength selection. In
      et al. 2013]. IOT predicts ingredients’ content in mole                other words, wavelength selection spoils an advantage of
      fractions from infrared spectra of a mixture and pure                  calibration-free    approaches,     independence       from
      components. IOT makes use of a theoretical equation                    calibration samples, though wavelength selection is
      called Beer’s law. In other words, the constraint of Beer’s            necessary. As a result, IOT is not effective with the
      law and pure components’ spectra enables to predict                    selected wavelengths, if composition changes
      ingredients’ composition without calibration.                          significantly. If some indicators are effective to assess
          Other quantitative analysis methods for infrared                   prediction errors for IOT, the selected wavelengths may
      spectra are multi-variate curve resolution-alternating least           be updated as prediction accuracy is improved.
      squares (MCR-ALS) [Juan et al. 2014] and indirect hard                     In this study, we propose a way to update selected
      modelling (IHM) [Kriesten et al. 2008]. MCR-ALS and                    wavelengths. There is a rational scaling method for excess

      *
          Corresponding author: funatsu@chemsys.t.u-tokyo.ac.jp
© The Authors, published by EDP Sciences. This is an open access article distributed under the terms of the Creative Commons Attribution License 4.0
(http://creativecommons.org/licenses/by/4.0/).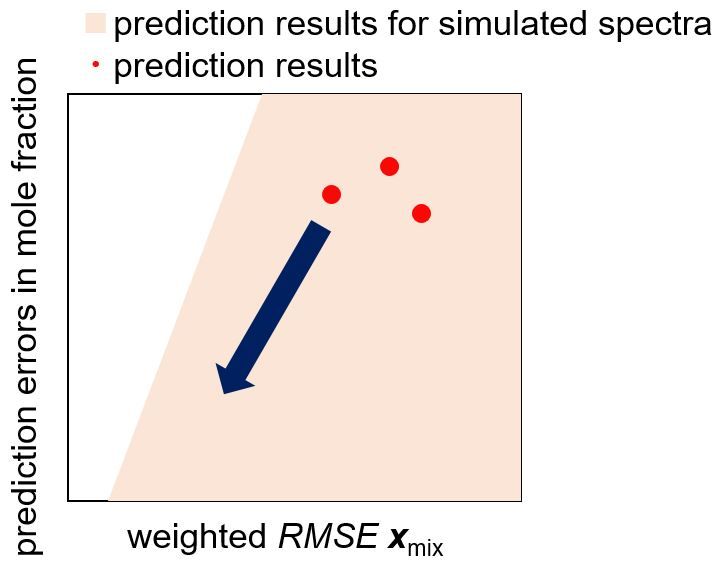
MATEC Web of Conferences 333, 06001 (2021)                                                https://doi.org/10.1051/matecconf/202133306001
APCChE 2019

     absorbances that has the same form with the objective              A mixture spectrum xmix can be estimated as xmix,pred, by
     function of IOT. We found that the scaled excess                   using estimated mole fraction rpred=(rpred,1, rpred,2, …,
     absorbances can be used as a suitable indicator to assess          rpred,c) with eq. (1). We have found that root mean square
     prediction errors for IOT. We verified the update of               of xmix-xmix,pred (RMSE xmix) is an indicator to estimate
     selected wavelengths works with one set of binary                  prediction error in r [Shibayama et al. 2016, Shibayama
     mixtures consisting of acetic acid and water, which                and Funatsu 2018]. Once virtual mixture spectra are
     behave in a non-ideal way against Beer’s law.                      generated with eq. (1) and virtual mole fraction r, possible
                                                                        prediction errors in mole fraction can be estimated. The
                                                                        virtual mixture spectra is expressed as follows:
     2 Methods
                                                                                  xmix,sim=∑i=1...c rsim,i xpure,i+ε,
     2.1 Iterative optimization technology                                        εn~N(0, s2),                                  (3)

     Iterative optimization technology (IOT) is a calibration-          where xmix,sim, rsim,i, ε n and s denote simulated mixture
     free strategy based on Beer’s law. IOT minimizes an                spectrum, simulated mole fraction of pure component i,
     objective function. Beer’s law is expressed as follows,            measurement noise at wavelength n, and simulated
     using a mixture spectrum xmix and pure component i’s               standard deviation of the measurement noise. s is set
     spectrum xpure,i:                                                  various values to simulate disturbances of spectra.
                                                                            This time, we replaced the indicator with the weighted
                       xmix=∑i=1...cri xpure,i+ε,             (1)       RMSE xmix. The scale is the same one with the objective
                                                                        function of wIOT. RMSE xmix after the scaling will show
                                                                        strong linear correlation with prediction errors in mole
     where ri and εdenote mole fraction of pure component i
                                                                        fraction.
     and error. IOT solves the following minimization problem
     with an optimization solver.
                                                                        2.5 Update of selected wavelengths
                  minr1,r2,…,rc |xmix-∑i=1...cri xpure,i|2,
                                                                        Prediction results for IOT depend on selected
     such that                                                (2)       wavelengths, as described above. In addition to this, the
                                                                        weighted RMSE xmix has strong correlation with
                      ∑i=1...c ri=1, 0≤ri≤1.                            prediction errors in mole fraction. Thus, prediction results
                                                                        in mole fraction will decrease if the selected wavelengths
     2.2 Wavelength selection based on excess                           are updated as RMSE xmix is minimized.
     absorption                                                             Figure 1. indicates how the update of selected
                                                                        wavelengths affects prediction results for wIOT. The red
     One of obstacles for applications of IOT is unnecessary            markers denote prediction results for wIOT. The orange
     wavelengths. IOT is not effective when Beer’s law does             area denotes prediction results for simulated spectra. The
     not hold at some wavelengths. The authors have been                orange area is usually depicted as a group of dots. The
     proposed two types of wavelength selection [Kaneko et al.          points for simulated spectra usually forms a trapezoid,
     2015, Shibayama et al. 2016]. One indicator to determine           because the prediction errors in mole fraction and
     if Beer’s law holds is excess absorbance, which is                 weighted RMSE xmix has strong correlation. Thus,
     difference between the observed mixture spectrum and               prediction results can be improved by updating selected
     mixture spectrum calculated using eq. (1) except ε, pure           wavelengths as minimizing weighted RMSE xmix. The
     components’ spectra, and observed mole fractions. IOT              update corresponds to the move represented by the
     provides accurate prediction results after the wavelength          arrow in the figure.
     selection.                                                             In the real situations, prediction errors in mole
                                                                        fraction are never known, because IOT is used as
     2.3 Weighted IOT                                                   online process monitoring. Thus, operators of the
                                                                        process must refer to indicator, weighted RMSE xmix
     We have found that excess absorbances, which have the              here, to check indirectly if process monitoring with
     same form with the objective function of IOT, can be               IOT is reliable enough. Besides, operators may infer
     scaled by the possible variance of Beer’s law. By                  the prediction errors by checking the prediction results
     replacing the original objective function of IOT with the          for simulated spectra. This operation stands on a
     scaled excess absorbances, IOT provides more accurate              hypothesis that weighted RMSE xmix correctly keeps
     prediction result that the original IOT. We call this new          strong correlation with the prediction errors for IOT.
     method weighted IOT (wIOT). The scaling enables us to
     evaluate excess absorbances across wavelengths equally.

     2.4 Inference of errors for wIOT

                                                                    2
MATEC Web of Conferences 333, 06001 (2021) https://doi.org/10.1051/matecconf/202133306001
APCChE 2019
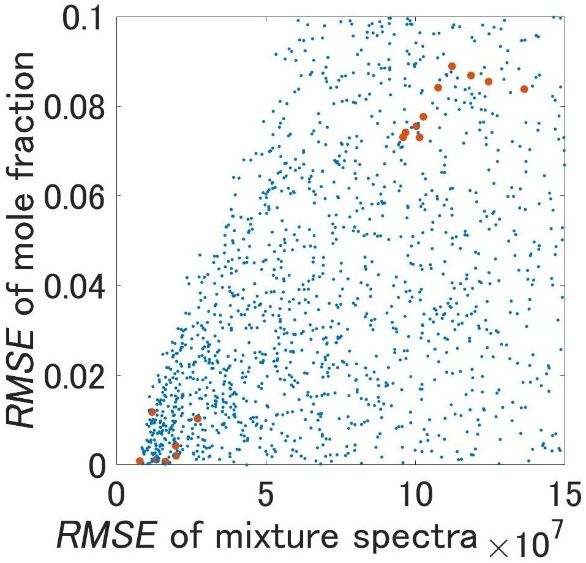
3.2 Update of selected wavelengths
We first conducted wavelength selection using the two
samples that were randomly sampled. Thus, the
wavelengths selected first may be overfitted to the two
samples. Peak positions and intensities of mixture spectra
can change because of changes in compositions. Changes
in composition affect magnitude of molecular interactions
in absorbances. Thus, a set of the optimal wavelengths for
IOT prediction is different across samples. Figure 3.
indicates the relationship between the prediction results
and weighted RMSE xmix. The orange and blue markers
denote prediction results for observed and simulated
samples.
Figure 1. Concept of updating selected wavelengths.
The entire workflow in this study is shown in Figure
2. First of all, wavelength selection based on excess
absrobances (WLSEA) is conducted. Second, wIOT is
conducted to predict mole fraction rpred. At last, the update
of selected wavelengths is carried out to check if
prediction accuracy is improved.
Figure 3. Relationship between weighted RMSE xmix and
prediction errors in mole fraction. Blue and orange markers
denote prediction results for simulated virtual spectra and
observed spectra.
The prediction results projected to the up right region
in the figure are inaccurate results. The goal of update is
Figure 2. Flowchart of the entire analysis. to decrease the prediction errors of inaccurate results. We
re-selected wavelengths as minimizing weighted xmix. The
wavelength selection was conducted in the same manner
3 Results and discussion with WLSEA. First, excess absorbances for the two
samples were sorted ascendingly. Then, wavelengths with
excess absorbances from small to large were taken.
3.1 Material Eventually, wavelengths were selected as weighted RMSE
xmix converged to minimal.
In this study, we used binary mixtures consisting of acetic Figure 4. indicates the relationship between prediction
acid (AA) and water for validation. The spectra were results before and after update of selected wavelengths.
collected in different nineteen compositions [Shibayama The results with large prediction errors were located in the
et al. 2018]. Infrared spectra of AA and water will right area in the figure. The prediction errors for the
represent for industrial real ones, though AA and water results were successfully decreased from around 0.09 to
are not the actual industry samples. This is because 0.03. on the other hand, prediction results with small
infrared spectra of AA and water follow Beer’s law to prediction errors were not improved. This implies that
some extent and because the spectra violate Beer’s law small weighted RMSE xmix only defines the maximum
due to molecular interactions. The mathematical features possible prediction errors, not the exact prediction errors.
that appear in the spectra cover those found in actual Thus, prediction errors may even increase, when
industry samples. minimizing weighted RMSE xmix for the samples with
We randomly took two samples out of the samples for small weighted RMSE xmix.
wavelength selection. Others were treated as test samples.
3MATEC Web of Conferences 333, 06001 (2021) https://doi.org/10.1051/matecconf/202133306001
APCChE 2019
H. Kaneko, K. Muteki, and K. Funatsu; “Improvement of
iterative optimization technology (for process analytical
technology calibration-free/minimum approach) with
dimensionality reduction and wavelength selection of
spectra,” Chemom. Intell. Lab. Syst. 147 176–184 (2015).
S. Shibayama, H. Kaneko, and K. Funatsu; “Iterative
optimization technology combined with wavelength
selection based on excess absorption for a process
analytical technology calibration-minimum approach,”
Chemom. Intell. Lab. Syst. 156 137–147 (2016).
S. Shibayama, H. Kaneko, K. Funatsu, ”Formulation of
the excess absorption in infrared spectra by numerical
decomposition for effective process monitoring,” Comput.
Chem. Eng. 113 86–97 (2018).
S. Shibayama, and K. Funatsu; “Applicability Domains of
a Minimal-Calibration Model for Effective Online
Monitoring of Pure Components’ Concentrations in the
Figure 4. Prediction errors in mole fractions before and Pharmaceutical Continuous Manufacturing Processes”,
after the update of selected wavelengths. The markers
13th Int. Symp. Process Syst., 919–924 (2018).
correspond to mixtures.
4 Conclusion
We proposed a method to update selected wavelengths for
IOT. We verified that the updating method improved
predictive accuracy by minimizing an indicator, weighted
RMSE xmix, through a case study with mixtures of AA and
water. The prediction errors in mole fraction were
decreased around 0.09 to 0.03. The dependency on
calibration samples after wavelength selection was an
issue; however, it was confirmed that the updating method
can solve the issue. The scaling method for IOT and
RMSE xmix is effective for only binary mixtures. Thus, the
authors will extend the method to multi-components
systems.
Acknowledgment
An author (S. S.) acknowledges for financial support of
Japan Society for the Promotion of Science (JSPS) in
Grant-in-Aid for JSPS Fellows (DC2) program. The
authors thank Dr. T. Goto at Kwasei University for
providing the data of the actual mixtures.
Reference
K. Muteki, D.O. Blackwood, B. Maranzano, Y. Zhou,
Y.A. Liu, K.R. Leeman, and G.L. Reid; “Mixture
component prediction using iterative optimization
technology (Calibration-Free/Minimum Approach),” Ind.
Eng. Chem. Res. 52 12258–12268 (2013).
A. de Juan, J. Jaumot, R. Tauler, “Multivariate Curve
Resolution (MCR). Solving the mixture analysis problem,”
Anal. Methods. 6 4964–4976 (2014).
E. Kriesten, F. Alsmeyer, A. Bardow, W. Marquardt,
“Fully automated indirect hard modeling of mixture
spectra,” Chemom. Intell. Lab. Syst. 91 181–193 (2008).
4You can also read