The Development of Prediction Indicators on Currency Market Using Neuro-Fuzzy Method
←
→
Page content transcription
If your browser does not render page correctly, please read the page content below
E3S Web of Conferences 188, 00021 (2020)                                 https://doi.org/10.1051/e3sconf/202018800021
ICESTI 2019

       The Development of Prediction Indicators on
       Currency Market Using Neuro-Fuzzy Method
       Ronald Limowa Lie1, Murtiyanto Santoso1, Felix Pasila1, Raymond Sutjiadi2,
       and Resmana Lim1,*
       1ElectricalEngineering Department, Faculty of Industrial Technology, Petra Christian University,
       Jl. Siwalankerto No.121-131, Surabaya, East Java, 60236 Indonesia
       2Informatics Department, Faculty of Information Technology, Institut Informatika Indonesia,

       Jl. Pattimura No.3, Surabaya, East Java, 60189 Indonesia

                     Abstract. A technical indicator is an analysis instruments to help traders
                     analyzing forex price movements through charts. Prediction indicators are
                     artificial technical indicators that can help traders to analyse forex price
                     movements in the future. This prediction information becomes one of the
                     bases in making trading decisions. This project aims to develop prediction
                     indicators on MetaTrader that can provide information on forex price
                     predictions using Neuro-Fuzzy method. The Neuro-Fuzzy System requires
                     input parameters in the system prediction process obtained from the system
                     training process. These parameters can be through or without optimization
                     process. The prediction indicator will also make trading decisions based on
                     prediction indicators analysis, RSI, and Stochastic. Finally, the information
                     on trading decisions will be displayed on Facebook pages. The prediction
                     indicator testing run well on a trading system. Prediction indicators with
                     parameters before optimization were well used in the H4 EURUSD pair
                     (data 2012) with a predicted profit of USD 16 499. While the prediction
                     indicators with parameters after optimization were well used in the H1
                     EURUSD pair with a predicted profit of USD 21 945. The information on
                     trading decisions were also successfully displayed on Facebook pages.

                     Keywords: Artificial technical indicator, facebook, forex,
                     forex price analysis, metatrader.

       1 Introduction
       Forex trading is a promising investment choice as it can be conduct-ed 24 h a day and 5 d a
       week. The forex market is so very crowded with many players that it is considered very
       liquid. Forex price movements are determined by market power and a country's economic
       conditions so it is very difficult to predict the direction of the forex price movements. When
       forex price movements is analyzed, a pattern or repetitive behavior will be found, called a
       trend. This trend can be studied and analyzed to form an indicator that can help traders
       making trading decisions [1].

       *
        Corresponding author: resmana@petra.ac.id

© The Authors, published by EDP Sciences. This is an open access article distributed under the terms of the Creative Commons
Attribution License 4.0 (http://creativecommons.org/licenses/by/4.0/).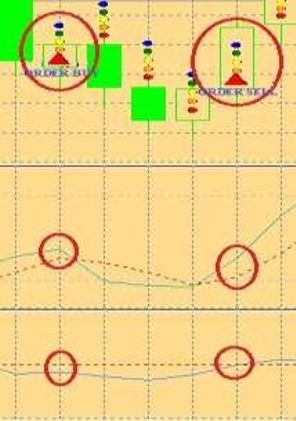
E3S Web of Conferences 188, 00021 (2020) https://doi.org/10.1051/e3sconf/202018800021
ICESTI 2019
In daily trading, a trader must monitor the price movements through a chart, not to miss
the trading momentum. Psychological factors also determine trading decision making.
Therefore, it is necessary to make a prediction indicator using Neuro-Fuzzy method that
can tell the trend of forex price movements in the future. This prediction indicator will be
an add-on to MetaTrader [2–4].
2 Project design and implementation
The project consists of system training scripts and prediction indicators on Meta-Trader;
Neuro-Fuzzy methods in the form of DLL files; and a Facebook application of status
updates.
2.1 System design
The Neuro-Fuzzy method [5–7] being used, previously exists on Matlab. This method
needs an interface to be able to be used on Meta-Trader. Takagi-Sugeno’s fuzzy inference
system is used for the Neuro-Fuzzy fuzzy method architecture as shown on Figure 1 below.
O• G11 / y11
H• 1
Z /b +
X Z1
L• 1 y1M
G ˆ
C•
3
O
Degree of fulfilment
Hˆ
4 outputs
•
4 inputs
•
Of M rules
• + b
Lˆ
•
•
•
Degree of
O • G1M fulfilment Cˆ
H • y 1n
X ZM
L • +
G 3M Z M /b
C •
/ y nM
Fig. 1. Takagi-Sugeno fuzzy model with four inputs and four OHLC outputs (modification from
Pasila structure, “Forecasting”) [5].
Figure 1 shows that there are four inputs and outputs of the Neuro-Fuzzy system,
consisting of the open, high, low, and close prices data of a pair forex. In the multiplier
operator section (×), the input data will be compared to the G parameter value representing
the antecedent conjunction operator. The output of this section is the value of the degree of
fulfilment corresponding to l = 1, 2, ..., M represents the number of rules. The divider
section (/), together with the addition operator (+), calculates the normalized degree of
fulfilment ( z l / b ) of each corresponding rule. After the multiplication with the
corresponding Takagi-Sugeno consequent rule ( y lj ), then used as an input for the final part
of the addition (+) on the defuzzified output value OHLC. This OHLC value becomes the
input of the Neuro-Fuzzy system for the next iteration by the same working system [6, 8].
The Neuro-Fuzzy method is separated in the training and prediction phases. The goal is
to separate the generated DLL files. The DLL system training file will be inputted into the
system training script. The DLL prediction system file becomes the input to the prediction
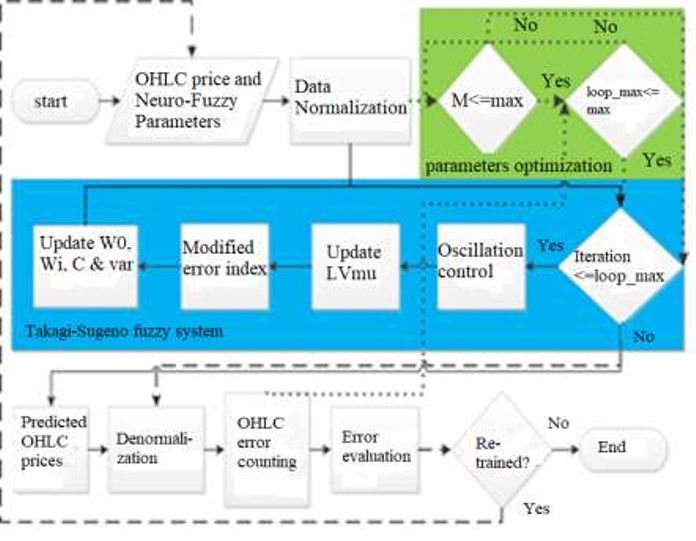
indicator. Figure 2 shows the Neuro-Fuzzy method algorithm, being used in the system
training and prediction system.
2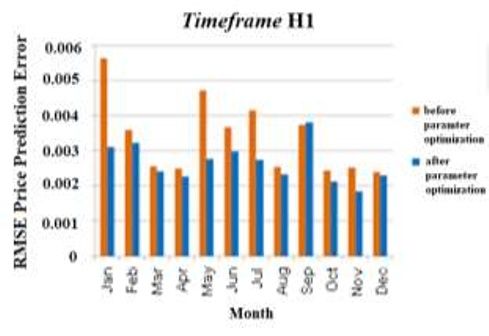
E3S Web of Conferences 188, 00021 (2020)                      https://doi.org/10.1051/e3sconf/202018800021
ICESTI 2019

      Fig. 2. Flowchart of the neuro-fuzzy working system.
           System training scripts and prediction indicators are made on Meta-Trader. Both
      programs will run on the client terminal corresponding to their respective functions. To be
      able to run the prediction indicator program, it is necessary to do system training first. The
      aim is to get the parameters weight file as the result of the system training. Then the
      prediction indicator can run the prediction system by reading the input of the parameter
      weight file. In short, a system training system script called ANFIS_train can be described in
      accordance with the algorithm as follows:
          i. Initializing the DLL file containing the Neuro-Fuzzy method as the input library and
             system training variables.
         ii. Taking the history data of a pair forex and writing it in a CSV file as the system
             training input.
        iii. Calling the system training function from the DLL file, called as the system training
             of the Neuro-Fuzzy method.
        iv. Saving the result of system training in a CSV file.
           Prediction indicators are also developed on the Meta-Trader client terminal. Prediction
      indicators can provide information on five time step forex price predictions in the future.
      Additional analysis can be obtained from technical indicators with the aim of further
      clarification on the accuracy of the predictions of forex price movements trend. The rules of
      each indicator are made in a trading system that will guide the trading decision making [9].
           The RSI and Stochastic indicators are used as additional technical indicators in
      developing trading system rules. The trading system rules of the three indicators are as
      follows.
          i. The order buy signals is given if the value of RSI > 45, RSI < 50, the value of the
             stochasticMain indicator > stochasticSignal, and the difference of the prediction price
             on the chart used >= threshold.

                                                      3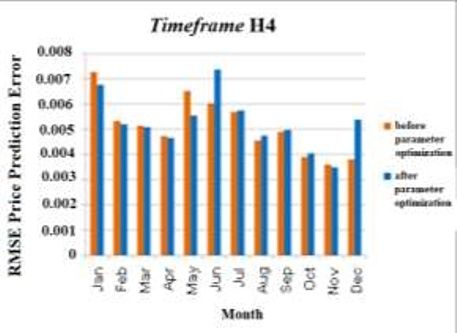
E3S Web of Conferences 188, 00021 (2020)                       https://doi.org/10.1051/e3sconf/202018800021
ICESTI 2019

         ii. The order sell signal is given if the value of RSI > 50, RSI < 55, the value of the
             stochasticMin indicator < stochasticSignal, and the difference of the prediction price
             on the chart used = the number of mails in the INBOX directory, then the message "No
                 new messages" is displayed and the connection to the database and mail server is
                 closed.

                                                    4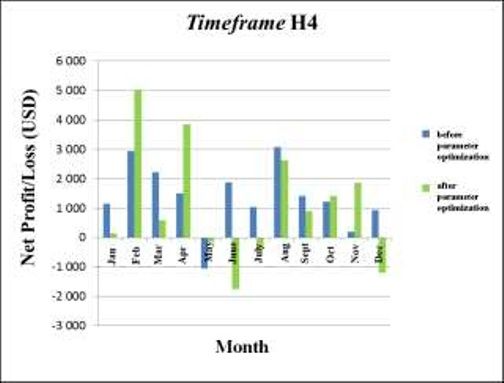
E3S Web of Conferences 188, 00021 (2020)                                       https://doi.org/10.1051/e3sconf/202018800021
ICESTI 2019

            b. If numMail < the number of mails in the INBOX directory, then the contents of the
               latest mail message is retrieved and the API (AccessToken and mail messages) is
               executed to update the status on the Facebook page.
        vi. Doing a query to change the numMail column data to be the same as the number of
            mails in the INBOX directory, then the connection to the database and mail server is
            closed.
       vii. Delaying for 60 s and the process is restarted.

                                      Start                Connect to mail                                     N
                                                                                          email_number >
                                                            server, Inbox
                                                                                          numMailPrevious
                                                              directory

                                                                                                    Y
                                Initializatioin of
                                 database and
                                 Facebook file                                             Sort mail from
                                 configuration           Get all mail at Inbox
                                                                                          oldest to newest

              Delay 60
              seconds
                              Connect to database                                N        Get newest mail
                                                           Is there any mail
                                                                at Inbox?

                                                                      Y                   Store AccessToken
                               Get AccessToken                                           and mail message in
                                     and                                                   array attachment
                       N       numMailPrevious           Count mail and store
                                     data                 in email_number
               Delete
            application or
            cron setting?
                                Close mail
                                                     Change numMail       Show message          Execute
                                server and
                                                          with                Status          Update Status
                       Y         database
                                                      email_number          Updated           Facebook API
                                connection
                 End
                                                                  Show message No
                                                                    New Messages

      Fig. 3. Flowchart on the PagesUpStatus working application.

      2.2 System implementation

      The algorithms above become the basis for implementing the system in the form of
      programs. Each program will be developed in accordance with their respective placements.
      the implementation of the system is described as follows:
         i. The Neuro-Fuzzy method is written from Matlab to the C++ programming language,
            then compiled into DLL files. Two types of DLL files generated from the Neuro-
            Fuzzy method are DLL system training and DLL prediction system files. The DLL
            files will run the Matlab engine as a calculation engine for the Neuro-Fuzzy method.
            The DLL files will be the input library on the system training scripts and prediction
            indicators.
        ii. The system training process is conducted at the Meta-Trader client terminal using the
            ANFIS_train and Matlab engine system training scripts as a calculation engine for the
            Neuro-Fuzzy method. The Neuro-Fuzzy Method conducts the system training based
            on the input data of a pair forex price and produces weight parameter files as the result

                                                             5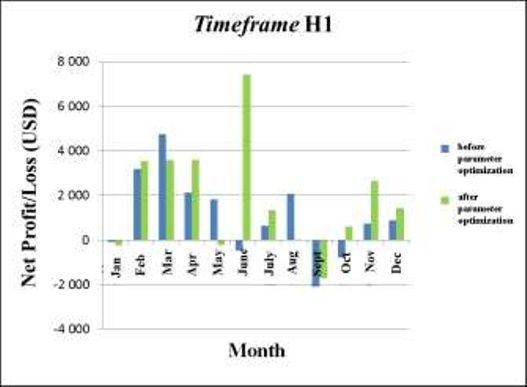
E3S Web of Conferences 188, 00021 (2020)                      https://doi.org/10.1051/e3sconf/202018800021
ICESTI 2019

           of the system training. The weight parameter files will be saved corresponding to the
           name of the pair forex and timeframe used
      iii. The prediction system process is also conducted on the Meta-Trader terminal client
           using the ANFIS_plot prediction indicators and the Matlab engine as a calculation
           engine for the Neuro-Fuzzy method. The Neuro-Fuzzy Method predicts the forex
           prices based on the input price of a pair forex and the weight parameter value of the
           previous system training. The result of the system prediction will be described on the
           Meta-Trader client terminal in the form of indicator lines and dot objects.
      iv. The Facebook application will execute the API to update the status on the Facebook
           pages. The Facebook API requires an access parameter token, obtained from the users
           authentication of the Facebook application. The access tokens data and status update
           messages are executed by the Facebook application using the appropriate API. The
           status update messages on Face-book pages is the trading decisions information taken
           by the prediction indicators.

      3 Testing and system analysis
      The system testing consists of testing the accuracy of the trading system rules in providing
      the appropriate trading signals; testing the prediction indicators which consists of testing
      prediction indicator analysis transactions and calculating the prediction price errors; as well
      as testing the Facebook application to do the update status on Facebook pages. The Neuro-
      Fuzzy network are trained with 10 yr of data (2001 to 2011). Prediction indicator testing
      was con-ducted by backtesting using strategy tester feature on MetaTrader. The testing used
      EURUSD curency pair data from January to December 2012 on the M30, H1, H4, and D1
      timeframes. Testings were also conducted using two types of parameters, before and after
      optimization.

      3.1 Testing of trading rules system

      Fig. 4. Trading signal at client terminal.
      This testing aims to analyze the appearance of trading signals on the MetaTrader client
      terminal, complying with the trading system rules analysis, whether fulfilled or not. The

                                                    6
E3S Web of Conferences 188, 00021 (2020) https://doi.org/10.1051/e3sconf/202018800021
ICESTI 2019
trading signals appearing on the client terminal were arrow objects, text objects, and the
corresponding trading signal alerts, as well as an e-mail containing trading information to a
user's e-mail address. At the appearance of a new bar, the previous trading signal was
closed and the system performed a trading system rules analysis for the current bar. The
testing result shows that the trading signals in the form of arrow objects, text objects, and
alerts could be displayed on the client terminal in accordance with the fulfilled trading
system rules analysis and a trading information e-mail was also sent to the user's e-mail
address. Figure 4 shows an example of the results of the trading system rules testing.
3.2 Prediction indicators transaction analysis testing
The testing was conducted by measuring the accuracy of the trading decisions in trading
simulations. It was conducted by calculating the amount of the profit/loss suffered due to
the trading decision making. The amount of profit/loss suffered were compared between
parameters before and after optimization on each month and testing timeframe. The purpose
of this testing is to find out which parameters are of optimal use on certain timeframes with
maximum benefit and the smallest risk.
The testing result shows that both prediction indicators with parameters before and after
optimization could produce a good prediction system. This was proven by the results of the
transactions which always record net profits at the end of the year for the M30, H1, H4 and
D1 timeframes. The prediction Indicator with parameters after optimization was good to be
used on H1 timeframe because it recorded the largest total net profit in a year compared to
other timeframes with a small transaction risk as shown on Figure 5. While the prediction
indicator with parameters before optimization was good to be used on the H4 timeframe
because it recorded the largest total net profits of a year compared to other timeframes with
a small transaction risk as shown on Figure 6.
Fig. 5. Bar chart on the comparison of the testing result of transaction on timeframe H1.
7E3S Web of Conferences 188, 00021 (2020) https://doi.org/10.1051/e3sconf/202018800021
ICESTI 2019
Fig. 6. Bar chart on the comparison of the testing result of transaction on timeframe H4.
3.3 Calculation of price prediction errors
Each prediction price must have errors or deviation towards the actual price. The amount of
the prediction price errors was calculated and analyzed as a Neuro-Fuzzy system evaluation
material. The calculation was performed on the five time step prediction price data in each
bar in the form of the RMSE value (Root Mean Square Error). The calculation was
performed on the close price data only at two types of parameters, before and after
optimization. The amount of the prediction price errors between the two parameters were
compared to find out which parameter could give the smallest price prediction error on a
particular timeframe, appropriate to be used for the Neuro-Fuzzy system.
The calculation result shows that the prediction indicator with the parameter after
optimization gave the smallest price prediction error on H1 timeframe. This result was also
in line with the result of prediction indicator analysis transaction testing as shown on
Figure 7. While the prediction indicator with the parameter before optimization gave the
smallest price prediction error on the timeframe H4 as shown on Figure 8. This result was
in line with the result of the pre-diction indicator analysis transaction testing with the
parameter before optimization gave the largest total net profit on the H4 timeframe.
Fig. 7. The calculation result of price prediction errors on timeframe H1.
8E3S Web of Conferences 188, 00021 (2020) https://doi.org/10.1051/e3sconf/202018800021
ICESTI 2019
Fig.8. The calculation result of price prediction errors timeframe H4.
3.4 Website Testing
The Facebook application website consists of three pages: the home page, login page, and
logout page. The users were directed to the Facebook login page after clicking the sentence
containing a reference to the Facebook login page on the home page. After logging in and
agreeing to the use of the application along with the permissions submitted, using
authentication method, a user access right was obtained in the form of a token access. An
access token is a user identification code which authorizes the use of the Facebook
application.
The purpose of the website testing is to get access to the Facebook application user
token and the changing AccessToken column and numMail data in the database. NumMail
is a variable storing the number of mails in the user’s INBOX directory. The testing result
on Figure 9 shows the changes in AccessToken and numMail column data in the database
corresponding to the current condition after the user logs out on the website page.
Fig. 9. Update column data in the database.
3.5 PagesUpStatus application testing
The PagesUpStatus application functions to transfer trading information messages from
MetaTrader4 to a Facebook page via e-mails as an update status of the pages. The program
was executed every 60 s in accordance with the settings of the cron command on the server.
The first step of the program was to retrieve AccessToken and numMail data from the
database, then calculate the number of mails in the user's INBOX directory. The value was
stored in a variable. Then the program compared the value of the numMail variable and the
value of the number of mail variables in the INBOX directory. If the value of numMail was
smaller than the number of mails in the INBOX directory, there would be a new mail in the
9E3S Web of Conferences 188, 00021 (2020) https://doi.org/10.1051/e3sconf/202018800021
ICESTI 2019
INBOX directory. The program then retrieved the latest mail with the contents of the mail
and executed the Facebook API to do the status on Face-book pages. If the value of
numMail was greater than or equal to the number of mails in the INBOX directory, then
there would be no new mail and the program would wait for 60 s to start the process again.
The testing result shows that the contents of the trading information message from
MetaTrader to the e-mail address of the user could be displayed on the Facebook as an
update status from the Facebok pages as shown on Figure 10. This status could also be
displayed on the home page of each Facebook user who had previously liked those pages.
Fig. 10. An example of update status of Facebook pages.
4 Conclusion
Prediction indicators with both parameters before or after optimization can produce a good
prediction system with a small transaction risk as it always generates net profit in a year in
the M30, H1, H4, and D1 EURUSD timeframe pairs. Prediction indicators with parameters
before optimization is good to be used on H4 EURUSD timeframe pair as it gives the
largest total profit in a year, amounted to USD 16 499 (data 2012). Meanwhile, prediction
indicator with parameters after optimization is good to be used on the H1 EURSD
timeframe pair as it provides the largest total profit in a year amounted to USD 21 945. The
update status application on the Facebook pages runs well via the display of update status
containing the trading decision information of the prediction indicator.
The authors are thankful to the grant (No. contract: 002/SP2H/LT/MONO/2019) provided by the
Directorate of Research and Community Service, Ministry of Research, Technology, and Higher
Education, Republic of Indonesia under grant scheme of Applied Research.
References
1. Babypips. What is a lot of forex? [online] from http://www.babypips.com/school/lots-
leverage-and-profit-and-loss.html (n.d). [Accessed on August 20, 2020}.
2. Babypips. Technical Analysis. [online] from http://www.babypips.com/school/
technical-analysis.html (n.d.). [Accessed on August 20, 2020].
3. A.K. Palit, D. Popovic. Computational intelligence in time series forecasting, theory
and engineering applications. Verlag, London : Springer (2005). pp. 230–246.
https://www.springer.com/gp/book/9781852339487
4. R. Babuska, H. Verbruggen. Annu. Rev. Control, 27,1:73–85(2003).
https://www.sciencedirect.com/science/article/abs/pii/S1367578803000099
5. F. Pasila. Forecasting of electrical load using takagi-sugeno type mimo neuro-fuzzy
network. [Thesis] University of Bremen, Germany (2006).
https://scholar.google.com/scholar?cluster=3693450068232213715&hl=en&as_sdt=2
005&sciodt=0,5
6. F. Pasila, H. Kuswanto, H. Ferdinando, R. Sautama. Long-term prediction of IHSG
Indonesia using levenberg-marquardt training on neuro-fuzzy network. Proceeding of
10E3S Web of Conferences 188, 00021 (2020) https://doi.org/10.1051/e3sconf/202018800021
ICESTI 2019
New Trends and Development in Information Communication and Technology (ICT)
in Creative Economy. (Jakarta, Indonesia, 2007). pp. 9–13(2007).
https://www.researchgate.net/publication/286379642_Long-term_Prediction_of_
IHSG_Indonesia_using_Levenberg_Marquardt
7. F. Pasila, A.K. Palit, G. Thiele, G. JACIII, 12,4:361–369(2008).
https://www.fujipress.jp/jaciii/jc/jacii001200040361/
8. M. Santoso, R. Sutjiadi, R. Lim. MATEC Web Conf., 164,01031:1–5(2018).
https://www.matec-conferences.org/articles/matecconf/abs/2018/23/matecconf_
icesti2018_01031/matecconf_icesti2018_01031.html
9. Belajarforex. Create a trading system. [online] from http://belajarforex.com/hunting-
fox/4-create-a-trading-system.html (n.d.). [Accessed on August 20, 2020].
10. Facebook developers. Access tokens. [online] from https://developers.facebook.com/
docs/facebook-login/access-tokens/ (n.d). [Accessed on August 20, 2020].
11. Github. Facebook-php-sdk. [online] from https://github.com/facebook/facebook-php-
sdk (n.d). [Accessed on August 20, 2020].
11You can also read