Medical Images Enhanced by Using Fuzzy Logic Depending on Contrast Stretch Membership Function - inass
←
→
Page content transcription
If your browser does not render page correctly, please read the page content below
Received: October 9, 2020. Revised: November 12, 2020. 368

Medical Images Enhanced by Using Fuzzy Logic Depending on Contrast Stretch
 Membership Function

 Rafid Abbas Ali1 Asaad M. Abbas1 Hazim G. Daway1*

 1
 Department of Physics, College of Science, Mustansiriyah University, Iraq
 * Corresponding author’s Email: hazimdo@uomustansiriyah.edu.iq

 Abstract: Medical images are often adversely affected by a lack of clarity due to the limited representation of the
 color gamut. In this research, three types of medical images microscopic, magnetic resonance and x-ray images were
 enhanced by using a Fuzzy Logic by Stretch Membership Function (FLSMF). The Stretch Membership Function
 increased the dynamic range for the compounds red, green and blue in the medical images which have a few ranges.
 The FLSMF algorithm was compared with other methods by calculating the entropy value, wavelet quality evaluator
 and lightness order error. The analysis of the results showed that the proposed method succeeded in enhancing the
 contrast of the different types of medical images where it had high average values for the entropy (6.95) and wavelet
 quality evaluator (0.08), and a small average value for the lightness order error (60.77).
 Keywords: Contrast enhancement, Fuzzy log, Lightness enhancement, Medical images, Microscopic, Magnetic
 resonance, X-ray.

 enhancement plays an important role in medical
1. Introduction imagery. Some techniques include improving
 lightness [1, 2], and some rely on color restoration [3].
 In recent years, Medical or microscopic images
 In general, some enhancement techniques use non-
play an important part in medical image diagnosis.
 linear mapping to improve lighting [4, 5]. Others rely
There are different types of medical imaging such as
 on the development of the technique of the Histogram
magnetic resonance imaging (MRI), Computerized
 Equalization (HE) [6]. Human perception is more
Tomography, X-ray imaging, and microscope images.
 responsive to contrast than absolute luminance [7].
From these images, we can identify and distinguish
 Medical imaging types as magnetic resonance
the number of diseases, although many of these
 imaging (MRI) and Computerized Tomography (CT)
images do not have high resolution and good clarity
 and X-ray imaging generate the direct view and clear
due to the representation of limited intensity. The
 of the pathological regions. They are basic tools for
point of medical image improvement is to enhance
 detecting or diagnosing various diseases. However,
the lightness and contrast in the adjacent regions to
 there is limited imaging in the medical images due to
support activities such as surgical planning,
 low contrast and resolution. Medical image
monitoring, and disease diagnosis. Contrast is the
 improvement aims to enhance the medical images in
distinction between bright and dark areas within the
 contrast or lightness to detect certain features. Some
image. So, the lighting condition plays a vital role in
 of the enhancement fuzzy techniques as in [8] used
object details appear clearly to be recognized and
 to improve color images captured at low lighting
counted. These details are shadows and bright lights
 levels by using sigmoid membership function. These
that will facilitate produce a smart distinction within
 techniques are not suitable for medical images
the image. To improve the image brightness, it is
 because most medical images suffer from lack of
necessary to optimize its contrast and change the
 contrast due to low dynamic range in the red, green
details and information of the Microscopic image
 and blue channels and [9] presented an idea about
International Journal of Intelligent Engineering and Systems, Vol.14, No.1, 2021 DOI: 10.22266/ijies2021.0228.34
Received: October 9, 2020. Revised: November 12, 2020. 369 using a fuzzy technique for color image captured at Rosales in [13] use fuzzy data to help deal with the night. The technology improves night images by inaccuracy of grey level values compared with increasing the brightness of dark areas and reducing conventional flat histogram-based approaches. This lighting in bright areas. The disadvantage of this approach essentially prevents the presence of pictures enhancement technique is focused on improving the blurred out. This is ideally suited for hilly area level of contrast for this type of images and it is not pictures which are suffering from poor contrast and suitable. The researchers presented the night mode look blurred out. The sub-blocks together are then algorithm for different image capture devices. Preethi transformed into original size blocks using inverse- S.J et al. [10] introduced a membership functions FTR. These inversely modified blocks are combined ramp used to enhance the visual appearance of the to reconstruct the final fused picture by choosing the image so hat maximum possible information could be most extreme dependent combination law. The extracted. They introduced two methods; Fuzzy logic suggested approach the fused image includes more Based Function Modification by Square-operation detailed details and characteristics than most fused (FLFMS), and Fuzzy logic Based Function images. Denys Mikhov et al. Suggested a Fuzzy- Modification by cube-operation (FLFMC) logic Technique used to enhance lightness in the algorithms have been used to improve the usual and colour images. A suggested number of membership medical images. These methods are good at functions are Gamma-Correction, white pixel and improving captured images at low and medium grey pixel. The best way is by analysing the results lighting level. However, they do not work well for are Fuzzy-logic Based Gamma-Correction (FLBGC) images captured at low light levels, as it increases the [14]. Although it improves well at low light levels, it darkness in low-lit areas. The membership function is increases the illumination in the high-light area, modified for dark and bright regions but is left which distorts the images in those areas. unchanged for the middle regions. This approach can Some medical images have low dynamic be used in medical images to make the diagnosis easy. intensity levels and the range stretches can play an Raju G. et al. [11] presented a simple and effective important role in improving it by using a fuzzy Fuzzy color image enhancement process for technique, in this study, the medical images are enhancing color images with low contrast. This improved using fuzzy logic based on a membership procedure is based on two parameters M and K, function that increases the contrast using a Stretch where M is average image intensity value and K is a Membership Function. function of contrast intensification. The RGB component of the image is translated to color space 2. Proposed method HSV. The basic principle on which the technique is The fuzzy logic depending on stretch slandered- designed is transforming skewed histogram of the mean membership function is used to enhance the input image into a uniform histogram. The proposed contrast and brightness in the R, G, and B algorithm is compared with conventional techniques. components. The function improves the variance by The proposed method is computationally faster than histogram extraction based on mean and standard the existing methods and well suits with the images deviation values, as illustrated by a distribution having a background with non-uniform distribution before and after processing, where the enlargement of of brightness. Jaspreet Kaur and Amandeep Kaur in the histogram is observed. In the membership [12] Proposed Blurred histogram equalization FHE function, the minimum and maximum of each retains the brightness of the image along with component RGB in the image are given by [3]: enhancement of the original image in local comparison. First, Fuzzy histogram is generated from _ = + t( ) (1) the logic of Fuzzy. Second, the histogram of Fuzzy is split down into two sub- depending on the median value or the picture data. Thereafter, each histogram _ = − t( ) (2) is independently equalized to maximize the contrast of the image. At last, evenly distributed histograms where Represent the r, g, and b channels ; are being combined together to get the response. and are the mean value and standard Fuzzy histogram equalization involves of following deviation in the cn channels. t is default value (t = important steps: -If colour picture transforms RGB to 2.5); The membership function is: HSV. Then only add the further steps to component V and finally marge all components including the − _ improved components to getting the image of = _ . (3) − _ enhanced. Amita Nandal and Hamurabi Gamboa International Journal of Intelligent Engineering and Systems, Vol.14, No.1, 2021 DOI: 10.22266/ijies2021.0228.34
Received: October 9, 2020. Revised: November 12, 2020. 370
cn ′ = −1 (μn ) (6)
This done by:
cn ′ = μ′ n (μ′ n − μ′ n ) − μ′ n (7)
max,n min,n min,n
′ and ′ in inverse space of each
min,n max,n
component RGB in the image are given by:
′ , = ′ , + t ′ , (8)
′ min,n = ′ ,n − t ′ std,n (9)
Where ′ , and ′ std,n the mean value and
standard deviation for ′ . Fig. 2 shows the original
image, the image after applying mapping in
membership function and the enhanced image, and
histogram distribution of the red, green and blue
components in each stage. Where we notice an
increase in contrast in the distribution after applying
of the membership function and increase it more after
the defuzzification. The steps of the proposed
algorithm are given by:
a. Read color image ( , , ) , = , &
b. Extract , & components.
c. Fuzzification , & component by using
Membership function Eq. (3).
d. Defuzzification , & component by
using Eq. (7).
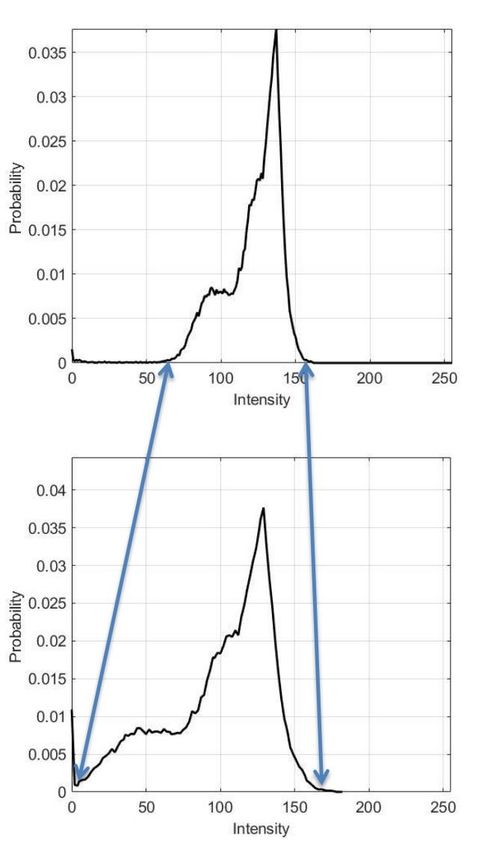
Figure. 1 Increased contrast and brightness due to the
histogram extension using the membership function. e. Composed , & component to get
enhanced images.
The above equation applies to each component red, We can shorten the proposed algorithm by using
green and blue individually the following steps using the steps shown in Fig. 3.
μn is called the crossover point.
Fig. (1) shows the histogram distributions after 3. Quality assessment
using the membership function, where we notice the
increased distribution values and it has more intensity Several quality measures measure image quality
levels, which indicates increased contrast Another without a reference. One of these important methods
fuzzy set is produced by recursion calling as follows is entropy.
[15] This scale determined by the maximum amount
of information in the medical image. The entropy
′ = ( ) = ( −1 ( )), defined as [17]:
= 1,2,3, …, (4)
= − ∑ ( ) ( ( ))(7)
Where fr (μn ) being the successive applications are
given by [16]: where ( ) being the probability of grey images.
2μ 2 0 ≤ μn ≤ 0.5 Another method used to measure the quality of
′ = { n (5) medical images is Wavelet Quality Evaluator (WQE)
1 − 2(1 − μn )2 0.5 ≤ μn ≤ 1
[17]. This measure relies on the wavelet
Finally, defuzzification operation for the contrast- transformation.
enhanced image is calculated by:
International Journal of Intelligent Engineering and Systems, Vol.14, No.1, 2021 DOI: 10.22266/ijies2021.0228.34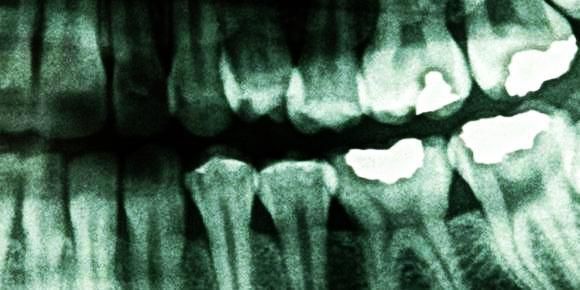
Received: October 9, 2020. Revised: November 12, 2020. 371
(a) (b) (c)
(d) (e) (f)
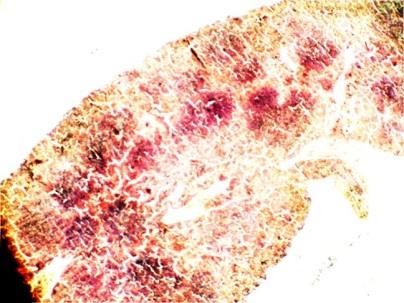
Figure. 2: (a) Original microscope image, (b) image after applying of the membership function and the final enhancement
in (c), and its histogram distributions in (d), (e) and (f).
First, the lighting component is calculated by
using:
= ( , , ) (8)
Then the wavelet mapping of component is
found. Finally, the wavelet quality evaluator is [18]:
= 1/ ( ) (9)
In both scales, increasing values indicates
increased quality. Also was used a Lightness Order
Error (LOE) that depending on the relationship
between the lightness component in the original
image and the enhanced image, this scale measure
naturalness. The lightness as in (Eq. 8), the
difference between of the original lightness image
and its enhanced lightness value can be written as
[19]:
( , ) = ∑ ∑( ( ( , ), ( , ))
=1 =1
⨁ ( ( , ), ( , )) (10)
1, ≥
U (x, y) = { (11)
Figure. 3 Overall process of the proposed algorithm 0,
International Journal of Intelligent Engineering and Systems, Vol.14, No.1, 2021 DOI: 10.22266/ijies2021.0228.34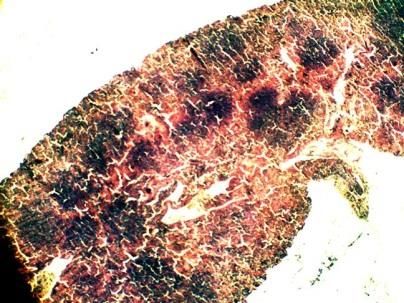
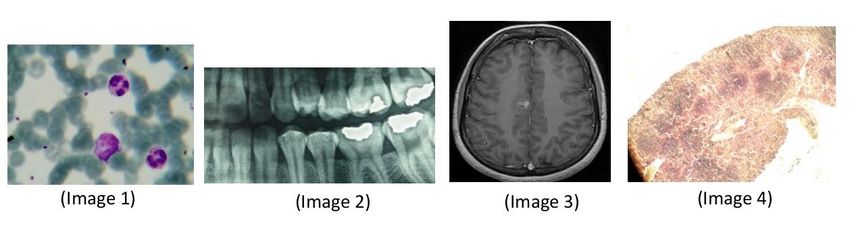
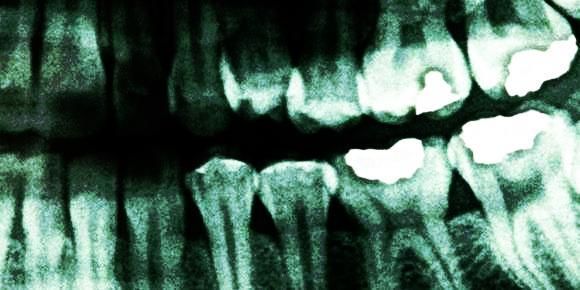
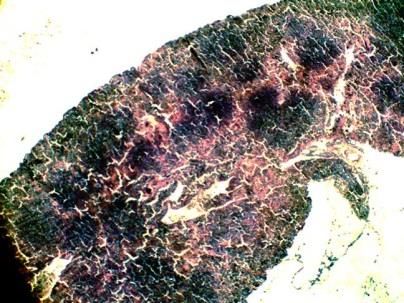
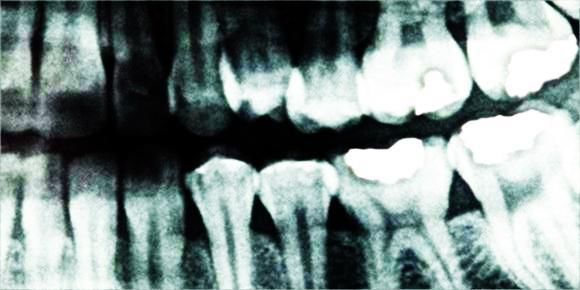
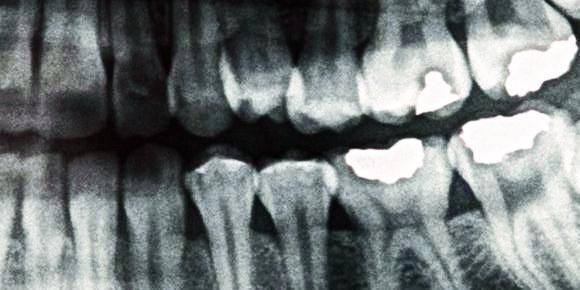
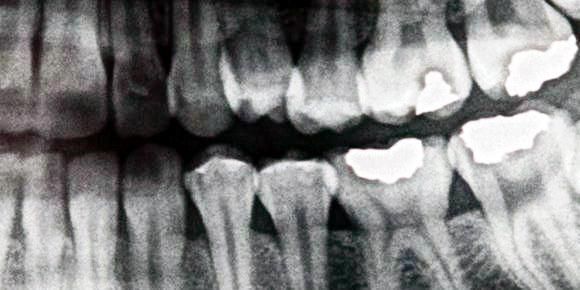
Received: October 9, 2020. Revised: November 12, 2020. 372 Figure. 4 Original medical images used in this study (a) (b) (c) (d) (e) (f) Figure. 5 Image_1 enhncement in: (a) original, (b) FLSMF, (c) FLFMS, (d) FLFMC, (e) HE, and (f) FLBGC. Where m and n are the size of the image, ( , ) size (648×486). All of these medical images were is the unit step function, ⊕ is the convolution operator. processed using the MATLAB software. The The LOE can be calculated as [19]: suggested method FLSMF used in enhanced medical images was compared with another method (FLFMS, 1 FLFMC, HE and FLBGC). In order to find the best LOE = ∗ ∑ =1 ∑ =1 ( , ). (12) way to improve, the entropy value and WQE are calculated. Figs. 5-8) illustrates all images enhanced In this scale, a lower value indicates good by using the five methods. We note through subjective lightness improvement in the enhanced image. evaluation that the best method of enhancement was the proposed method, where it succeeded in 4. Experimental result improving the brightness and contrast for all types of In this research a collection of medical images images (microscopic, x-ray and magnetic resonance) have been improved by using Fuzzy logic depending followed by the FLFMS then FLBGC and FLFMC, on stretch membership function, three types of while the HE was less enhancement. This result also medical images have been improved as illustrated in matches to Table 1 that shows Entropy, WQE and the Fig. 4, the first image (image1.jpg) is microscope LOE of them; we note that the highest values for blood cells image with size (648×486), the second Entropy and WQE scales were for the proposed image (image2.jpg) is dental x-ray image with size method FLSMF, which indicates the increased (580×290), third image (image3.jpg) magnetic contrast and clarity in those images more than the rest resonance images with size (256×256) and forth of the enhanced images. In the same table, we note image (image4.bmp) is microscope colons image with that the few values are in LOE, it was mostly for the International Journal of Intelligent Engineering and Systems, Vol.14, No.1, 2021 DOI: 10.22266/ijies2021.0228.34
Received: October 9, 2020. Revised: November 12, 2020. 373

 (a) (b)

 (c) (d)

 (e) (f)

 Figure. 6 Image_2 enhncement in: (a) original, (b) FLSMF, (c) FLFMS, (d) FLFMC, (e) HE, and (f) FLBGC.

 (a) (b) (c)

 (d) (e) (f)
 Figure. 7 Image_3 enhncement in: (a) original, (b) FLSMF, (c) FLFMS, (d) FLFMC, (e) HE, and (f) FLBGC

International Journal of Intelligent Engineering and Systems, Vol.14, No.1, 2021 DOI: 10.22266/ijies2021.0228.34
Received: October 9, 2020. Revised: November 12, 2020. 374

 (a) (b) (c)

 (d) (e) (f)
 Figure. 8 Image_4 enhncement in: (a) original, (b) FLSMF, (c) FLFMS, (d) FLFMC, (e) HE, and (f) FLBGC.

 Table 1. Entropy, WQE and average of them for the enhancement of the medical image
 Enhancement Image 1 Image 2
 Method Entropy WQE LOE Entropy WQE LOE
 FLFMS [9] 7.005 0.229 101.009 7.653 0.092 51.911
 FLFMC [9] 6.442 0.168 154.100 7.196 0.072 100.272
 HE [6] 5.935 0.164 101.177 5.993 0.103 58.871
 FLBGC[13] 7.168 0.152 114.739 7.454 0.084 152.948
 FLSMF 7.425 0.171 77.538 7.686 0.098 52.562
 Enhancement Image 3 Image 4
 Method Entropy WQE LOE Entropy WQE LOE
 FLFMS [9] 6.384 0.072 73.599 5.046 0.152 150.014
 FLFMC [9] 6.025 0.063 117.170 4.469 0.196 346.820
 HE [6] 5.835 0.054 77.328 4.536 0.029 177.084
 FLBGC[13] 6.965 0.051 124.344 5.387 0.097 205.030
 FLSMF 6.903 0.053 58.886 5.795 0.033 54.128

proposed method, this indicates an improvement in
the goodness of the contrast while maintaining the Conflicts of Interest
lightness.
 The authors declare no conflict of interest.
5. Conclusions Author Contributions
 In this study, medical images were enhanced
 Hazim G. Daway has contributed to the design
using a fuzzy technique. By analyzing these results,
 and implementation of the research by using Matlab.
we can conclude the proposed method FLSMF has
 Rafid Abbas Ali and Asaad M. Abbas have
succeeded in improving various types of medical
 supervised the written paper and providing the
images and it had the good high average value of
 necessary data. All authors approved the final version.
entropy (6.95) and WQE (0.08) and in the same time
lower average value for the LOE (60.77) when it
 References
compared with other algorithms FLFMS, FLFMC,
HE and FLBGC. This indicates that the proposed [1] S. Hassan, H. Daway, and I. Al-Alaway,
algorithm FLSMF succeeded in increasing the “Improving an Illumination System in the
contrast and clarity in those images. Microscopic Imaging of Nuclear Tracks Using

International Journal of Intelligent Engineering and Systems, Vol.14, No.1, 2021 DOI: 10.22266/ijies2021.0228.34
Received: October 9, 2020. Revised: November 12, 2020. 375

 Light Emitting Diode”, Indian Journal of Public [12] J. Kaur and A. Kaur, “Image Contrast
 Health Research & Development, Vol. 9, No. 12, Enhancement method based on Fuzzy Logic and
 pp. 1282-1287, 2018. Histogram Equalization”, International
[2] H. Daway, I. Al-Alaway, and S. Hassan, Research Journal of Engineering and
 “Reconstruction the illumination pattern of the Technology, Vol. 3 No. 5, 2016.
 optical microscope to improve image fidelity [13] A. Nandal and H. Rosales, “Enhanced image
 obtained with the CR-39 detector”, In: Proc. of fusion using directional Contrast rules in fuzzy
 AIP Conf. Proc., Vol. 2144, No. 1, pp. 030006, transform domain”, Springer Plus, Vol. 5, No. 1,
 2019. pp. 1846, 2016.
[3] H. kareem, H. Daway, and E. Daway, [14] D. Mikhov, Y. Kondratenko, G. Kondratenko,
 “Underwater Image Enhancement using Colour and I. Sidenko, “Fuzzy Logic Approach to
 Restoration based on YCbCr Colour Model”, In: Improving the Digital Images Contrast”, In:
 Proc. of IOP Conf. Series: Materials Science Proc. of the IEEE 2nd Ukraine Conf. on
 and Engineering, Vol. 571, No. 1, pp. 1-7, 2019. Electrical and Computer Engineering pp. 1183-
[4] N. Mirza, H. Kareem, and H. Daway, “Low 1188, 2019.
 lightness enhancement using nonlinear filter [15] T. Ross, Fuzzy logic with Engineering
 based on power function”, Journal of Applications, John Wiley & Sons, 2005.
 Theoretical and Applied Information [16] F. Zhou, Z. Jia, J. Yang, and N. Kasabov,
 Technology, Vol. 96. No 1, pp. 61-70, 2019. “Method of improved fuzzy contrast combined
[5] H. Daway, F. Mohammed, and D. Abdulabbas, adaptive threshold in NSCT for medical image
 “Aerial image enhancement using modified fast enhancement”, BioMed Research International,
 visibility restoration based on sigmoid function”, Vol. 2017, 2017.
 Advances in Natural and Applied Sciences, Vol. [17] Rafael C and Richard E, Digital Image
 10, No. 11, pp. 16-22, 2016. Processing, Second Edition, Prentice Hall, 2002.
[6] Z. AMEER, H. Daway, and H. Kareem, [18] S. Ahmed, H. Daway, and H. Rashid, “Quality
 “Enhancement underwater image using of medical microscope Image at different
 histogram equalization based on color lighting condition”, In: Proc. of IOP Conf.
 restoration”, Journal of Engineering and Series: Materials Science and Engineering, Vol.
 Applied Sciences, Vol. 14, No. 2, pp. 641-647, 871, No. 1, pp. 012072, 2020.
 2019. [19] S. Wang, J. Zheng, H. Hu, and B. Li,
[7] Z. Vance and G. James, “Luminance-contrast “Naturalness Preserved Enhancement
 mechanisms in humans: visual evoked potentials Algorithm for Non-Uniform Illumination
 and a nonlinear model”, Vision Research, Vol. Images”, IEEE Transactions on Image
 46, No. 24, pp. 4163-4180, 2006. Processing, Vol. 22, No. 9, pp. 3538-3548, 2013.
[8] H. Daway, E. Daway, and H. Kareem, “Colour
 Image Enhancement by Fuzzy Logic Based on
 Sigmoid Membership Function”, International
 Journal of Intelligent Engineering and Systems,
 Vol. 13, No. 5, pp. 238-246, 2020.
[9] J. Chang and Y. Bo, “A novel nonlinear
 algorithm for typhoon cloud image
 enhancement”, International Journal of
 Automation and Computing, Vol. 8, No. 2, pp.
 161-169, 2011.
[10] M. SJ and M. Rajeswari, “Membership Function
 modification for Image Enhancement using
 fuzzy logic”, International Journal of Emerging
 Trends & Technology in Computer Science
 (IJETTCS), Vol. 2, No. 2, 2013.
[11] G. Raju and M. Nair, “A fast and efficient color
 image enhancement method based on fuzzy-
 logic and histogram”, AEU-International
 Journal of Electronics and Communications,
 Vol. 68, No. 3, pp. 237-243, 2014.

International Journal of Intelligent Engineering and Systems, Vol.14, No.1, 2021 DOI: 10.22266/ijies2021.0228.34
You can also read