Rightmove House Price Index - The largest monthly sample of residential property prices
←
→
Page content transcription
If your browser does not render page correctly, please read the page content below
Rightmove
House Price Index
The largest monthly sample of
residential property prices

    June 2020
  National edition

   Copyright © 2020, Rightmove plc. Released 15th June. For media enquiries and interviews please contact the
   Rightmove press office: T | 020 7087 0605 M | 07894 255295 or E | amy.murphy@rightmove.co.uk
Under embargo for 00.01 hours, Monday 15 th June 2020
Prices up as activity bounces back but 175,000 sellers missing from market
• Average asking price of property coming to market in England up by an average of 1.9% (+£6,266), compared
to March before the housing market was put on hold
• Over 175,000 missing sellers that couldn’t come to market from 24th March to 12th May, but they’ve sprung
into action with record number of owners asking for valuations and daily new listings now up on last year
• Number of sales agreed recovers from a 94% drop to latest daily rate of just 3% down on a year ago:
• 40,000 new sales agreed since market re-opened on 13th May, releasing flood of pent-up demand
• Unique price analysis of new sales agreed indicates upwards price pressure with buyers agreeing to pay
97.7% of the asking price on average, an improvement from 96.6% for sales completed in February
• Number of people phoning and emailing estate agents hits new daily record, 40% above the level seen in
early March
• Delayed spring market leads to traffic boom with Rightmove recording its 10 busiest ever days in May and
June, with home-movers spending over 955,000 hours collectively on 6th June, as England gets moving
National average asking prices (ENGLAND ONLY)
Change since
Month Avg. asking price Annual change Index
March
June 2020 £337,884 +1.9% +2.9% n/a
March 2020 £331,618 n/a +3.5% n/a
National average asking prices by market sector (ENGLAND ONLY, excluding Inner London)
Change since
Sector June 2020 Mar 2020 Annual change
March
First-time buyers £212,528 £209,272 +1.6% +3.7%
Second-steppers £297,757 £292,955 +1.6% +2.7%
Top of the ladder £591,508 £572,773 +3.3% +2.4%
Annual % change of key activity metrics in England - 7 day rolling average
60%
40%
20%
0%
-20%
-40%
-60%
-80%
-100%
07- 14- 21- 28- 04- 11- 18- 25- 02- 09- 16- 23- 30- 06-
Mar Mar Mar Mar Apr Apr Apr Apr May May May May May Jun
Demand New Listings Sales Agreed
2
Copyright © 2020, Rightmove plc. Released 15th June. For media enquiries and interviews please contact the
Rightmove press office: T | 020 7087 0605 M | 07894 255295 or E | amy.murphy@rightmove.co.ukOverview
The price of property coming to market in England is up by an average of 1.9% (+£6,266) to £337,884
this month compared to March, before the housing market was put on hold. Now that the market has
been open since 13th May there is sufficient new seller asking price data for England, though not yet for
Scotland or Wales. The price of property coming to market is an accurate early indicator of pent-up
demand, and this is following through to a rebound in the number of sales agreed in England. New
supply is also starting to recover, though there are over 175,000 missing sellers that would have come
to market between 24th March and 12th May, when compared to the same period in 2019. Whilst it’s still
early days, Rightmove’s statistics covering 95% of the market indicate far more resilience than had
been expected, with a strong initial bounce-back in all metrics.
Miles Shipside, Rightmove director and housing market analyst comments: “Following the initial shock
of the early reopening of the housing market, England is getting moving again with a boom in traffic on
Rightmove. There are no signs of panic selling or even a price dip. Some sellers who had agreed a sale
before lockdown have been worrying that their buyer may try to re-negotiate with a reduced offer. On
this evidence buyers may now be trying to exchange quickly, as there are signs of high pent-up demand
and upwards price pressure, rather than downwards. Lenders may also have been concerned about
price instability affecting the risk profile of their low-deposit mortgages, so hopefully this will give them
more confidence to increase their range of first-time-buyer products.”
The release of pent-up spring demand, fuelled by many people unhappy with their existing home and
looking for more space and a bigger garden, has led to 10 of the busiest traffic days on Rightmove being
recorded in May and June. The busiest day for time spent on the site was Saturday 6th June, with people
collectively spending over 955,000 hours. Browsing has turned into action with the number of home
movers emailing and calling agents via Rightmove in England hitting a record on 8th June, up 40% on the
level recorded in early March. This activity takes time to turn into actual sales being agreed, especially
since the surprise reopening of the market with only a few hours notice meant many estate agents were
not ready for the sudden rush of buyers. Estate agents have agreed 40,000 new sales since the market
reopened in England, recovering from being 94% down when the market was closed, to being 36%
down comparing 13th May - 4th June with the same period last year. A daily look on Friday 5th June sees
sales agreed now down just 3% on the same day last year.
Unique analysis by Rightmove of the prices of over 7,000 newly agreed sales, provided to us by some of
the country’s largest property groups, indicates that buyers are agreeing to pay closer to the asking
price than they were at the beginning of the year. It shows that, on average, between 13th May and 4th
June, buyers were having offers accepted at 97.7% of the last advertised asking price on Rightmove.
Although these sales have not yet completed, they are the most up-to-date view of sales agreed prices
until completion data is available in a few months’ time. Analysis of completion data from Land Registry
for February shows an average of 96.6% achieved of the last advertised price on Rightmove. This
indicates that sales agreed after the market reopened have not only shown price stability but a
likelihood of modest upwards price pressure. It’s important for buyers and sellers to note that the
97.7% figure is an average, with some properties selling for over asking price and others under
depending on local market conditions. There are also regional variations, with the closest to asking
price being achieved in the West Midlands at 98.1%, and the lowest in the North East, at 96.8%.
Shipside observes:”After three months of speculation about prices we now have a month’s worth of
detailed data showing the market bouncing back, and currently with a modest degree of upwards price
pressure showing that those buyers hoping to negotiate hard may find their offer rejected in the
current market. The number of properties coming to market saw the most recent available daily rate
exceed the same day a year ago, but the 175,000 would-be sellers who were unable to come to market
while it was closed means that we will be playing catch up for the rest of the year. Some of those
175,000 now appear to be taking action, given the record number of Rightmove valuation requests to
agents. The figures at present show an activity boosting and price under-pinning dynamic between
supply and demand, driven by low mortgage rates and pent-up housing needs. This positivity will be
3
Copyright © 2020, Rightmove plc. Released 15th June. For media enquiries and interviews please contact the
Rightmove press office: T | 020 7087 0605 M | 07894 255295 or E | amy.murphy@rightmove.co.ukchallenged when unemployment spikes upwards or if mortgage lenders start to pull back from the
market. The early release from housing lockdown has helped to get England moving again, but we’ll
have to wait until the housing markets in Wales and Scotland are similarly released to see if the
whole of Britain gets moving.”
Agents’ views
Andy Shepherd, CEO of Dexters in London, comments: “We’re tremendously busy across all of our
70 London offices. Transactions numbers are increasing daily, over the past two weeks we’ve
agreed sales on over 250 properties and arranged lettings on over 600, so 85 a day or 10 an hour in
the working week. Immediately before lockdown we’d seen the best market for five years. However
comparing last week with the first week of March we are 60% up on transactions. A recurring
theme from both buyers and tenants is the need for more interior space for home working; outside
space, whether a balcony, roof terrace or garden and a more convenient location, whether for
work, leisure or family reasons.”
David Plumtree, Group Chief Executive for Estate Agency at Connells Group, says: “We’ve
experienced brisk levels of activity since the reopening of our branches in England late last month.
So far in June we’re seeing more buyers register with us than during the same period last year –
leading to increased levels of new instructions and sales agreed so far this month. Notably there is
strong demand from first time buyers despite a shortage of higher loan to value mortgage
products. Clearly there is an element of pent-up demand created by lockdown, but it would seem
that the underlying sentiment within the housing market remains positive.”
Oliver Blake, Managing Director of Your Move and Reeds Rains Estate Agents commented: “Where
we live is one of the most important factors in life and the COVID-19 lockdown has forced
everyone to assess their choices, and given many the time to consider alternatives. As soon as the
restrictions on viewing property were lifted in the middle of May we received many more enquiries
about properties for sale by our national network of branches than we expected. Having introduced
virtual viewings and stringent ‘safe agent’ viewing guidelines, we are prepared for what is proving
to be a very busy time.”
Matt Nicol, Managing Director of Nicol & Co in Worcester, said: “Echoing others in the industry,
there has been a pent-up demand for the short supply of stock which has led to some good deals
tying up. The challenge has been to service everyone and manage their expectations. Covid-19 is
still a very real threat, and the safety of our staff and clients has had to remain a priority. We’ve
taken to livestreaming all instructions to be our first step in the journey and with great success. We
now carry out less physical viewings with very eager clients that then make quick decisions to offer.
We’ve heard that lenders pulling some of the 90% LTV rates is because they simply cannot deal the
volume of applications without service levels dropping, so buyers and sellers need to hear that
from agents to maintain confidence in this market.”
4
Copyright © 2020, Rightmove plc. Released 15th June. For media enquiries and interviews please contact the
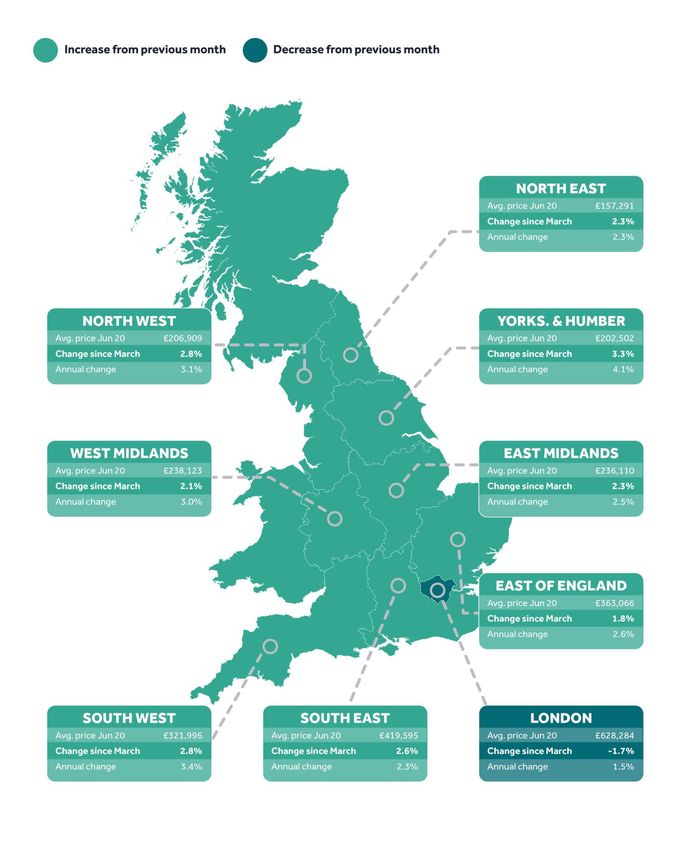
Rightmove press office: T | 020 7087 0605 M | 07894 255295 or E | amy.murphy@rightmove.co.ukRegional trends – England only
5
Copyright © 2020, Rightmove plc. Released 15th June. For media enquiries and interviews please contact the
Rightmove press office: T | 020 7087 0605 M | 07894 255295 or E | amy.murphy@rightmove.co.ukRegional trends – England only
% of asking price % of asking price
achieved – 13th May to achieved – Feb 2020
Region
4th June 2020 (Rightmove analysis of
(Rightmove analysis) Land Registry)
East Midlands 97.9% 96.9%
East of England 97.6% 96.4%
London 97.5% 96.2%
North East 96.8% 95.8%
North West 97.9% 96.3%
South East 97.5% 96.6%
South West 97.6% 96.7%
West Midlands 98.1% 97.1%
Yorkshire and The Humber 97.8% 96.8%
6
Copyright © 2020, Rightmove plc. Released 15th June. For media enquiries and interviews please contact the
Rightmove press office: T | 020 7087 0605 M | 07894 255295 or E | amy.murphy@rightmove.co.ukEditor’s notes
About the Index:
Thank you to the property groups who contributed their SSTC price data, including Countrywide, Connells, LSL,
Purplebricks, Hunters, Dexters, Cubitt & West, Douglas Allen, Wards and Pittis.
The Rightmove House Price Index methodology was updated in January 2018. The report now includes data for
Scotland and a number of measures have been refined. The stock per agent figure now calculates the average based
on the number of properties an agent has on Rightmove each day across the month, rather than the average of the
total number of properties each agent advertised in the month. London asking prices are now broken down into travel
zones. For the purpose of historical comparisons, the historical figures have been restated based on the new
methodology.
The Index includes asking price breakdowns in the housing market to offer trends at three different sectors of the
market: first-time buyer, second-stepper and top of the ladder. Inner London prices have been excluded from this
categorisation as the normal housing ladder is not really applicable.
Advertising property for over 90% of all UK estate agents, Rightmove is in a unique position to identify any immediate
changes in the market. Rightmove’s House Price Index is compiled from the asking prices of properties coming onto
the market via over 13,000 estate agency branches listing on Rightmove.co.uk. Rather than being a survey of opinions
as with some other indices, it is produced from factual data of actual asking prices of properties currently on the
market. The sample includes up to 200,000 homes each month – representing circa 95% of the market, the largest and
most up-to-date monthly sample of any house price indicator in the UK. The Index differs from other house price
indicators in that it reflects asking prices when properties first come onto the market, rather than those recorded by
lenders during the mortgage application process or final sales prices reported to the Land Registry. In essence,
Rightmove’s Index measures prices at the very beginning of the home buying and selling process while other indices
measure prices at points later in the process. Having a large sample size and being very up-to-date, the Rightmove
Index has established itself as a reliable indicator of current and future trends in the housing market.
Rightmove measured 67,123 asking prices this month in England, circa 95% of the UK market. The properties were put
on sale by estate agents from 10th May to 6th June and advertised on Rightmove.co.uk.
Market sectors explained:
First-time buyer: This figure represents the typical property a first-time buyer would purchase, covering all two bed
properties and smaller that come to market (houses and flats).
Second-stepper: This figure represents the typical property of a person moving from their first home, covering all
three and four bed properties that come to market (houses and flats) excluding four bed detached houses.
Top of the ladder: This figure represents asking prices at the top end of the market, covering all five bed properties
and above (houses and flats), as well as four bed detached houses.
About Rightmove.co.uk:
Rightmove.co.uk is the UK’s leading property website, displaying details of homes for sale or rent to the largest online
audience. It is consistently ranked the number one property website in the UK (source: Experian Hitwise). It has circa
95% of all properties for sale and at any time displays a stock of over one million properties to buy or rent. The
Rightmove.co.uk site attracts nearly 141 million visits from home movers each month with time on site averaging 1.1
billion minutes per month (Rightmove data, July 2019).
7
Copyright © 2020, Rightmove plc. Released 15th June. For media enquiries and interviews please contact the
Rightmove press office: T | 020 7087 0605 M | 07894 255295 or E | amy.murphy@rightmove.co.ukYou can also read