Intel optane Memory CCG Marketing

Page created by Allen Saunders
 
CONTINUE READING
Intel optane Memory CCG Marketing
Intel® optane™ Memory

CCG Marketing
Intel optane Memory CCG Marketing
Legal Disclaimer
      Intel technologies’ features and benefits depend on system configuration and may require enabled hardware, software or service
      activation. Performance varies depending on system configuration. No computer system can be absolutely secure. Check with your
      system manufacturer or retailer or learn more at intel.com.

      Results have been estimated or simulated using internal Intel analysis or architecture simulation or modeling, and provided to you for
      informational purposes. Any differences in your system hardware, software or configuration may affect your actual performance.

      Software and workloads used in performance tests may have been optimized for performance only on Intel microprocessors.
      Performance tests, such as SYSmark* and MobileMark*, are measured using specific computer systems, components, software,
      operations and functions. Any change to any of those factors may cause the results to vary. You should consult other information and
      performance tests to assist you in fully evaluating your contemplated purchases, including the performance of that product when
      combined with other products. For more information go to http://www.intel.com/performance.

      All information provided here is subject to change without notice. Contact your Intel representative to obtain the latest Intel product
      specifications and roadmaps

      Intel, the Intel logo, Optane, 3D XPoint, Intel Atom, Intel. Experience What's Inside, the Intel. Experience What's Inside logo and Intel Core
      are trademarks of Intel Corporation in the U.S. and/or other countries.

      *Other names and brands may be claimed as the property of others.

      © 2017 Intel Corporation.
CCG Marketing                                                                                                                                          2
Intel optane Memory CCG Marketing
AGENDA      •   Market landscape
                •   What is Intel® Optane™ memory
                •   Performance benefits
                •   User impact
                •   Launch momentum and timeline

CCG Marketing                                       3
Intel optane Memory CCG Marketing
Performance computing is growing
                                                                    Top Purchase Drivers for Desktops1
                          Performance                                        Security                                                         Storage Capacity
                                                                                of personal information / data

                              Computing                                                                                                 Storage

                                                                                                                                   Intel® Optane™ memory
                           7th Gen Intel® Core™ Processor                                                                          Smart and adaptable
                                                                                                                                   system acceleration

CCG Marketing   1) IMRA February 2016 AIO and Desktop buyer Study – US Report                      3) JPR (Jon Peddie Research), Jan 2017                        4
Intel optane Memory CCG Marketing
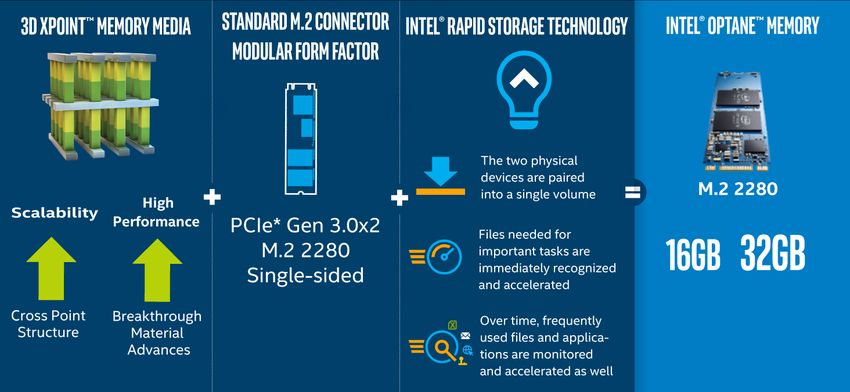
Desktop Buyers want large local storage
           As the amount of data generated increases…                                                                                       Desktop 2017 Storage Forecast
         so will the need for large capacity storage                                                                                        HDDs1,2                                           SSDs1,2
                                                                                                                                            ~ 79% of DT in 2017                               ~ 18% of DT in 2017

                                Grand Theft                           Windows* 10x64
                                                                            disk space
                                                                                                                                         Worldwide Mix of Desktop PC Shipments
                                  Auto* V4                                 requirement 5                                                  by Storage Device Type, 2015–20201

                                 ~65 GB                                    ~20 GB
                                                                                                                                 100%
                                                                                                                                  80%
                                                                                                                                  60%

                                                          4K
                                                                                                                                  40%

                   4K                                                                                                             20%

                RaW Video3                           GoPro* Video6                                                                 0%

          ~742 GB        /hr
                                                     ~29 GB/hr                                                                              2015
                                                                                                                                                 HDD
                                                                                                                                                        2016        2017
                                                                                                                                                           Dual-Drive System
                                                                                                                                                                                2018
                                                                                                                                                                                      SSHD
                                                                                                                                                                                              2019
                                                                                                                                                                                                  SSD
                                                                                                                                                                                                        2020

                                                                                                                              1) IDC Worldwide Solid State Drive Forecast Update, 2016–2020
                                                                                                                              2) SSHD, Dual-Drive, and embedded NAND not shown

      Typically, choosing large local storage = lower overall system performance
                3)   http://www.4kshooters.net/2014/06/25/how-much-hard-disk-space-do-you-need-shooting-4k/
                4)   https://support.rockstargames.com/hc/en-us/articles/203428177-Grand-Theft-Auto-V-PC-System-Spec
                5)   https://www.microsoft.com/en-us/windows/windows-10-specifications
CCG Marketing   6)   http://shop.gopro.com/cameras
                                                                                                                       *Other names and brands may be claimed as the property of others                             5
Intel optane Memory CCG Marketing
What is Intel® Optane™ Memory?

                                                                                                                                                   FOR 7th Gen Intel® Core™ Platform

   Intel® Optane™ memory requires specific hardware and software configuration. Visit www.intel.com/OptaneMemory for configuration requirements.

CCG Marketing   *Other names and brands may be claimed as the property of others                                                                                                       6
Intel optane Memory CCG Marketing
Intel® Optane™ Technology - End User target Markets               End-User Configuration                 Intel® Optane™ Memory Use Case
                              Recommended Storage configuration        Dual-Drive Configuration                                  Intel® Optane™ memory + HDD
                                    Intel® Optane™                     SSD + HDD                                                 Get high performance and large capacity
                                                                       (with supported processors and chipsets)                  storage without having to manage files
                          7th
                       Gen Intel®         SSD
                        Core™ i7                                                                                                 Intel® Optane™ memory + HDD
                       Processor                                       Standalone HDD Configuration                              Get high performance and large capacity
                                                                       (with supported processors and chipsets)
                          SSD                                                                                                    storage
                     eSport Gamer
                                           NAND SSD                    Standalone SATA SSD                                       Intel® Optane™ memory + SATA SSD
                       7th Gen                                         Configuration
                                                                                                                                 Get high performance and eliminate the SATA-
                                                                                                                                 interface read bottleneck
                 Intel® Core™ i5 / i7         Intel® Optane™
                                                                       (with supported processors and chipsets)
                                                                                                                  (Note performance increase is less than Intel® Optane™ memory + HDD)

                      Processor                  Memory                                                                          Intel® Optane™ memory + SSHD
                SSD or hybrid or dual                                  Standalone SSHD Configuration                             Get high performance and eliminate the SATA-
                                                                       (with supported processors and chipsets)                  interface read bottleneck
                  Fanatic Gamer                                                                                   (Note performance increase is less than Intel® Optane™ memory + HDD)

                                                                       6th Gen Intel® Core™ Processor,                           N/A; 6th Gen Intel® Core™
                                                      Intel® Optane™
                                                                       Intel® 100 Series Chipset and Intel®                      processors and Intel® 100 series
                                                         Memory
                      7th Gen                                          Rapid Storage Technology                                  chipsets are not supported
                Intel® Core™ i3 / i5
                                                                       Accelerate a Non-Boot Drive in a                          N/A; Non-boot drive acceleration is
                    Processor                                          Dual-Drive Configuration                                  not supported
                        HDD
                                                                       7th Intel® Core™ Processor and                            N/A; Intel® 100 series chipsets are
                                                                       Intel® 100 Series Chipset                                 not supported

                                                                       Multiple HDDs / SSDs in RAIDed                            N/A; RAID configurations are not
                                                                       Configuration                                             supported

CCG Marketing                                                                                                                                                                            7
Intel optane Memory CCG Marketing
Performance benefits from Intel® Optane™ Memory
                                                           16GB Intel® Optane™ Memory + HDD                                                                                                          SYSmark* 2014 SE Comparison
                                                                                                            Up to                                                                 2,5
                                                                 Everyday Tasks1
                                                                                               2x More Responsive                                                                                                                                            2,04
                                                                                                            Up to

                                                                                                                                          Relative Performance Higher is Better
                                                      Storage Performance2
      Mainstream
                                                                                                                                                                                  2,0
                                                                                                      14x Faster
                                                                                                            Up to
                                                       Computer Boot Time3                                                                                                                    1,28                             1,09            1,10
                                                                                                       2x Faster                                                                  1,5                           1,12
                                                                                                            Up to
                                                      Launch Web Browser4
                                                                                                       5x Faster                                                                          1,00             1,00             1,00           1,00           1,00
                                                                                                                                                                                  1,0
                                                                                                            Up to
                                                                   Launch Game5
                                                                                                     67% Faster
       Enthusiast                                           Game Level Load5
                                                                                                            Up to
                                                                                                     65% Faster
                                                                                                                                                                                  0,5

                                                                                                            Up to
                                          Open Large Media Projects6                                  4.1x Faster
                                                                                                                                                                                  0,0
                                                                                                                                                                                        SYSmark* 2014         Office      Media Creation Data/Financial Responsiveness
                                                                                                                                                                                        SE Overall Score   Productivity                    Analysis
                                                                                                            Up to
                                                                    Launch Email7                                                                                                                                          SYSmark 2014 SE subscores
                                                                                                      5.8x Faster

                Business                           Launch Presentations8
                                                                                                            Up to
                                                                                                      3.8x Faster
                                                                                                            Up to
                                                                                                                                                                                                 1TB HDD
                                                                                                                                                                                                 1TB HDD + 16GB Intel® Optane™ Memory
                                                     Windows* File Search9
                                                                                                       4x Faster
1SYSmark 2014 SE (Responsiveness Subscore) 2PCMark* Vantage (HDD Suite) 3OS Load Time Workload 4Browser Launch Workload 5Game Launch & Level Load Workload 6Media Project Load Workload 7Email Launch Workload
8PresentationLaunch Workload 9File Search Workload                         See Appendix I for additional configuration and workload details
*Other names and brands may be claimed as the property of others           • All testing done internally by Intel
Software and workloads used in performance tests may have been optimized for performance only on Intel® microprocessors.
Performance tests, such as SYSmark* and MobileMark*, are measured using specific computer systems, components, software, operations, and functions. Any change to any of those factors may cause the results to vary. You should consult other information
and performance tests to assist you in fully evaluating your contemplated purchases, including the performance of that product when combined with other products. For more information, go to www.intel.com/benchmarks.

CCG Marketing                                                                                                                                                                                                                                                            8
Intel optane Memory CCG Marketing
Intel® Optane™ memory offers better end user value
          16GB Intel® Optane™ memory + 1TB HDD 4GB DDR delivers better responsiveness than 1TB HDD 8GB DDR

                            Intel® Optane™ Memory
                            Delivers Visible Benefits                                                                                                         SYSmark* 2014 SE Comparison

                                                                                                   Relative Performance (Higher is better)
                                                                                                                                             2,5
                       SYSmark* 2014 SE Overall Score                                                                                                                                                                               1,97
                                                                                                                                             2,0
                                                                                                                                                             1,27             1,12              1,07               1,08
                  2x2GB
                     2x2GB  w/w/16GB
                                 16GB                                                                                                        1,5
                   Intel®
                      Intel®Optane™
                             Optane™                                              1,31                                                                1,00             1,00              1,00               1,00             1,00
                         Memory
                            Memory                                                                                                           1,0

                                                                                                                                             0,5
                               2x4GB
                                 2x4GB                                     1,03
                                                                                                                                             0,0
                                                                                                                                                   SYSmark* 2014         Office      Media Creation       Data/Financial   Responsiveness
                                 2x2GB
                               2x2GB                                     1,00                                                                      SE Overall Score   Productivity                          Analysis

                                                                                                                                                                                         SYSmark 2014 SE subscores
                                         0,0           0,5           1,0          1,5
                                                                                                                                                                                 2x4GB                 2x2GB w/ 16GB
                              Relative Score (Higher is better)                                                                                                                                        Intel® Optane™ Memory
                                                                                                         All testing done internally by Intel.
                                                                                                         See Appendix I for System Configuration and testing procedures.
                                                                                                         Note: Some applications and most games may require 8GB of DRAM memory for loading with or without Intel® Optane™ memory.

*Other names and brands may be claimed as the property of others
Software and workloads used in performance tests may have been optimized for performance only on Intel microprocessors.
Performance tests, such as SYSmark and MobileMark, are measured using specific computer systems, components, software, operations and functions. Any change to any of those factors may cause the results to vary. You should consult other information and
performance tests to assist you in fully evaluating your contemplated purchases, including the performance of that product when combined with other products. For more complete information visit www.intel.com/benchmarks.

CCG Marketing                                                                                                                                                                                                                                             9
Intel optane Memory CCG Marketing
Enhance the PC Experience with Intel® Optane™ memory
          Each day on average a typical user will…

                                                                                                                  Go through                                                                      Consumer
                                                                                                                      ~2                     ~2                Power

                                                                                                                                                                                                   ~80                                          Distinct
                                                                                                                              1,2                      2,7
                                                                                                                                                               Cycles
                                                                                                                                                                                                                                                Events
                                                                                                                  Consumer                   IT User

                                                                                                                  Launch
                                                                                                                    ~113,4 ~14                           8,9
                                                                                                                                                               Unique                              IT User

                                                                                                                                                                                                   ~114                                         Distinct
                                                                                                                  Consumer                   IT User           Applications
                                                                                                                   Launch each app
                                                                                                                      ~7
                                                                                                                  Consumer
                                                                                                                              5,6
                                                                                                                                            ~8
                                                                                                                                            IT User
                                                                                                                                                       10,11
                                                                                                                                                               Different
                                                                                                                                                               Times                               where the user will experience the benefits
                                                                                                                                                                                                                                                Events
                                                                                                                                                                                                     of Intel® Optane™ memory each day.
1) Source: Intel® Product Improvement Program Q4‘16: 512,070 systems (483,403 desktop, 28,667 AIO) Windows 10*. Intel® Core™ processors                7) Source: Intel® Product Improvement Program Q1‘17: 35,187 systems, Desktop/Laptop/2 in 1 Windows 10*. Intel® Core™ processors
2) Power cycles include on, off, and sleep states                                                                                                      8) Source: Intel® Product Improvement Program Q1‘17: 12,419 systems, Desktop/Laptop/2 in 1 Windows 10*. Intel® Core™ processors
3) Source: Intel® Product Improvement Program Q4‘16: 1,081,148 systems. Average 11 apps opened per day. Windows 10*. Intel® Core™ processors           9) Statistic represents an average across distinct applications. Actual number of applications opened per day may be higher. For instance, if
4) Statistic represents an average across distinct applications. Actual number of applications opened per day may be higher. For instance, if Chrome   Chrome* is opened 5 times a day it is counted only once in the this calculation.
is opened 5 times a day it is counted only once in the this calculation.                                                                               10) Source: Intel® Product Improvement Program Q1‘17: 12,419 systems, Desktop/Laptop/2 in 1 Windows 10*. Intel® Core™ processors
5) Source: Intel® Product Improvement Program Q4‘16: 1,081,148 systems. Average 11 apps opened per day. Windows 10*. Intel® Core™ processors           11) Statistic represents an average across all applications across all systems. This number can vary depending on the application. For instance,
6) Statistic represents an average across all applications across all systems. This number can vary depending on the application.                      this number can be higher for an application like Chrome* and much lower for an application like iTunes* or Calculator, etc…
For instance, this number can be higher for an application like Chrome* and much lower for an application like iTunes* or Calculator, etc…

CCG Marketing          *Other names and brands may be claimed as the property of others                                                                                                                                                                                                              10
Intel® Optane ™ memory
        LaunchED March 27th 2017
      CES in January                                                               Available Today          Q2 2017 onwards
    Intel® Optane™ Ready Program
                                                                              130+ Intel® Optane™ Memory    Intel® Optane™ Memory Enabled
    Launch Alongside 7th Gen Intel®
                Core™                                                        Ready Motherboards in Market      System and Motherboards

CCG Marketing   *Other names and brands may be claimed as the property of others                                                         11
Queue Depth
      Queue depth is the number of pending input/output (I/O) requests for a volume.
                         PCMark* Vantage Queue Depth1                                                                           Various Workload Demo Queue Depth1
    100%
                                                                                                                 100%
      80%
                                                                                                                   80%
      60%
                                                                                                                   60%

      40%                                                                                                          40%

      20%                                                                                                          20%

        0%                                                                                                           0%
                  1      2     3      4     5     6      7     8      9    10 32 33 34                                           1        2       3        4        5       6    7        8       9       10
                                          Queue Depth                                                                                                     Queue Depth
                         All Suites Reads                          All Suites Writes
                         HDD Suite Reads                           HDD Suite Writes                                                    Consumer Reads                            Office Reads
                                                                                                                                       SolidWorks Reads                          Developer Reads
1)Based on internal intel queue depth trace analysis; see appendix II ; See Appendix II for System Configuration and testing procedures. All testing done internally by Intel
 *Other names and brands may be claimed as the property of others; Software and workloads used in performance tests may have been optimized for performance only on Intel® microprocessors.
Tests measure performance of components on a particular test, in specific systems. Differences in hardware, software, or configuration will affect actual performance. Consult other sources of information to
evaluate performance as you consider your purchase. For more complete information about performance and benchmark results, visit http://www.intel.com/performance

CCG Marketing                                                                                                                                                                                                    12
Queue Depth Distribution for Common Application Launches
                                 Read Queue Depth1                                                                                                  Write Queue Depth1
  100%                                                                                                              100%

   80%                                                                                                                80%

   60%                                                                                                                60%

   40%                                                                                                                40%

   20%                                                                                                                20%

     0%                                                                                                                 0%
                 1             2            3            4            5            6                                              1       2       3       4      5       6       7     8        9   10

                        Acrobat                       Photoshop Elements                                                                   Acrobat                       Photoshop Elements

                        Premiere Elements             Excel                                                                                Premiere Elements             Excel

                        Word                          OneNote                                                                              Word                          OneNote

                        Outlook                       PowerPoint                                                                           Outlook                       PowerPoint

                        SolidWorks                    Windows Media Player                                                                 SolidWorks                    Windows Media Player

                        iTunes                                                                                                             iTunes

1)Based on internal intel queue depth trace analysis; see appendix II ; See Appendix II for System Configuration and testing procedures. All testing done internally by Intel
 *Other names and brands may be claimed as the property of others; Software and workloads used in performance tests may have been optimized for performance only on Intel® microprocessors.
Tests measure performance of components on a particular test, in specific systems. Differences in hardware, software, or configuration will affect actual performance. Consult other sources of information to evaluate
performance as you consider your purchase. For more complete information about performance and benchmark results, visit http://www.intel.com/performance

CCG Marketing                                                                                                                                                                                                     13
Queue Depth Distribution for Typical Work Day
                                 Read Queue Depth1                                                                                            Writes Queue Depth1
       100%                                                                                                         100%

         80%                                                                                                          80%

         60%                                                                                                          60%

         40%                                                                                                          40%

         20%                                                                                                          20%

           0%                                                                                                           0%
                      1      2      3     4      5      6      7      8     9     10 32                                            1      2      3      4     5      6      7    8    9    10 32

                      Day 1              Day 2              Day 3            Day 4                                                  Day 1             Day 2              Day 3         Day 4
                      Day 5              Day 6              Day 7            Day 8                                                  Day 5             Day 6              Day 7         Day 8
                      Day 9              Day 10                                                                                     Day 9             Day 10

1)Based on internal intel queue depth trace analysis; see appendix II ; See Appendix II for System Configuration and testing procedures. All testing done internally by Intel
 *Other names and brands may be claimed as the property of others; Software and workloads used in performance tests may have been optimized for performance only on Intel® microprocessors.
Tests measure performance of components on a particular test, in specific systems. Differences in hardware, software, or configuration will affect actual performance. Consult other sources of information to evaluate
performance as you consider your purchase. For more complete information about performance and benchmark results, visit http://www.intel.com/performance

CCG Marketing                                                                                                                                                                                                     14
Average QD Distribution : All Client Workloads
                          Read Queue Depth1 and 4K Random Read IOPS                                                                                                      Benchmarks
         100,00%
           90,00%
           80,00%
           70,00%
                                                                                                                                                                Application Launches
           60,00%
           50,00%                                                                                                         Average QD
           40,00%
           30,00%                                                                                                                                           Various Client Workloads
           20,00%
           10,00%
            0,00%
                       1 2 3 4 5 6 7 8 9 10 11 12 13 14 15 16 17 18 19 20 21 22 23 24 25 26 27 28 29 30 31 32                                                 Typical Workday Trace

                 All Trace Data indicates, Performance needed at Low QD’s where it matters most for most Client Workloads
1)Based on internal intel queue depth trace analysis; see appendix II ; See Appendix II for System Configuration and testing procedures. All testing done internally by Intel
 *Other names and brands may be claimed as the property of others; Software and workloads used in performance tests may have been optimized for performance only on Intel® microprocessors.
Tests measure performance of components on a particular test, in specific systems. Differences in hardware, software, or configuration will affect actual performance. Consult other sources of information to evaluate
performance as you consider your purchase. For more complete information about performance and benchmark results, visit http://www.intel.com/performance
CCG Marketing                                                                                                                                                                                                     15
QD and 4k Random Read IOPS : Different Storage Devices
                                                                     Read Queue Depth and 4K Random Read IOps
     100,00%                                                                                                                                                                                        500
       90,00%                                                                                                                                                                                       450
       80,00%                                                                                                                                                                                       400
       70,00%                                                                                                                                                                                       350
       60,00%                                                                                                                                                                                       300
       50,00%                                                                                                                                                                                       250
       40,00%                                                                                                                                                                                       200
       30,00%                                                                                                                                                                                       150
       20,00%                                                                                                                                                                                       100
       10,00%                                                                                                                                                                                       50
         0,00%                                                                                                                                                                                      0
                        1 2 3 4 5 6 7 8 9 10 11 12 13 14 15 16 17 18 19 20 21 22 23 24 25 26 27 28 29 30 31 32
                                                                                            HDD                   Average QD
1)Based on internal intel queue depth trace analysis; see appendix II ; See Appendix II for System Configuration and testing procedures. All testing done internally by Intel
 *Other names and brands may be claimed as the property of others; Software and workloads used in performance tests may have been optimized for performance only on Intel® microprocessors.
Tests measure performance of components on a particular test, in specific systems. Differences in hardware, software, or configuration will affect actual performance. Consult other sources of information to evaluate
performance as you consider your purchase. For more complete information about performance and benchmark results, visit http://www.intel.com/performance
CCG Marketing                                                                                                                                                                                                     16
QD and 4k Random Read IOPS : Different Storage Devices
                                                                  Read Queue Depth and 4K Random Read IOps
  100,00%                                                                                                                                                                                          200000
    90,00%                                                                                                                                                                                         180000
    80,00%                                                                                                                                                                                         160000
    70,00%                                                                                                                                                                                         140000
    60,00%                                                                                                                                                                                         120000
    50,00%                                                                                                                                                                                         100000
    40,00%                                                                                                                                                                                         80000
    30,00%                                                                                                                                                                                         60000
    20,00%                                                                                                                                                                                         40000
    10,00%                                                                                                                                                                                         20000
      0,00%                                                                                                                                                                                        0
                    1     2    3     4    5     6    7     8    9 10 11 12 13 14 15 16 17 18 19 20 21 22 23 24 25 26 27 28 29 30 31 32
                                                                                          HDD                   Average QD
1)Based on internal intel queue depth trace analysis; see appendix II ; See Appendix II for System Configuration and testing procedures. All testing done internally by Intel
 *Other names and brands may be claimed as the property of others; Software and workloads used in performance tests may have been optimized for performance only on Intel® microprocessors.
Tests measure performance of components on a particular test, in specific systems. Differences in hardware, software, or configuration will affect actual performance. Consult other sources of information to evaluate
performance as you consider your purchase. For more complete information about performance and benchmark results, visit http://www.intel.com/performance
CCG Marketing                                                                                                                                                                                                     17
QD and 4k Random Read IOPS : Different Storage Devices
                                                                           Read Queue Depth and 4K Random Read IOps
                 100,00%                                                                                                                                                                   200000
                   90,00%                                                                                                                                                                  180000
                   80,00%                                                                                                                                                                  160000
                   70,00%                                                                                                                                                                  140000
                   60,00%                                                                                                                                                                  120000
                   50,00%                                                                                                                                                                  100000
                   40,00%                                                                                                                                                                  80000
                   30,00%                                                                                                                                                                  60000
                   20,00%                                                                                                                                                                  40000
                   10,00%                                                                                                                                                                  20000
                     0,00%                                                                                                                                                                 0
                                   1 2 3 4 5 6 7 8 9 10 11 12 13 14 15 16 17 18 19 20 21 22 23 24 25 26 27 28 29 30 31 32
                                                                 HDD                                SATA SSD                                     Average QD

1)Based on internal intel queue depth trace analysis; see appendix II ; See Appendix II for System Configuration and testing procedures. All testing done internally by Intel
 *Other names and brands may be claimed as the property of others; Software and workloads used in performance tests may have been optimized for performance only on Intel® microprocessors.
Tests measure performance of components on a particular test, in specific systems. Differences in hardware, software, or configuration will affect actual performance. Consult other sources of information to evaluate
performance as you consider your purchase. For more complete information about performance and benchmark results, visit http://www.intel.com/performance
CCG Marketing                                                                                                                                                                                                     18
QD and 4k Random Read IOPS : Different Storage Devices
                                                                    Read Queue Depth and 4K Random Read IOps
     100,00%                                                                                                                                                                                           180000
       90,00%                                                                                                                                                                                          160000
       80,00%                                                                                                                                                                                          140000
       70,00%
                                                                                                                                                                                                       120000
       60,00%
                                                                                                                                                                                                       100000
       50,00%
                                                                                                                                                                                                       80000
       40,00%
                                                                                                                                                                                                       60000
       30,00%
       20,00%                                                                                                                                                                                          40000

       10,00%                                                                                                                                                                                          20000

        0,00%                                                                                                                                                                                          0
                      1     2     3    4     5     6    7     8    9 10 11 12 13 14 15 16 17 18 19 20 21 22 23 24 25 26 27 28 29 30 31 32

                                                                         HDD             SATA SSD               NVMe SSD                Average QD
1)Based on internal intel queue depth trace analysis; see appendix II ; See Appendix II for System Configuration and testing procedures. All testing done internally by Intel
 *Other names and brands may be claimed as the property of others; Software and workloads used in performance tests may have been optimized for performance only on Intel® microprocessors.
Tests measure performance of components on a particular test, in specific systems. Differences in hardware, software, or configuration will affect actual performance. Consult other sources of information to evaluate
performance as you consider your purchase. For more complete information about performance and benchmark results, visit http://www.intel.com/performance
CCG Marketing                                                                                                                                                                                                     19
QD and 4k Random Read IOPS : Different Storage Devices
                                                                       Read Queue Depth and 4K Random Read IOps
         100,00%                                                                                                                                                                                   200000
           90,00%                                                                                                                                                                                  180000
           80,00%                                                                                                                                                                                  160000
           70,00%                                                                                                                                                                                  140000
           60,00%                                                                                                                                                                                  120000
           50,00%                                                                                                                                                                                  100000
           40,00%                                                                                                                                                                                  80000
           30,00%                                                                                                                                                                                  60000
           20,00%                                                                                                                                                                                  40000
           10,00%                                                                                                                                                                                  20000
             0,00%                                                                                                                                                                                 0
                           1     2    3    4     5    6    7     8    9 10 11 12 13 14 15 16 17 18 19 20 21 22 23 24 25 26 27 28 29 30 31 32
                               HDD                        SATA SSD                           NVMe SSD                            Intel® Optane™ Memory                             Average QD

1)Based on internal intel queue depth trace analysis; see appendix II ; See Appendix II for System Configuration and testing procedures. All testing done internally by Intel
 *Other names and brands may be claimed as the property of others; Software and workloads used in performance tests may have been optimized for performance only on Intel® microprocessors.
Tests measure performance of components on a particular test, in specific systems. Differences in hardware, software, or configuration will affect actual performance. Consult other sources of information to evaluate
performance as you consider your purchase. For more complete information about performance and benchmark results, visit http://www.intel.com/performance
CCG Marketing                                                                                                                                                                                                     20
Latency
       Latency is the time required to process a data request
                                                                                   PCMark* Vantage Latency : HDD Only                                        All Suites Reads             HDD Suite Reads

                           50
                           40
         Percentage %

                           30
                           20
                           10
                           0
                                0      256                     512                    768                    1024                    1280                   1536                   1792                2048
                                                                                                         Latency in µs

                                                                  PCMark* Vantage Latency : Intel® Optane™ Memory + HDD Only                                    All Suites Reads            HDD Suite Reads
                           50
                           40
            percentage %

                           30
                           20
                           10
                            0
                                0       256                    512                     768                   1024                   1280                    1536                   1792                2048
                                                                                                        Latency in µs
1)Based on internal intel queue depth trace analysis; see appendix II ; See Appendix II for System Configuration and testing procedures. All testing done internally by Intel
 *Other names and brands may be claimed as the property of others; Software and workloads used in performance tests may have been optimized for performance only on Intel® microprocessors.
Tests measure performance of components on a particular test, in specific systems. Differences in hardware, software, or configuration will affect actual performance. Consult other sources of information to evaluate
performance as you consider your purchase. For more complete information about performance and benchmark results, visit http://www.intel.com/performance
CCG Marketing                                                                                                                                                                                                     21
Summary
  • All Trace Data indicates, Performance needed at Low Queue
    Depths where it matters for most client workloads
  • Performance where it matters, no Queue Depth dependency
    for client workloads with Intel® Optane™ Memory installed in
    the system
  • Comes with a smart acceleration software to make the PC
    increasingly more responsive to every individual user

CCG Marketing                                                      22
Appendix I

CCG Marketing
Baseline (HDD)                                                                    Configuration
  Intel® Core™ i5-7500 Processor, 65W TDP, 4C4T, Turbo up to 3.8GHz, Memory: 2x4GB DDR4-2400, Storage: Western Digital* 1TB 7200RPM WD1003FZEX, Intel HD
  Graphics 630, OS: Windows* 10
  Intel® Optane™ Memory
  Same configuration as above with 16GB Intel® Optane™ Memory Module (Engineering Sample)
  Gaming workloads were tested with same configuration, except using a discrete graphics card (NVIDIA* (EVGA) GTX 1080) with and without 16GB Intel® Optane™
  Memory Module
  Tested with 16GB Intel® Optane™ Memory Engineering Samples. Results may vary in final product, but we have a high confidence level that there will be no
  significant differences in performance.
  Note: All, Intel® Optane™ memory testing was conducted on 7th Gen Intel® Core processors. All Queue Depth testing was conducted on 6th Gen Intel® Core™ processors.

                                                                                        Workloads
  SYSmark* 2014 SE - benchmark from the BAPCo* consortium that measures the performance of Windows* platforms. SYSmark* tests four usage scenarios: Office Productivity, Media
  Creation, Data/Financial Analysis, and Responsiveness. SYSmark* contains real applications from Independent Software Vendors such as Microsoft* and Adobe*.

  PCMark* Vantage (HDD Suite) - Benchmark from Futuremark* that measures Windows* everyday computing performance. PCMark Vantage is made up of several benchmarking suites:
  PCMark Suite (produces “PCMark” Score), Memories Suite, TV and Movies Suite, Gaming Suite, Music Suite, Communications Suite, Productivity Suite and HDD Suite. The HDD Suite
  contains an operating system start-up workload that is sensitive to HDD versus SSD boot devices.

  Browser Launch Workload – Workload developed by Intel® measuring the time elapsed to launch Google* Chrome

  OS Load Time Workload – Workload developed by Intel® measuring the time elapsed from initiating power-on (from powered-off state) until the operating system has completed loading

  Game Launch & Level Load Workload – Workload developed by Intel® measuring the time elapsed to launch Bethesda Softworks* Fallout 4 and reach the Main Menu with intro videos
  disabled (Launch), and the time elapsed from the Main Menu to completion of level loading (Level Load)

  Email Launch Workload – Workload developed by Intel® measuring the time elapsed to launch Microsoft* Outlook 2016 and load with a 250mb local data file

  File Search Workload – Workload developed by Intel® measuring the time elapsed using Microsoft* Windows File Search to locate a specified file in a non-indexed directory

  Presentation Launch Workload – Time elapsed to launch the Microsoft* Powerpoint 2016 application with a 3.5MB presentation file

  Media Project Load Workload – Time elapsed to load a 500MB video project file in Adobe* Premiere Pro (CS6)

CCG Marketing   *Other names and brands may be claimed as the property of others                                                                                                       24
Appendix II

CCG Marketing
Configuration
  Note: All, Intel® Optane™ memory testing was conducted on 7th Gen Intel® Core processors.
  All Queue Depth testing was conducted on 6th Gen Intel® Core™ processors.

                                                                                                   •   All Intel® Optane™ memory based
                                                                                                       System Acceleration data is
                                                                                                       based on Pre-Production
                                                                                                       samples; subject to change.

                                                                                                   •   All numbers preliminary, subject
                                                                                                       to change

                                                                                                   •   *Other names and brands may be
                                                                                                       claimed as the property of others

CCG Marketing   *Other names and brands may be claimed as the property of others                                                          26
Workload descriptions Queue Depth Trace Analysis
    Read Queue Depth and 4K Random Read Iops compiles the average access sizes found below into a single visual graph. The
    values selected (x-axis) represent roughly 80% of all accesses with the majority of the remaining 20% falling below 32KB.

  Consumer Demo
                                                                                                    Developer Demo
  Intel demonstration script meant for showcasing the speed difference between storage
                                                                                                    Intel demonstration script meant for showcasing the speed difference in Visual Stud
  mediums. Uses WinAutomation that simulates a consumer workload by running a virus scan to
                                                                                                    Community between different storage mediums. Uses WinAutomation to open a three
  stress the HDD then opens an instance of iTunes with a 25GB library before searching for and
                                                                                                    instances of Visual Studio 2015 Community and compile four different types of projects. The
  playing a song. Next, it opens Outlook (containing a single user with 25MB data file) on top of
                                                                                                    initial Visual Studio app launch is the primary point of focus as it must load a wide range of
  both the virus scan and iTunes for a multiple application scenario and searches for an email
                                                                                                    assets and libraries to be ready for the developer. Once loaded, the opening and compiling
  within Outlook. Finally, it saves an attached image from Outlook and uses finder open and
                                                                                                    projects test how well it loaded the initial assets and what it still needs to link. Furthermore
  view various pictures. These simple tasks with the background virus scan stress the drives
                                                                                                    by opening more than one instance of the Visual Studio suite, it tests how well a drive
  responsiveness while under multiple applications similar to an average user.
                                                                                                    performs while a user works on different projects in different programming languages (C++
                                                                                                    C# and Visual Basic represented here).
  Office Demo
  Intel demonstration script meant for showcasing the speed difference between storage
                                                                                                    Application Launches
  mediums. Uses WinAutomation to open five PowerPoints (ranging from 1-20MB), open saved
                                                                                                    These tests consisted of taking trace data as an application launched. This was don
  pdf documents in Adobe Acrobat (ranging from 5-40MB), scan through the rows of an Excel
                                                                                                    by starting the trace then double clicking a desktop link to start each program. The trace w
  spreadsheet, view a 1MB saved HTML Document in Internet Explorer, open five Word
                                                                                                    then ended once any sign of loading (pinwheels or missing menu items) left the screen.
  documents all while playing five movies (both MP4 and WMV) in Media Player Classis: Hom
  Cinema. Similar to the Consumer Demo, the multiple running applications simulate how a
  normal user does many things at once thus stressing the drive with more requests. These
  specific applications focus more on a corporate user’s workload as opposed to a
  personal/consumer one.

  SolidWorks Demo
  Intel demonstration script meant for showcasing SolidWorks speed difference betw
  storage mediums. Uses WinAutomation to open an instance of SolidWorks followed by start
  a SolidWorks script. This script opens various SLDPRT and model files pertaining to 6 differ
  cars, a wheeled backhoe, a tesla tower and a small CNC machine. All the assemblies were
  downloaded from https://grabcad.com/library/software/solidworks. By opening many inter
  windows each with different a solid model or assembly the SolidWorks script tests how
  responsive the storage media is with requests of different sizes and in different locations
  (since assemblies are made up of many small SLDPRT’s). This simulates the workload of a
  mechanical designer as they load and work on various solid models and their respective pa
  The average assembly size is between 20-30MB while the individual SLDPRT’s were between
  and 6MB.

CCG Marketing    *Other names and brands may be claimed as the property of others                                                                                                                      27
CCG Marketing
You can also read