Updates to the EIA Eagle Ford Play Maps - December 2014
←
→
Page content transcription
If your browser does not render page correctly, please read the page content below
Updates to the EIA Eagle Ford
Play Maps

December 2014

Independent Statistics & Analysis   U.S. Department of Energy
www.eia.gov                            Washington, DC 20585
This report was prepared by the U.S. Energy Information Administration (EIA), the statistical and
analytical agency within the U.S. Department of Energy. By law, EIA’s data, analyses, and forecasts are
independent of approval by any other officer or employee of the United States Government. The views
in this report therefore should not be construed as representing those of the U.S. Department of Energy
or other federal agencies.

U.S. Energy Information Administration | Updates to the Eagle Ford Shale Play Maps                        i
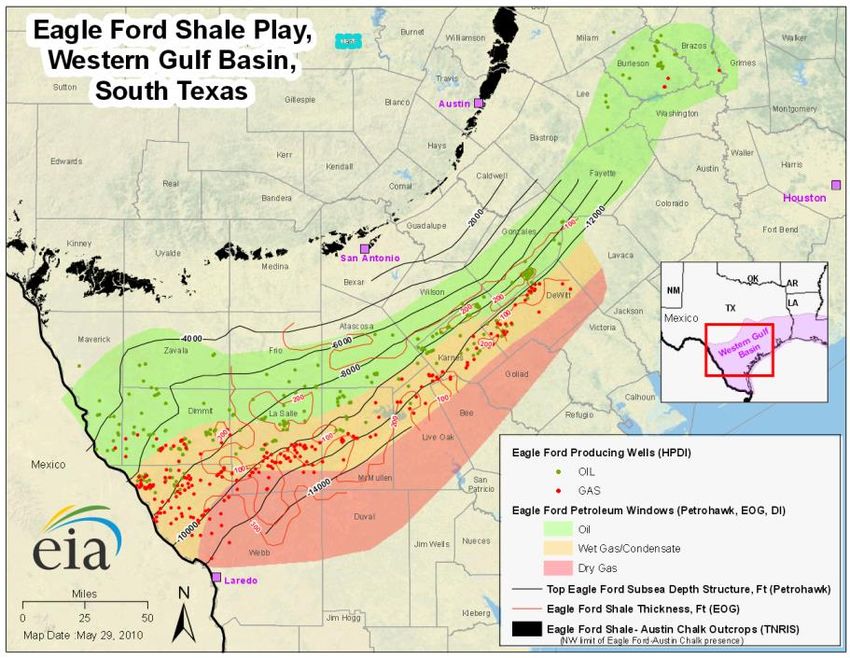
December 2014

Introduction
EIA is adding and updating geologic information and maps of the major tight oil and shale gas plays. This
document outlines updated information and maps for the Eagle Ford play in southwest Texas. The
geologic elements characterized and updated since the 2010 Eagle Ford Shale Play map include
contoured elevation of the top of formation (structure), contoured thickness (isopach), major structures
and tectonic features (regional faults and folds etc.), play boundaries, well locations and gas-to oil ratios
of wells producing from January 2000- June 2014.

These geologic elements are documented and illustrated as a series of maps. The Eagle Ford play map
consists of layers of geologic and production information that can be published either as separate
thematic maps (such as Figure 1) or as a single map with interactive layers. Data sources include
DrillingInfo Inc. (DI, a commercial oil and gas well database), the U.S. Geological Survey, the Bureau of
Economic Geology, the Texas Natural Resources Information System (a division of the Texas Water
Development Board), peer-reviewed research papers, and academic theses.

Note: EIA’s access to well level-data is limited, and EIA is working on expanding its well-level data to
include well-log information. Additional map layers will be added as additional geologic data (such as
porosity) becomes available.

Figure 1. Eagle Ford Play, Western Gulf Province, Texas

Sources: U.S. Energy Information Administration, DrillingInfo, Inc., Texas Natural Resources Information, U.S.
Geological Survey, Texas Bureau of Economic Geology.

U.S. Energy Information Administration | Updates to the Eagle Ford Shale Play Maps                                 1
December 2014

The Eagle Ford Play boundaries
The Eagle Ford Play (Figure 1) has four major boundaries: 1) The international border to the west , 2) a
northern boundary above a minimum subsea depth of 3650 feet to intersect the top of the upper Eagle
Ford formation in Frio County and counties east, and above minimum depths in Maverick and Zavala
counties, ranging from 650 to 2900 feet, 3) a southern boundary that traces the Early Cretaceous Sligo
Reef Margin, and 4) a northeastern boundary where the lower Eagle Ford (the primary target for drilling
and completion) thins and grades into more silica-rich units of the Pepper Shale of the East Texas Basin
(Hentz et al., 2014).

EIA’s analysis of the Eagle Ford Play is truncated at the international border, because EIA does not have
well-level production and geologic data from the Eagle Ford formation on the Mexican side of the
border.

The northern boundary of the Eagle Ford Play is defined according to where the oil window ends and
the immature area begins, according to a study that used thermal modeling calibrated to published
vitrinite reflectance (%Ro) data (Cardneaux, 2012). The limits of the oil window correlate to a subsea
structure depth of about 650 feet in Maverick county, about 2900 feet in Zavala county, and about 3650
feet in Frio county. The change in depth in relation to maturity reflects the amount of differential
subsidence within the Maverick basin and subsequent uplift and erosion along the Chittim Anticline.
The limit of the oil window east of Frio county is assumed to correlate with a subsea depth of
approximately 3650 feet.

The northeastern Eagle Ford play boundary is defined by the transition from the carbonate-rich lower
Eagle Ford group to the silica-rich Pepper Shale formation. The lower Eagle Ford formation is thickest in
the Maverick Basin and thins to a minimum over the San Marcos Arch. Northeast of the San Marcos
Arch the lower Eagle Ford grades into the Pepper Shale. Northeast of the Eagle Ford play, operators are
targeting low-permeability sandstone beds within the Pepper Shale and Woodbine Group in a region
referred to as the “Eaglebine” play (Hentz et al., 2014).

Contoured elevation of the top surface of Eagle Ford formation
Contoured elevation maps of the top surface of a geologic formation (also called structure maps)
constructed from point elevation data (from wells and/or outcrops) provide the third dimension for
characterizing depth or elevation of a reservoir on an otherwise two-dimensional map. The elevation
map for the top of the Eagle Ford formation (Figure 2) was constructed from both subsurface well data
(DrillingInfo Inc.) and above ground outcrop elevation data (from the Texas Natural Resources
Information System and the U.S. Geological Survey). The Eagle Ford formation is divided into upper and
lower units, and the top of the lower unit is considered the best proxy for the source rock; however, due
to a lack of density and distribution of the depth to the top of the lower Eagle Ford formation, this map
represents an approximation of the elevation of the top of the upper Eagle Ford unit. For a more
detailed study that separates the depth of the the upper and lower Eagle Ford formation see Hentz and
Ruppel (2011).

U.S. Energy Information Administration | Updates to the Eagle Ford Shale Play Maps                          2
December 2014

Figure 2. Elevation contours of the top of the Eagle Ford formation

Sources: U.S. Energy Information Administration, Drilling Info, Inc., Texas Natural Resources Information, and U.S. Geological
Survey.

U.S. Energy Information Administration | Updates to the Eagle Ford Shale Play Maps                                               3
December 2014

Contoured thickness of the Eagle Ford formation (isopachs)
Formation/ reservoir thickness maps (isopachs) provide rough estimates of the thickness of reservoirs.
Thickness can be used to calculate resource volumes, such as oil or gas in place estimates, in
combination with reservoir information such as porosity and reservoir pressure. The thickness contour
maps for the Eagle Ford formation (Figure 3) were constructed from subsurface point thickness data
from individual well records (from DrillingInfo Inc.) that include both depth to the top and the base of
the Eagle Ford formation. For a more detailed study that separates the upper and lower Eagle Ford
units see Hentz and Ruppel (2011).

Figure 3. Thickness contours of the Eagle Ford formation

Sources: U.S. Energy Information Administration, Drilling Info, Inc., Texas Natural Resources Information.

U.S. Energy Information Administration | Updates to the Eagle Ford Shale Play Maps                                           4
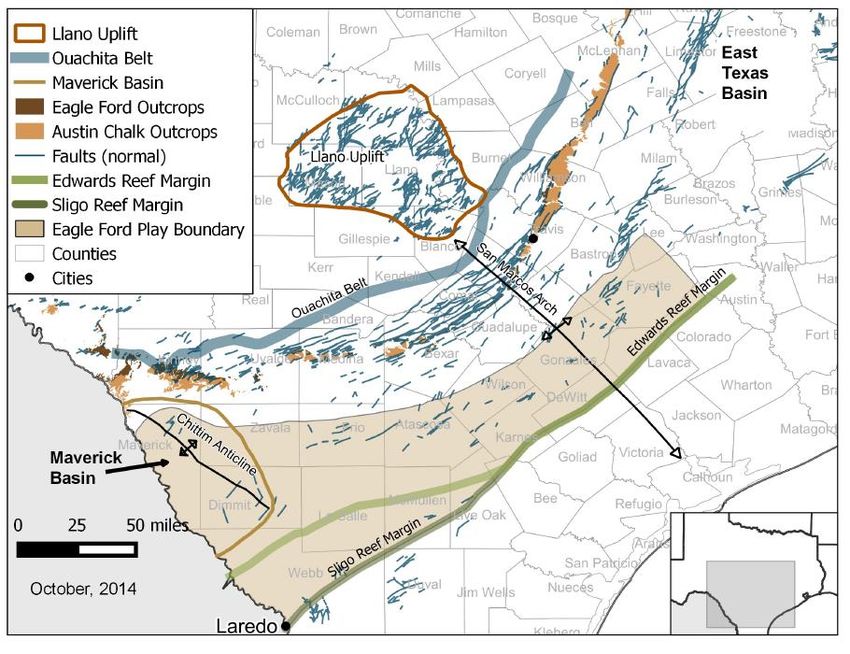
December 2014

Major geologic, structural and tectonic features relevant to the Eagle Ford play
Summary of Eagle Ford geology
The Eagle Ford shale is a hydrocarbon-bearing, Late Cretaceous formation that was deposited in a
marine continental shelf environment. The Eagle Ford formation consists of organic-rich calcareous-
mudrock with mineralogy ranging from 40-90% carbonate minerals, 15-30% clay, and 15-20% silica
(quartz). The total-organic-carbon content (TOC) ranges from 2-12%, thermal maturity (%Ro) 0.45-1.4%,
API gravity 28-62o, porosity 8-12%, and pressure gradient 0.5-0.8+ (psi/ft) (Za Za Energy, 2013). The
formation is divided into two units: an upper unit, characterized by interlayered light and dark gray
calcareous mudrock deposited during a regressive interval (sea level falling), and a lower unit of mostly
dark gray mudstone deposited during a transgressive interval (from rises in sea levels). The Eagle Ford
sits above the Buda Limestone and unconformably below the Austin Chalk (Parra et al., 2013).

Structural and tectonic features
The structural and tectonic features that influenced the depositional extent, depth, and thickness of the
productive and prospective regions of the Eagle Ford formation are included on the map in Figure 4.
The extent of the Eagle Ford formation and variations in its thickness and stratigraphy are in large part
constrained by regional tectonic features, including the Maverick Basin, the San Marcos Arch, the Stuart
City and Sligo shelf Margin, and the East Texas Basin (Hentz and Ruppel, 2011; Hentz et al., 2014).

The Eagle Ford formation is thickest in the Maverick Basin and thins to a minimum in the San Marcos
Arch region. The Eagle Ford formation continues into the southwest part of the East Texas Basin as a
combination of the Maness and Eagle Ford Group facies and grades into coarser sandstone units of
Woodbine to the east (Hentz and Ruppel, 2011).

The organic rich carbonate mudrock of the lower Eagle Ford, the primary target of the Eagle Ford play,
grades into the more silica-rich Pepper Shale northeast of the San Marcos Arch. The Pepper Shale was
deposited in the East Texas Basin and consists of distal deltaic facies that formed on the western edge of
the sandstone-rich fluvial-deltaic Woodbine Group (Hentz et al., 2014). Within the Pepper Shale,
discontinuous low-permeability sandstone layers are the primary target for drilling and completion
(Hentz et al. 2014). Depths of the southeast dipping Eagle Ford range from outcrops to 17, 000 feet at
the Stuart City shelf margin. The depth gradients show greatest variation on the flanks and crest of the
San Marcos Arch (Figure 1).

Structures that pre-date deposition of the Eagle Ford formation include the Permian-Pennsylvanian
Ouachita Belt--a zone of uplift that formed when the continents (Africa, North and South America)
collided to form Pangea (Condon and Dyman, 2006). The San Marcos Arch, also formed during Permian-
Pennsylvanian compression, forms a broad regional arch over which sediments of the Eagle Ford
formation were deposited and are thinnest. The Edwards and Sligo Reef Margins are Early Cretaceous
continental shelf edge reefs (Condon and Dyman, 2006) that pre-date the Eagle Ford deposition, but
that mark the edge of the Late Cretaceous continental shelf marine environment that characterizes the

U.S. Energy Information Administration | Updates to the Eagle Ford Shale Play Maps                           5
December 2014

most prospective region of the Eagle Ford shale. The Sligo Reef Margin is considered the southern limit
of the Eagle Ford play. Structures that post-date deposition of the Eagle Ford formation include the
Chittim anticline (part of a series of folds and faults interpreted to have formed during the late
Cretaceous to Tertiary), and related Laramide compression (a regional convergent tectonic event)
(Condon and Dyman, 2006).

Figure 4. Major structural and tectonic features in the region of the Eagle Ford play

Sources: U.S. Geological Survey (Condon and Dyman, 2006), Bureau of Economic Geology (Hentz and Ruppel, 2011)

U.S. Energy Information Administration | Updates to the Eagle Ford Shale Play Maps                                     6
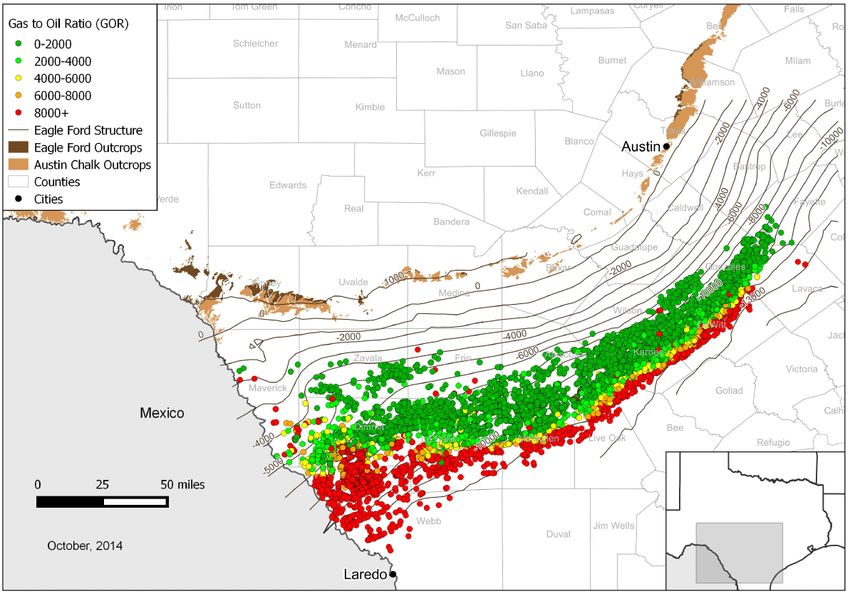
December 2014

Location and initial gas-to-oil ratios of wells producing from the Eagle Ford
reservoir (January 2000- June 2014)
Figure 5 shows the distribution of production across the play in terms of initial Gas-to-Oil Ratios (GORs).
Most wells now being drilled for hydrocarbons produce a mixture of oil and natural gas. Relatively high
oil prices and low natural gas prices make the oil-rich portions of reservoirs more desirable for
production, and therefore increasingly the targets for well drilling. The 2010 Eagle Ford map (Figure 6)
defined the oil, wet gas, and dry gas “windows” of the play.

The mixture of oil and natural gas is shown for a particular formation by mapping initial GORs (the ratio
of natural gas that a well produces to oil for the second through fourth contiguous producing months,
expressed as cubic feet per barrel—cf/bbl). In Figure 5, high initial GOR/gas-rich wells of the Eagle Ford
Play are shown in orange and red along the southern edge of the play, and lower initial GORs/oil-rich
wells are shown in green along the northern portion. Gas-to-Oil Ratios are illustrated using colored
point data in the map in Figure 6. The distribution of initial GORs from Eagle Ford play wells generally
corresponds to the depth of the reservoir. Deeper wells (up to 15,000 feet) to the southeast have
higher initial GORs, or a relatively greater share of natural gas, while the shallower wells to the
northwest (below 6,000 feet) have lower initial GORs, or a relatively greater share of oil. In the eastern
half of the play, the wells that intersect the reservoir between 5,000 and 12,000 feet depth have initial
GORs of 6000cf/bbl or less (producing more oil relative to gas). The western half of the play includes a
wider depth distribution of wells, intersecting the formation from as deep as 14,000 feet to as shallow
as 2,000 feet, and has initial GORs of 0 to 6000cf/bbl or higher (producing more gas relative to oil).

U.S. Energy Information Administration | Updates to the Eagle Ford Shale Play Maps                            7
December 2014

Figure 5. Initial gas-to-oil ratios of Eagle Ford wells (January 2000 – June 2014)

Source: U.S. Energy Information Administration and Drillinginfo Inc., September 2014.
Note: EIA calculates the initial gas-to-oil ratio for each well using the second through fourth contiguous months of liquid and/or
gas production. The first month of production may not represent full production and is, thus, not included in the initial GOR
calculation.

U.S. Energy Information Administration | Updates to the Eagle Ford Shale Play Maps                                                   8
December 2014

Figure 6. EIA 2010 Eagle Ford Play Map

Source U.S. Energy Information Administration, DrillingInfo, Inc.

Animated time series of monthly production by location, GOR, and BOE (2009-
2013)
In November of 2011, EIA published an animation of Eagle Ford monthly production from 2006-2010 in a
Today in Energy article on the EIA website. In February of 2014, an updated version of the Eagle Ford
animation was published in Today in Energy using monthly production data from 2009-2013. The
majority of Eagle Ford play wells began production in 2009 or later, as shown in the animation, which
displays both the monthly GORs and production of total hydrocarbons in barrels of oil equivalent (BOE).
This animation was created using SAS JMP with data from DrillingInfo Inc.

Acknowledgments
This document benefited from thoughtful reviews and suggestions by members of the Bureau of
Economic Geology.

U.S. Energy Information Administration | Updates to the Eagle Ford Shale Play Maps                        9
December 2014

References
Cardneaux, A.P., 2012, Mapping of the Oil Window in the Eagle Ford Shale Play of Southwest Texas
Using Thermal Modeling and Log Overlay Analysis, M.S. Thesis, Louisiana State University, 74 p.

Condon, S.M. and Dyman, T.S., 2006, 2003 Geologic Assessment of Undiscovered Conventional Oil and
Gas Resources in the Upper Cretaceous Navarro and Taylor Groups, Western Gulf Province, Texas, U.S.
in Chapter 2 of Petroleum Systems and Geologic Assessment of Undiscovered Oil and Gas, Navarro and
Taylor Groups, Western Gulf Province, Texas: Geological Survey Digital Data Series DDS-69-H.

Hentz, T.F., and Ruppel, 2011, Regional Stratigraphic and Rock Characteristics of Eagle Ford Shale in Its
Play Area: Maverick Basin to East Texas Basin, Search and Discovery Article #10325,
(http://www.searchanddiscovery.com/pdfz/documents/2011/10325hentz/ndx_hentz.pdf.html) based
on oral presentation at AAPG Annual Convention and Exhibition, Houston, Texas, USA, April 10-13, 2011.

Hentz, T.F., and Ambrose, W.A., and D.C. Smith, in press, Eaglebine play of the southwestern East Texas
Basin: Stratigraphic and depositional framework of the Upper Cretaceous (Cenomanian-Turonian)
Woodbine and Eagle Ford Groups, (in press; preliminary version published online Ahead of Print 08
August 2014): AAPG Bulletin, doi: 10.1306/07071413232

Parra, P.A., Rubio, N., Ramirez, C., Guerra, V.A., Campos, I.R., Trejo, M.D., Olguin, J. Vargas, C.H.,
Valbuena, R., Soler, D.F., Weimann, M.I., Lujan, V., Bonningue, P., Reyes, P.G., Martinez, R., Munoz, R.,
Rodriquez, E., and Garcia, M., 2013, Unconventional Reservoir Development in Mexico: Lessons Learned
From the Frist Exploratory Wells, Society of Petroleum Engineers, Unconventional Resources
Conference- USA held in The Woodlands, Texas, USA, 10-12 April 2013, SPE 164545

Texas Natural Resources Information System, 2007, Geologic database of Texas, http://www.tnris.org/.

U.S. Geological Survey 1 X1 degree contour elevation maps for Austin, Del Rio, San Antonio East, and San
Antonio West, http://nationalmap.gov

Za Za Energy Company Corporation, Presentation, 2013, Investor Presentation December 2014, p. 14.,
http://www.zazaenergy.com/

U.S. Energy Information Administration | Updates to the Eagle Ford Shale Play Maps                          10
You can also read