Covid-19 Transmission Dynamics During the Unlock Phase and Significance of Testing
←
→
Page content transcription
If your browser does not render page correctly, please read the page content below
Covid-19 Transmission Dynamics During the Unlock Phase and
Significance of Testing

Abhijit Paul 1, Samrat Chatterjee 1, Nandadulal Bairagi 2*

1
    Complex Analysis Group, Translational Health Science and Technology Institute NCR Biotech Science Cluster,
Faridabad-121001, India; 2 Department of Mathematics, Centre for Mathematical Biology and Ecology, Jadavpur
University, Kolkata 700032, India

SUPPLEMENTARY INFORMATION

The lockdown starting date for India is 25th March [1-3] and this date was used as the first critical time-
point for simulation. But the USA did not impose any nationwide lockdown and lockdown dates varied
from state to state, and even the date was different between two cities. For example, the lockdown starting
dates for California, Texas, Florida and New York were March 19, 19, 30 and 22, respectively [4-10].
These four states are now on the top of the table for COVID-19 confirmed cases in the USA [11-13] and
contains almost 50% of the total cases. Here, we chose 19th March as the lockdown starting date for the
USA and this date was used as the first critical time-point. The unlock stage (ULS) began from the unlock
start date, which is refer as the third critical point. The unlock started in India from 1st June [14,15],
which is the third critical point for India. The reopening started in California, Texas, Florida and New
York are May 8, 1, 1 and June 8 respectively [16-24]. In our study, May 8 is considered as third critical point
for the USA.

SUPPLEMENTARY METHODS

S1 Estimation of parameter for model analysis

Simulation of the model for each country was done separately. The simulation started with the time-
point when the first confirmed case was reported [12,13] and continued till October 9, 2020. As a first
step, the entire study period was divided into three segments by the lockdown starting and removal dates
of each country, and termed them as before lockdown stage (BLS), lockdown stage (LS) and unlock stage
(ULS). We tried to fit the actual data of BLS, LS and ULS periods separately with the simulated data. With
an initial parameter set we obtained a good fit for BLS (R-squared value > 0.9) between the simulated and
actual data [12,13]. However, the model does not show a good fit with the LS data [25,26].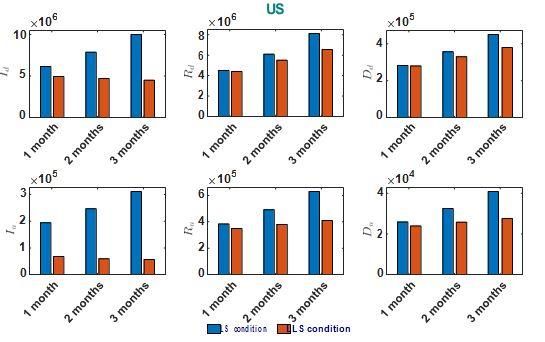
This is because lockdown has its effect on some parameters. For example, the value of ν, measuring the
strength of lockdown, will certainly increase as the lockdown period becomes longer. Thus it was difficult
to get a good fit with a single parameter set for LS data. We, therefore, divided the LS data into small
windows and tried to fit the model. We looked for minimum number of windows and allowed changes in
minimum number of parameters. We observed that minimum two windows are required to fit the model
with the LS data. So, we divided the lockdown stage (LS) into two parts, viz. early lockdown stage (ELS)
and later lockdown stage (LLS) by second critical time point to obtain a better fit of the actual data. There is
no particular date for the second critical time point, so, we first randomly chose a time point
(Supplementary Table S1) as its initial guess and also manually searched initial parameters corresponding
to ELS and LLS that give a good fit (R-squared value >0.9) between the simulated and actual data [12,
13]. The only restriction posed during the parameter selection for variation is that the number of
parameter should be the minimum most and for that global sensitivity analysis was applied. GSA was
performed by using Partial Ranked Correlation Coefficient (PRCC) technique (see Supplementary
methods S2) and got six sensitive parameters (α, ξ, β0, ν, δd and µd) of the system (1) (Supplementary
Figure S1). However, we excluded ξ as it dependants on latent period of the infection and difficult to
control. So, the five parameters were used as minimal set of varying parameters. It is worth mentioning that
the strength of lockdown in LLS is higher than its immediate early stage. Thus, we varied the parameter
values of ν in the range 0.5
parameter set, the model (1) was simulated for both the countries and the results were compared with
the available data (see Figure 2).
S2 Sensitivity analysis
The Global Sensitivity Analysis (GSA) of a system helps to identify the parameters that have significant
effect on the system dynamics and can be used as controlling parameters. Here, we used Partial Ranked
Correlation Coefficient (PRCC) technique for the GSA. Latin Hypercube Sampling (LHS) was used to
randomly generate vectors of parameter set which were further used for each run of PRCCs calculation
[25]. Over 10,000 parameter sets were generated through LHS between the 5 fold up-down range of each
parameter, except for γ, ξ, ω and ν, whose upper bounds were set to 1 following the model
assumptions. For each parameter set, the system was run for desired time and the maximum level of all
the state variables were noted. Then PRCCs were calculated for the parameters with the maximum level
of the desired state variables.
S3 Estimation of optimal parameter set
To get the optimal parameter set, ”lsqcurvefit” function from the Optimization Toolbox of MATLAB
was used. Basically, ”lsqcurvefit” attempts to computes those parameter sets which will give the
minimum value of the expression
2
Yi Y i ,
^
i
where Yi is the actual value at the ith data point and Ŷi is the predicted value for any parameter set.
Here we have to define a set of lower and upper bounds on the parameter set so that the solutions lie in
that range. Also, in the input arguments of this function, the
Algorithm that we want to use for the optimization can be defined. In our case, Y is a matrix of temporal
data of total confirmed cases, total recovered cases and total death cases, and Ŷ returns the time-series
simulation for Id, Rd and Dd, with inputs initial parameter guess and total time span as total number of data
point. Here, ”trust-region-reflective” [26] algorithm
was considered for the optimization and the bounds of the parameters were defined by the two fold up-
down values of the initial values of each parameter. As the values of α, γ, ξ and ω can’t exceed 1 (see
the model assumptions), so the upper bounds were set to 1 for these parameters. Besides these, the
upper bound for ν was set 0.5 for the BLS, and the lower bound of ELS was set 0.5.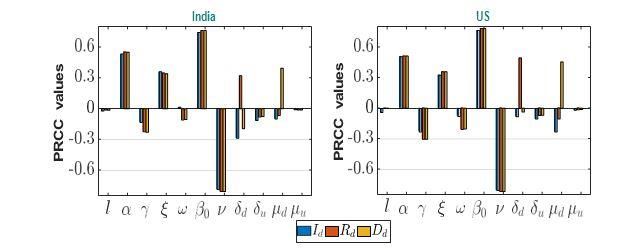
S4 Calculation of mean normalized Euclidean distances (MNED)
The normalized Euclidean distance between two vectors x and y are evaluated by
1 std ( x y )2
,
2 std ( x)2 std (y)2
where std(x) denotes the standard deviation of the vector x. Here, we have calculated the normalized
Euclidean distances between simulation time-series results of (Id+Rd+Dd), Rd and Dd with the
corresponding available data of total confirmed cases, total recovered cases and total death cases and then
obtained their mean values to get the mean normalized Euclidean distance (MNED).
SUPPLEMENTARY FIGURES AND TABLES
Table S1: Initial parameter and second critical time-point guess for India and US which gives a good fit
between simulated and actual data (R-squared value > 0.9). We were assumed that the second critical
time points will lie between the ranges of 2-4 week after lockdown starting date.
Parameter India USA
l 6 6
γ 0.4 0.25
ξ 0.3 0.33
ω 0.4 0.25
δu 0.033 0.02
µu 0.001 0.002
Before lockdown stage (BLS)
α 0.1 0.068
β0 0.9 0.9
ν 0 0
δd 0.01 0.0018
µd 0.0026 0.004
Early lockdown stage (ELS)
α 0.25 0.14
β0 0.9 0.8
ν 0.3 0.2
δd 0.02 0.01
µd 0.006 0.0085Later lockdown stage (LLS)
α 0.23 0.04
β0 0.64 0.29
ν 0.5 0.6
δd 0.046 0.0075
µd 0.0026 0.0025
Unlock stage (ULS)
β01 0.62 0.4
ν1 0.53 0.5
β02 0.659 0.62
ν2 0.41 0.31
α 0.228 0.04
γ 0.34 0.4
ω 0.33 0.4
δd 0.048 0.01
δu 0.04 0.033
µd 0.0023 0.00035
µu 0.0012 0.002
Second critical time-point
(Number of days after lockdown starting data)
Initial guess 21 21
Figure S1: Global sensitivity analysis (GSA) was performed for the two countries to get the minimal
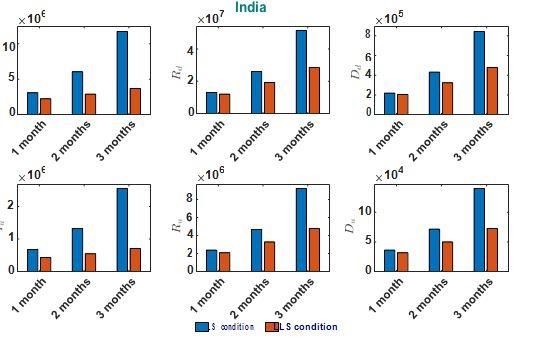
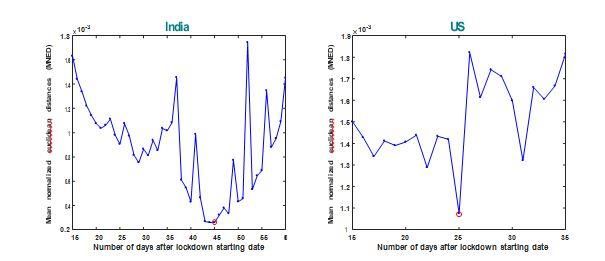
varying parameter set. PRCC values of each parameter are represented by the length of the bar for each ofthe state variables. There are six common parameters (α, ξ, β0, ν, δd and µd) that are sensitive to both countries. Figure S2: Variation in the mean normalized Euclidean distances (MNED) between simula- tion result and actual data with respect to the changes in second critical time-point around the initial guess. Initial guess of second critical time-points for both India and US were 21 days after the lockdown starting date. Here, the red circled points represent the day where minimum value of MNED were obtained and these dates were further selected as the revised second critical time-point. Figure S3: Predicted cases for detected and undetected infectious compartments in India after one, two and three months under two different parametric situations. The blue bars represent the cases if parameters take the ULS values, and the red bar represents the same if parameters take the LLS values (see Table 1).
Figure S4: Predicted cases for detected and undetected infectious compartments in US after one, two
     and three months under two different parametric situations. The blue bars represent the cases if
     parameters take the ULS values, and the red bar represents the same if parameters take the LLS values
     (see Table 1).

REFERENCES

1.      Mallik S, Soni S, Podder K, Mishra U, Ahamed M. Prediction and assessment of change in PM2. 5 during COVID-19 lockdown using remote sensing and deep

        learning approach: A case study of Kanpur city. 2020.

2.      PM Narendra Modi announces a national lockdown for 21 days starting midnight of 24-25 March. 2020.

3.      Bherwani H, Gupta A, Anjum S, Anshul A, Kumar R. Exploring dependence of COVID-19 on environmental factors and spread prediction in India. 2020.

4.      Coronavirus California: Everything to know about stay at home or-der (Press release). 2020.

5.      California Orders Lockdown for State's 40 Million Residents (Press release), 2020.

6.      Texas governor: Schools, bars, restaurant dining rooms must close temporarily due to coronavirus (Press release), 2020.

7.      Coronavirus In Texas: Gov. Abbott Imposes Statewide Restrictions for 2 Weeks, No Gatherings of 10 or More (Press release), 2020.

8.      The Hill. Governor issues stay-at-home order for South Florida (Press release), 2020.

9.      Florida Governor Orders Statewide Lockdown (Press release), 2020.

10.     Governor Cuomo Signs the 'New York State on PAUSE' Executive Order (Press release), 2020.

11.     Chen H, Selix N, Nosek M. Perinatal anxiety and depression during Covid-19. J Nurse Pract. 2020.

12.     Hartman HE, Sun Y, Devasia TP, Chase EC, Jairath NK, Dess RT, et al. Integrated Survival Estimates for Cancer Treatment Delay Among Adults With Cancer

        During the COVID-19 Pandemic. JAMA oncology. 2020.

13.     Jhaveri R. Echoes of 2009 H1N1 Influenza Pandemic in the COVID Pandemic. Clinical Therapeutics. 2020;42(5):736-740.

14.     India Today. Lockdown 5.0 is Unlock 1.0: New MHA rules allow nearly all to reopen Full guidelines (Press release), 2020.

15.     What will open and when; know about the three phases of lockdown up liftment (Press release), 2020.

16.     Seyfarth. California Announces Limited Reopening for Retail Beginning. 2020.

17.     Governor Newsom Provides Update on California's Progress Toward Stage 2 Reopening. 2020.

18.     The Guardian. California eases Covid-19 restrictions, allowing some businesses. 2020.

19.     How'd we get here? Gov. Abbott pauses Texas reopening plan as cases continue to soar. 2020.
20. Governor Abbott Announces Phase One To Open Texas, Establishes Statewide Minimum Standard Health Protocols. 2020.
21. Elassar A. This is where each state is during its phased reopening. CNN. 2020.
22. Mulligan K, Lakdawalla D, Goldman D, Hlávka J, Peneva D, Ryan M, Staff SC. Data & Tools. 2020.
23. Levenson E. New York City exits coronavirus lockdown but enters a new crisis CNN. 2020.
24. Weaver S. New York City nally has a reopening date, Governor Cuomo says. TimeOut. 2020.
25. Blower SM, Dowlatabadi H. Sensitivity and uncertainty analysis of complex models of disease transmission: an HIV model, as an example. Int Stat Rev. 1994:229-
243.
26. Coleman TF, Li Y. An interior trust region approach for nonlinear minimization subject to bounds. SIAM J optimiz.1996;6(2):418-445.You can also read