IMPACT OF CLIMATE CHANGE ON WATER RESOURCES OF TAPI BASIN
←
→
Page content transcription
If your browser does not render page correctly, please read the page content below
Project Progress Review Meeting

              INCCC- National Water Mission, MoWR,RD&GR

  “IMPACT OF CLIMATE CHANGE ON WATER RESOURCES OF
                            TAPI BASIN”

                         Dr. P V Timbadiya
                      Associate Professor and Co-PI

CENTRE OF EXCELLENCE (COE) ON ‘WATER RESOURCES & FLOOD MANAGEMENT’
                  DEPARTMENT OF CIVIL ENGINEERING
SARDAR VALLABHBHAI NATIONAL INSTITUTE OF TECHNOLOGY, SURAT – 395007,
                               GUJARAT.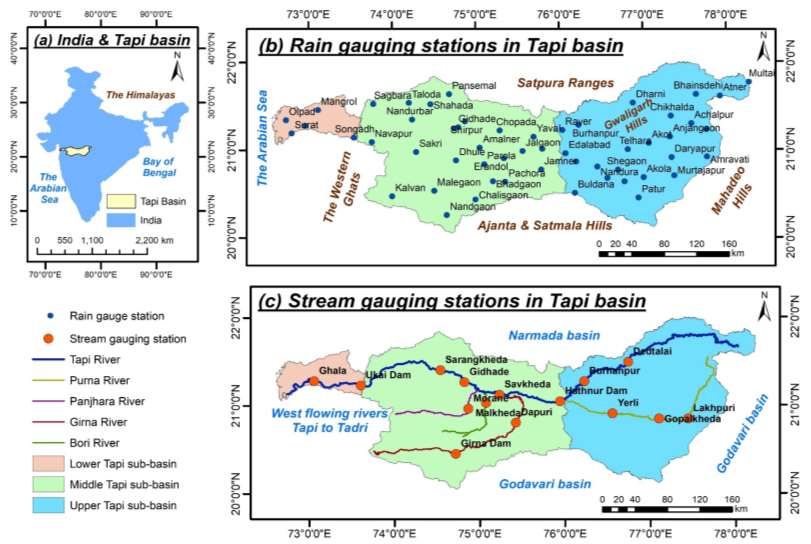
Contents of presentation
Project Partnering Institutes & Project Team
Objectives of Project
Study Area & Broad Methodology
Scope of Work (Institute Wise)
Review of first R & D Session
Progress of Project Work
Expenditures Incurred
Work Plan for First half of year 2019-20
2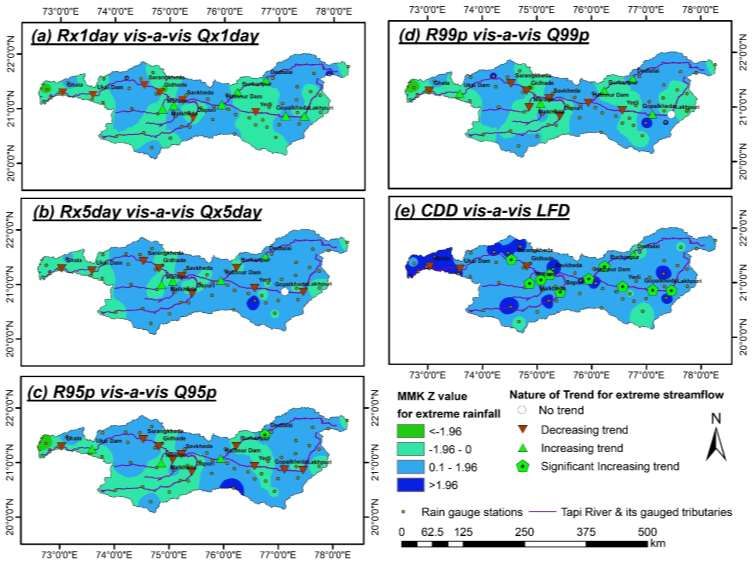
PROJECT PARTNERING INSTITUTES &
PROJECT TEAM
SVNIT, Surat Dr. P L Patel (PI)
• Dr. P V Timbadiya (Co PI)
(Leading • Mr. Shubham Jibhakate (SRF)
Institute) • Mr. Lalit Kumar Gehlot (JRF)
MNIT, Jaipur
•Dr. Rohit Goyal (Co PI)
(Co-coordinating • Mr. Priyamitra Munoth (SRF)
Institute)
MANIT, Bhopal
(Co-coordinating • Dr. Vishnu Prasad (Co PI)
Institute)
3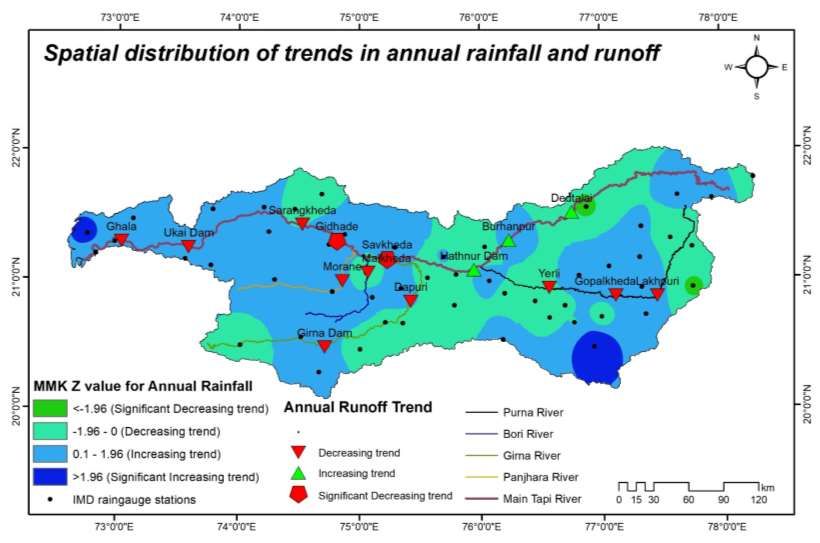
Objectives of the project

   Collection of base line data of Tapi basin including stream
   gauging, rainfall, topography, soil, land use/land cover, ground
   water levels, reservoir and its utilities, cropping pattern of
   Ukai command area, past floods and tidal levels.

   Selection of Hydrological (SWAT/MIKE SHE) and hydraulic
   models (MIKE FLOOD) and their calibration and validation
   from past observed data.

   Parametric and non-parametric tests for trend detection for
   hydro-meteorological and hydrological variables in the basin.

                                                                      4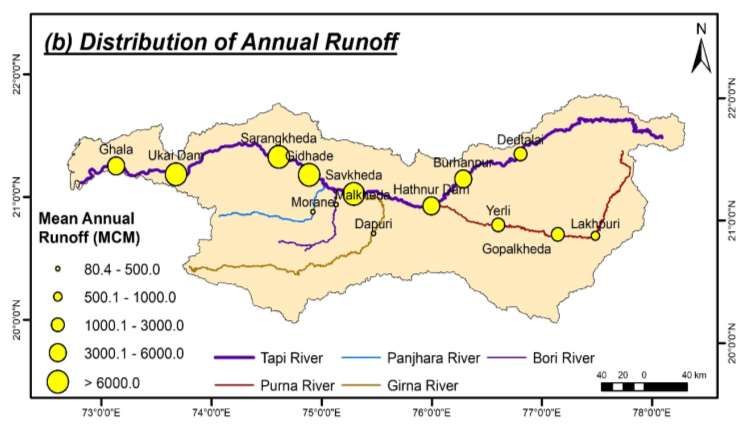
Objectives of the project

   Performance evaluation of Ukai reservoir under changing
   climatic conditions in fulfilling its requirements of irrigation,
   hydropower and flood control.

   Using the output from dynamic/statistical downscaling,
   prediction of flood situation downstream of Ukai reservoir in
   lower Tapi River and preparation of flood risk maps of the
   Surat city under changing climatic conditions.

   Organize Workshops during the project duration as capacity
   building measures and awareness for the stakeholders in the
   river basin and academic institutions involved in such
   activities.
                                                                       5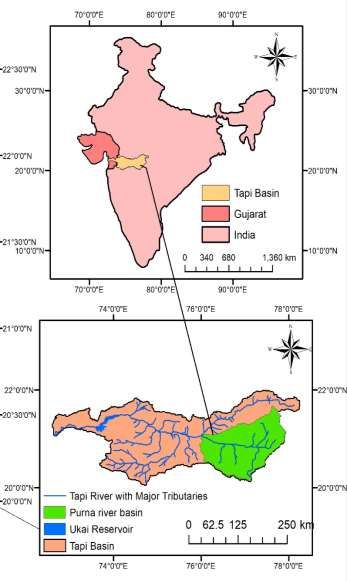
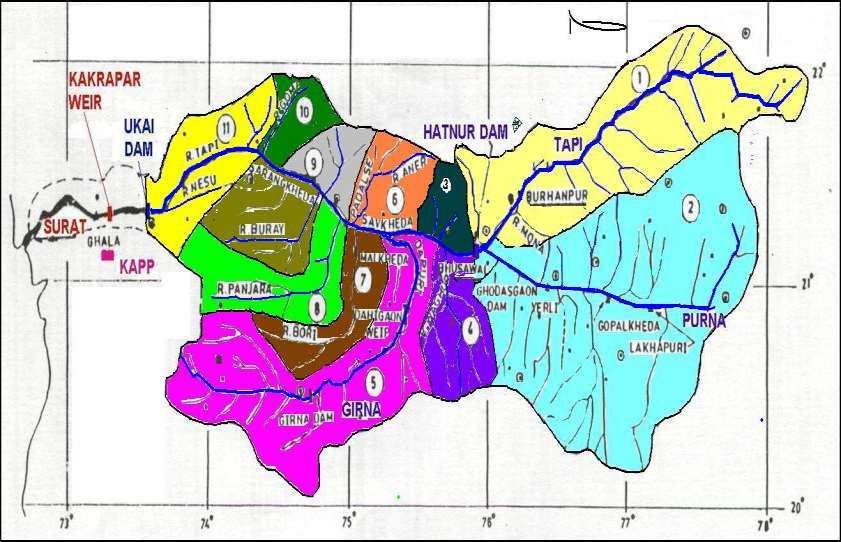
Study area
 •   The Tapi River is the second largest westward flowing
     river originating from the Indian Peninsula covering
     geographical area of 65,145 km2.

 •   The Tapi River, with its origin at Multai (RL=752 m) in
     Madhya Pradesh, traverses around 720 km distance
     before meeting with the Arabian Sea just 12 km from
     the heart of the Surat city.

 •   The catchment of the Tapi river, falls in Madhya
     Pradesh (9,804 km2), Maharashtra (51,504 km2) and
     Gujarat (3,838 km2) states.

     Upper Tapi         • Multai to Hathnur dam
       Basin            • Area: 29,430 km2

     Middle Tapi        • Hathnur dam to Ukai dam
       Basin            • Area: 31,735 km2

     Lower Tapi         • Ukai dam to Arabian Sea
       Basin            • Area: 3,980 km2
                                                           6
BROAD METHODOLOGY
                                    DATA OF TAPI BASIN

   Ukai          LU, LC,                          Downscaled                         Topographical data
Irrigation         soil          Observed         predictands              Ukai      of lower Tapi river   Tidal
command         and topo-       hydrological           at                reservoir   and bathymetry of     levels
   area         graphical          data           basin level              data           Surat city
                  data

                Calibration of rainfall
                   - runoff model                    Inflow
                     (SWAT) and                    prediction
                  uncertainty with                 into Ukai
                  respect to model                  reservoir
                     parameters

                                                Reservoir operation
Sensitivity analysis of                         (Ukai) for irrigation,
 cropping pattern in                           flood and industrial/
 the Ukai command                                domestic demand
area under changing
 climatic conditions

                                            Hydrodynamic modelling
                                                     of lower
                                             Tapi river for different
                                               climate scenarios

                                            Flood scenarios under
                                               changing climatic
                                          conditions and preparation
                                            of flood risk map of the                                                7
                                                    Surat city
SCOPE OF WORK
Sub-catchment classification in tapi basin
8SCOPE OF WORK
SVNIT - Surat
• Collection/extraction of data, with the help of associate institutes, related to
stream gauging, land use and land cover, topographical maps, soil map;
reservoir inflow-outflow, levels, and releases pattern; cropping pattern of
1. Ukai command area including crop calendar; bathymetry of lower Tapi river
and Surat city, past flood levels in Surat city; and Tidal levels.
• Detection of trend in hydro-meteorological variables (as per TOR-2)
in the sub-catchment of Tapi basin identified for the study.
2.
• Development of rainfall-runoff and sediment yield model for Purna
catchment (subcatchment-2) for present as well future scenarios.
3.
Completed work On Going work 9SCOPE OF WORK
SVNIT - Surat
• Calibration of hydraulic model (MIKE Flood) and
prediction of flood situations in the downstream of Ukai
4. reservoir under present and changing climatic situations.
• Sensitivity analysis of cropping pattern in Ukai command
area under revised water yield in Ukai reservoir under
5. changing climatic conditions.
• Assessment of reservoir (Ukai) behaviour under changing
climatic conditions vis-à-vis present condition, and
6. propose revised rule curve for its operation, if required.
On Going work
10SCOPE OF WORK
mNIT - jaipur
• Development of rainfall-runoff and sediment yield model for upper Tapi
basin (sub-catchments 1, 3, 4) after taking input from SVNIT for Purna
1. catchment at the junction of Tapi River.
• Detection of trend in hydro-meteorological variables (as per TOR-2) in the
sub-catchment of Tapi basin identified for the study.
2.
• Performance evaluation of Hathnur reservoir under changing climatic
conditions for both observed as well as future RCP scenario.
3.
• To assist lead Institute in collection/extraction of field data.
4.
On Going work 11SCOPE OF WORK
mANIT - Bhopal
• Development of rainfall-runoff and sediment yield model for sub-
catchments 5, 6, 7, 8, 9, 10, 11; and compute the inflow into Ukai reservoir
1. after taking input from the MNIT Jaipur.
• Detection of trend in hydro-meteorological variables (as per TOR-2) in the
sub-catchment of Tapi basin identified for the study.
2.
• Performance evaluation of Girna reservoir under changing climatic
conditions for both observed as well as future RCP scenarios.
3.
• To assist lead Institute in collection/extraction of field data.
4.
On Going work 12REVIEW OF FIRST R & D SESSION
Research staff were appointed w.e.f. June 28, 2018
o Mr. Shubham M. Jibhakate, Senior Research Fellow (SRF)
o Mr. Lalit Kumar Gehlot, Junior Research Fellow (JRF)
The procurement of equipment (Workstation/Trimble GPS), MIKE-SHE and ArcGIS 10.6
were processed as well as the data providing agencies were approached for the
collection of the relevant base line data.
Investigation of long-term trends in the extreme rainfall (1944-2013) and temperature
(1969-2012) indices as per ETCCDMI for Upper Tapi basin was completed and the key
findings of the study were discussed.
Assessment of long-term trends in the extreme rainfall (1944-2013) and temperature
(1969-2012) indices, recommended by Expert Team on Climate Change Detection
Monitoring Indices (ETCCDMI), for Middle and Lower Tapi basin were under progress.
Expenditure under the project under different heads out of released fund as well as
balance fund were presented.
Work plan for the second half of year 2018-19 were discussed.
13PROGRESS OF PROJECT WORK
The relevant data is collected from data providing agencies like CWC, SWDC, Narmada
Water Resources, Water Supply and Kalpsar department and IMD.
The procurement of Equipment and Software to be complete by end of financial year
2018-19
o SVNIT SURAT- Procurement of Workstation, 2 Desktop Computers, MIKE SHE software
and Printer are under completion and procedure for the procurement of Arc-GIS 10.6
software, fine resolution Topographic sheets is initiated.
o MNIT JAIPUR- Desktop and Printer are procured and procurements of the remaining
equipment are under process.
o MANIT BHOPAL- Procurement of 2 Nos. desktop computers is completed, one Laptop,
software purchase are under process.
Investigation of long-term trends in the extreme rainfall (1944-2013) and temperature
(1969-2012) indices and for Upper Middle and Lower Tapi basin has been already
completed.
Assessment of trend in annual Runoff along with extreme Rainfall and stream flow indices
(1973-2013) has been already completed.
A 2-Day training program on “Hydrological modelling using SWAT including Parametric
Uncertainty and Sensitivity Analysis” was organised during February 8-9, 2019.
A site visit along the gauging station of Lower Tapi River up-to Ukai dam is completed
during the procurement of the data. 14PROGRESS OF PROJECT WORK
Trend analysis of Hydro-meteorological variables
STUDY AREA
15PROGRESS OF PROJECT WORK
Trend analysis of meteorological variables
• BASIC INDICES 12
• Total annual rainfall Rainfall
(PRCPTOT)
• Number of rainy days (RD), indices Extreme
• Simple daily intensity index
(SDII) Climate
• ABSOLUTE INDICES
• Maximum 1-day rainfall
Indices
•
(Rx1day)
Maximum 5-day rainfall
recommended
(Rx5day) by ETCCDMI
• THRESHOLD INDICES
• Moderate rainfall days
5 Temperature
(2003)
(Rmod) – 7.5 < R < 64.5 mm
• Heavy rainfall days (Rheavy)
indices
– 64.5 < R < 124.5 mm
• PERCENTILE-BASED INDICES
• Very wet days (R95p) • MAXIMUM TEMPERATURE BASED
• Extremely wet days (R99p) • Hottest day (TXx)
• RELATIVE INDEX • Coldest day (TXn)
• Rainfall extreme proportion • MINIMUM TEMPERATURE BASED
(R5TOT) • Warmest night (TNx)
• DURATION BASED INDICES • Coldest night (TNn)
• Consecutive dry days (CDD) • TEMPERATURE DIFFERENCE BASED
• Consecutive wet days (CWD) • Diurnal temperature range (DTR)
16PROGRESS OF PROJECT WORK
Key findings Rainfall trends
Upper Tapi Basin Total annual rainfall Rainy days - Rainfall intensity
- PRCPTOT RD - SDII
• The total annual rainfall
(PRCPTOT) for period 1944-
2013 exhibited decreasing
trends at 17 out of 24 rain
gauge stations.
• The rainfall in monsoon
months displayed dichotomic
behaviour, wherein increasing
trends in June and August
months, and decreasing trends Very wet days (R95p)
in July and September months Extremely wet days (R99p)
were observed.
• The number of rainy days (RD)
exhibited decreasing trend
across the basin.
• The rainfall intensity (SDII)
and extreme rainfall (R95p &
R99p) events exhibited
increasing trends across Upper
Tapi Basin.
17PROGRESS OF PROJECT WORK
Key findings Rainfall trends
Middle Tapi Basin Total annual rainfall Rainy days - Rainfall intensity
- PRCPTOT RD - SDII
• The total annual rainfall
(PRCPTOT) over the basin has
been reported to be decreasing
at 18 of 25 stations in Middle
Tapi Basin.
• The number of rainy days (RD)
exhibited decreasing trend
across the basin.
• The rainfall intensity (SDII)
Very wet days (R95p)
shows the increasing tends Extremely wet days (R99p)
across the basin.
• The extreme rainfall events
R95p (15, 5 Significant ) and
R99p (17, 3 Significant )
exhibited decreasing trends
across Middle Tapi Basin.
18PROGRESS OF PROJECT WORK
Key findings Rainfall trends
Lower Tapi Basin Total annual rainfall Rainy days - Rainfall intensity
- PRCPTOT RD - SDII
• The total annual rainfall
(PRCPTOT) is found to be
increased at 7 out of 9 station
across the Lower Tapi basin.
• The rainfall in monsoon month
June, August and September are
showing increasing trend
whereas the July month shows
the mixed trend.
Very wet days (R95p)
• The seasonal total and monsoon
Extremely wet days (R99p)
rainfall exhibits increasing trend
over the basin except Ukai and
Kakrapar stations .
• The number of rainy days (RD)
are significantly decreasing on
the other hand rainfall intensity
(SDII) significantly increasing.
• The extreme rainfall (R95p &
R99p) events exhibited increasing
trends across the basin.
19PROGRESS OF PROJECT WORK
Key findings Temperature trends Upper Tapi Basin
(1969-2012)
Hottest days Coldest days Warmest night
(TXx) (TXn) • The Hottest days (TXx) are
(TNx)
Increasing annually within the
basin, where as coldest day
(TXn) are observed to be
decreasing annually across the
basin.
• The Warmest night (TNx) are
decreasing in Burhanpur sub-
catchment and increasing in
Purna sub-catchment except
Coldest Night Diurnal Temperature
range (DTR) Amravati region.
(TNn)
• The coldest nights (TNn) are
increasing in Burhanpur sub-
catchment where as
decreasing in Purna sub-
catchment.
• The Diurnal Temperature
range (DTR) is increasing
within entire basin except
Khandwa region.
20PROGRESS OF PROJECT WORK
Key findings Temperature trends Middle Tapi Basin
(1969-2005)
Hottest days Coldest days Warmest night
• The Hottest days (TXx) are
(TXx) (TXn) (TNx)
Increasing annually within the
basin, where are coldest day
(TXn) are observed to be
decreasing annually across the
basin.
• The Warmest night (TNx) are
decreasing annually except
Dhule region through out the
basin.
Coldest Night Diurnal Temperature
• The coldest nights (TNn) are
(TNn) range (DTR)
annually increasing, except
Jalgaon region where
decreasing trend is observed
within the basin.
• The Diurnal Temperature
range (DTR) is increasing
annually except Jalgaon and
Ozar region.
21PROGRESS OF PROJECT WORK
Key findings Temperature trends Lower Tapi Basin
Hottest days Warmest night
(2000-2016)
Coldest days (TXn)
(TXx) (TNx) • The short-term trend (2000-
2016) exhibits the results of
decrease in annual Hottest
days (TXx) similar trend in
coldest days (TXn) except
coastal region in the basin.
• The Warmest night (TNx) are
decreasing annually except
Ghala and Ukai region across
Coldest Night Diurnal Temperature the basin.
(TNn) range (DTR) • The coldest nights (TNn) are
showing overall increasing
trend.
• The Diurnal Temperature range
(DTR) exhibits overall
increasing trend.
22PROGRESS OF PROJECT WORK
STREAMFLOW AVAILABILITY ACROSS TAPI BASIN
23PROGRESS OF PROJECT WORK
TRENDS IN ANNUAL RUNOFF (1973-2013)
24PROGRESS OF PROJECT WORK
EXTREME STREAMFLOW INDICES
Indicator Indicator Name Indicator Type Indicator Definition Unit
Extreme streamflow indices
Qx1day Maximum 1-day Absolute Annual maximum 1-day m3/s
flow streamflow
Qx5day Maximum 5-day Absolute Annual maximum consecutive m3/s
flow 5-day streamflow
Q99p Very high flow days Percentile- Annual total streamflow from m3/s
based days > 99th percentile
Q95p High flow days Percentile- Annual total streamflow from m3/s
based days > 95th percentile
LFD Low flow days Frequency- Maximum number of days
based consecutive days when
streamflow < 10th percentile
25PROGRESS OF PROJECT WORK
TRENDS IN EXTREME RAINFALL & STREAMFLOW INDICES (1973-2013)
26PROGRESS OF PROJECT WORK
KEY CONCLUSIONS
• The annual runoff has been found to decrease at all the stream
gauging stations except Dedatalai, Burhanpur and Hathnur dam, with
significant decrease in Middle Tapi basin.
• The extreme streamflow indices (Qx1day and Qx5day) indicated
decreasing trend at all stations, except Dedtalai, Hathnur dam,
Malkheda and Morane stations.
• The percentile-based streamflow indices, viz., Q95p and Q99p,
exhibit decreasing trends across most stations, except for Ukai dam
and Dedtalai stations.
• The low flow days (LFD) were also found to be significantly
increasing at all the stations except Gidhade, Ukai dam and Ghala
stations.
27Expenditures foR FY 2018-19
SVNIT, SURAT
Fund Fund
Sr. Head of Fund Spent Balance
Sanctioned Released
No. Expenditure (Rs.) (Rs.)
(Rs.) (Rs.)
1 Salary 3542400 1062720 348549 714171
Travel
2 233000 69900
Expenditure 57375 12525
Infrastructure/
3 3310815 3310815
Equipment 2032361* 1278454
Experimental
4 870000 261000
Charges 175322 85678
5 Sub Total 7956215 4704435 2613607 2090828
6 Contingencies 67000 0 20946 -20946
7 Total 8023215 4704435 2634553 2069882
Institute
8 802322 0
Overhead 0
9 Grand Total 8825537 4704435 2634553 2069882
* Procurement of Workstation, MIKE-SHE, ARCGIS 10.6, Desktop Computers and Printer will be
completed in current financial year. 28WORK PLAN FOR FIRST HALF OF
YEAR 2019-20
SVNIT-Surat
• Development of Hydrologic Model using SWAT for Purna sub-
catchment (2) and Calibration & Validation using historical data.
• Development of Hydrologic Model using MIKE-SHE for Lower Tapi
Basin and Calibration & Validation using historical data.
MNIT-Jaipur
• Development of Hydrologic Model using SWAT for sub-catchment 1,3
& 4; Calibration & Validation using historical data.
MANIT-Bhopal
• Development of rainfall-runoff and sediment yield model for sub-
catchments 5, 6, 7, 8, 9, 10, 11.
• Compute the inflow into Ukai reservoir after taking input from the
MNIT Jaipur.
2930
You can also read