RESULTS PRESENTATION FOR THE 12 MONTHS ENDED
                31 MARCH 2014
←
→
Page content transcription
If your browser does not render page correctly, please read the page content below

RESULTS PRESENTATION FOR THE 12 MONTHS ENDED
31 MARCH 2014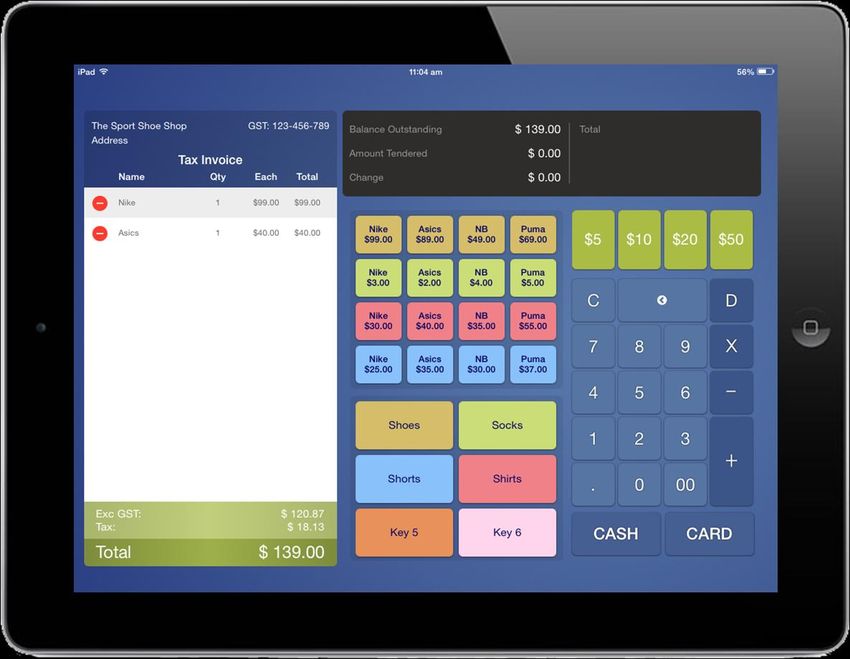
Disclaimer
  This presentation may contain certain statements and projections provided by or on behalf of SmartPay Group (SmartPay) with respect to
  anticipated future undertakings. Any forward looking statements reflect various assumptions by or on behalf of SmartPay. Accordingly,
  these statements are subject to significant business, economic and competitive uncertainties and contingencies associated with the
  business of SmartPay which may be beyond the control of SmartPay which could cause actual results or trends to differ materially,
  including but not limited to competition, industry downturns, inability to enforce contractual and other arrangements, legislative and
  regulatory changes, sovereign and political risks, ability to meet funding requirements, dependence on key personnel and other market
  and economic factors. Accordingly, there can be no assurance that any such statements and projections will be realised. SmartPay makes
  no representations as to the accuracy or completeness of any such statement of projections or that any projections will be achieved and
  there can be no assurance that any projections are attainable or will be realised.

  Additionally, SmartPay makes no representation or warranty, express or implied, in relation to, and no responsibility or liability (whether
  for negligence, under statute or otherwise) is or will be accepted by SmartPay or by any of their respective officers, directors, shareholders,
  partners, employees, or advisers (Relevant Parties) as to or in relation to the accuracy or completeness of the information, statements,
  opinions or matters (express or implied) arising out of, contained in or derived from this presentation or any omission from this
  presentation or of any other written or oral information or opinions provided now or in the future to any interested party or its advisers. In
  furnishing this presentation, SmartPay undertakes no obligation to provide any additional or updated information whether as a result of
  new information, future events or results or otherwise.

  Except to the extent prohibited by law, the Relevant Parties disclaim all liability that may otherwise arise due to any of this
  information being inaccurate or incomplete. By obtaining this document, the recipient releases the Relevant Parties from liability to the
  recipient for any loss or damage which any of them may suffer or incur arising directly or indirectly out of or in connection with any use of
  or reliance on any of this information, whether such liability arises in contract, tort (including negligence) or otherwise.

  This document does not constitute, and should not be construed as, either an offer to sell or a solicitation of an offer to buy or sell
  securities. It does not include all available information and should not be used in isolation as a basis to invest in SmartPay.

Page 1

Agenda

    1    Full Year Financial Highllights

    2    Results Table for the Full Year

    3    Results Commentary

    4    Business Update

    5    Summary and Outlook

Page 2
Full Year Financial Highlights

     1   Full Year Financial Highllights

    2    Results Table for the Full Year

    3    Results Commentary

    4    Business Update

    5    Summary and Outlook

Page 3
Full Year Financial Highlights

   • Record full year profit

   • Revenue of $22.9m, up 37% on the previous period of $16.7m

   • EBITDA* of $9.7m, up 76% on the previous period of $5.5m

   • Net Profit After Tax of $1.7m, up on previous period Net Loss After
         Tax of $5.0m

   • Diluted EPS of 1.0 cents, up on prior year loss of 3.8 cents

   • Net Debt down to $21.7m from $24.3m in the prior period

   *EBITDA = Earnings Before Interest, Tax, Depreciation, Amortisation (including share option amortisation),
              impairments and foreign exchange adjustments

Page 4
Results Table for the Full Year

    1    Full Year Financial Highllights

     2   Results Table for the Full Year

    3    Results Commentary

    4    Business Update

    5    Summary and Outlook

Page 5
Results Table for the Full Year
         Statement of Comprehensive Income                                    Full Year -Unaudited
                                                                                       Group
                                                                                    2014            2013

                                                                                NZ$’000         NZ$’000

         Total Revenue                                                           22,906          16,722
         Earnings before interest , tax, depreciation, share options
         expense, amortisation, impairments and foreign exchange                  9,667            5,468
         adjustments
         Depreciation and amortisation                                           (4,049)          (4,485)
         Share option amortisation                                                 (380)            (373)
         Net finance costs                                                       (1,837)          (3,410)
         Property, plant and equipment impairment                                  (682)            (510)
         Unrealised foreign exchange adjustments                                   (983)             -
         Goodwill impairment                                                        -               (753)
                                                                                 (7,931)          (9,531)

         Profit / (loss) before tax                                               1,736           (4,063)
         Tax credit/(expense)                                                       -               (974)

         Profit / (loss) for the year from continuing operations of owners        1,736           (5,037)
         Other comprehensive income
         Foreign currency translation differences for foreign operations            485              (11)
         Total comprehensive income of owners                                     2,221           (5,048)

         Earning / (losses) per share from continuing operations
         Basic earnings/(loss) per share - cents                             1.01 cents    (3.77) cents
         Diluted earnings/(loss) per share - cents                           1.01 cents    (3.77) cents
Page 6
Results Commentary

    1    Full Year Financial Highllights

    2    Results Table for the Full Year

     3   Results Commentary

    4    Business Update

    5    Summary and Outlook

Page 7
Results Commentary

   • Normalised EBITDA*= of $9.4m after adjusting for non-recurring
         items

   • Increase in Net Profit After Tax to $1.7m after a negative $1.0m of
         unrealised forex adjustments due to weaker A$ vs NZ$

   • Results include full year contribution from Viaduct acquisition
         completed in January 2013 (2 months included in prior period)

   • On a pro-forma basis excluding Viaduct acquisition, revenue increased
         6% and EBITDA* increased 36% (30% normalised)

   *EBITDA = Earnings Before Interest, Tax, Depreciation, Amortisation (including share option amortisation),
              impairments and foreign exchange adjustments

Page 8
Business Update

    1    Full Year Financial Highllights

    2    Results Table for the Full Year

    3    Results Commentary

     4   Business Update

    5    Summary and Outlook

Page 9
Business Update
New Zealand
• Past 12 months focused on:
1. Consolidation post restructure and integration of Viaduct
acquisition
2. New product development
• We have achieved significant advances in technology / products
including development of market leading mobile payments
technology.
• We are seeing new growth opportunities through increasing
engagement with banks and merchants seeking our new products and
technology capability.
• Targeting increase in both terminal numbers and Revenue Per Unit.
Page 10Business Update
New Products - Mobility Solutions
Interoperability Developer Programme
integration available through
Smartlink – Smartpay’s Secure API
11Business Update
New Products - Mobility Solutions
Till2Go
Page 12Business Update
Australia
• Australian sales business commenced during the financial year
• Initial focus on identifying and testing sales channels
• Market opportunity: 800,000 terminals = 5x larger than NZ with very
few direct competitors
• Structural shift underway from banks to independent providers
• Unique product offering through value add apps
• Terminal numbers are growing but still at early stage of development
Page 13Business Update
Australian Sales Channels
Banks Direct Resellers Partners Web
1. Smartpay enables The Direct Sales The Resellers Channel is Together with our The Smartpay website is
banks with innovative Channel performs two manages 3rd party Partners Channel we driving enquiries to the
merchants technology functions: companies who sell create value-added Smartpay sales teams,
to offer to their Lead Generation and Smartpay solutions services and solutions making full use of SEO
customers; Lead Conversion direct to merchants on for merchants. Our and SEM as well as
Smartpay’s behalf partners typically have other inbound and
This channel is specific verticals to outbound marketing
2. Smartpay provides responsible for whom we jointly sell campaigns
an outsourced sourcing, qualifying and the new solutions
merchant acquisition converting leads to
services to our bank / transacting merchants
acquirer partners with
flexible solutions.
At capacity, every 1,000 terminals added = ~A$500k incremental revenue / EBITDA
Page 14Business Update
Taxis
• Australian taxi market undergoing significant change:
• Regulatory change reducing payment surcharge fees from 10% -
5% in Vic from Feb 2014, NSW set to follow
• Technology disruption as smartphone booking “apps”
disintermediate traditional dispatch networks
• Smartpay has core competency in taxi payments technology
• Current Australian taxi supply contract representing around 8% of
revenue ends Dec 14
• “Smartpay Taxis” business to launch soon to capitalise on changes
underway in the market
• Introduction of market leading taxi payment eco system technology
combining booking apps with terminals to gain market share
Page 15Summary and Outlook
1 Full Year Financial Highllights
2 Results Table for the Full Year
3 Results Commentary
4 Business Update
5 Summary and Outlook
Page 16Summary and Outlook
• Milestone financial result
• Significant opportunity leading innovation in a changing market
• We have experience, scale, capability and competitive advantage
• High margin, scalable business with barriers to entry
• Significant and real growth opportunities:
– Australian sales growth coming on line
– Forefront of next generation mobile payments technology
Page 17Questions
Questions.
Page 18You can also read