WINTERSHALL DEA Q2 2020 RESULTS PRESENTATION - MARIO MEHREN (CEO), PAUL SMITH (CFO)

Page created by Alma Hogan
 
CONTINUE READING
WINTERSHALL DEA Q2 2020 RESULTS PRESENTATION - MARIO MEHREN (CEO), PAUL SMITH (CFO)
WINTERSHALL DEA

 Q2 2020 RESULTS PRESENTATION

   MARIO MEHREN (CEO), PAUL SMITH (CFO)

             AUGUST 19, 2020
WINTERSHALL DEA Q2 2020 RESULTS PRESENTATION - MARIO MEHREN (CEO), PAUL SMITH (CFO)
Q2 2020 RESULTS PRESENTATION

DISCLAIMER

This document has been prepared by                    Forward-Looking Statements                             Non-GAAP and Non-IFRS Financial Measures
Wintershall Dea GmbH (“the Company”) for
                                                      This document includes projections and other           This document contains certain non GAAP and
information purposes only.
                                                      “forward-looking statements”, which are based          non IFRS measures and ratios, including for
The information contained in this document has        on expectations of the Company’s management            example EBITDAX, net debt and adjusted net
not been independently verified and no                and projections about future events and                income that are not required by, or presented in
representation or warranty, express or implied,       financial performance as of the date of the            accordance with, any GAAP or IFRS.
is made as to, and no reliance should be placed       presentation. These forward-looking statements
                                                                                                             These non GAAP and non IFRS measures and
on, the fairness, accuracy, completeness or           involve a number of risks, uncertainties, and
                                                                                                             ratios may not be comparable to similarly titled
correctness of the information or opinions            assumptions about the Company and its
                                                                                                             measures used by other companies and have
contained herein. None of the Company or any          subsidiaries, which are beyond the control of the
                                                                                                             limitations as analytical tools and should not be
of their respective affiliates, advisors, or          Company. In light of these risks, uncertainties
                                                                                                             considered in isolation or as a substitute for
representatives shall have any liability              and assumptions, actual results may not occur
                                                                                                             analysis of our operating results as reported
whatsoever (in negligence or otherwise) for any       or may differ materially from those predicted in
                                                                                                             under IFRS or any GAAP.
loss whatsoever arising from any use of this          the forward-looking statements and from the
document, or its contents, or otherwise arising in    past performance of the Company. As a result,
connection with this document.                        you should not rely on these forward-looking
                                                      statements. The Company accepts no obligation
This document does not constitute, or form part
                                                      to update any forward-looking statements set
of, an offer or invitation to purchase any
                                                      forth herein or to adjust them to future events
securities and neither it nor part of it shall form
                                                      or developments.
the basis of, or be relied upon in connection with,
any contract or commitment whatsoever.

                                                                                                          PAGE 2
WINTERSHALL DEA Q2 2020 RESULTS PRESENTATION - MARIO MEHREN (CEO), PAUL SMITH (CFO)
TBU

Q2 2020 HIGHLIGHTS

        PAGE 3
Q2 2020 RESULTS PRESENTATION

   MACROECONOMIC BACKDROP
   TTF PRICE DEVELOPMENT ($/MSCF)                                                                                 BRENT PRICE DEVELOPMENT ($/BBL)
Quarterly                                                                                                                   63            69            62            63                          30
                 7.1              4.8             3.6             4.7            3.7            2.1                                                                                 50
averages
                                                                                                                  80

       8                                                                                                          70

                                                                                                                  60

       6
                                                                                                                  50

                                                                                                                  40
       4
                                                                                                                  30

                                                                                                                  20
       2

                                                                                                                  10

       0                                                                                                           0
       Jan 19           Apr 19           Jul 19          Oct 19         Jan 20         Apr 20         Jul 20       Jan 19        Apr 19        Jul 19        Oct 19        Jan 20        Apr 20        Jul 20

   SOURCE: HEREN/ARGUS/PLATTS; FX CONVERSION ACCORDING TO ECB

                                                                                                               PAGE 4
Q2 2020 RESULTS PRESENTATION

SECOND QUARTER PERFORMANCE

       OPERATIONAL                                                                          FINANCIAL                                                                           HEALTH AND
                                                                                                                                                                                SAFETY

       606                  Production(1)                                                    254                 EBITDAX
                                                                                                                                                                                0.58 LTIF
       mboe/d               Q2 2019(2): 614 mboe/d                                           € million           Q2 2019(2): €683 million
                                                                                                                                                                                                     Q2 2019: 0.36

       3.5                  Production Cost                                               -294 Free Cash Flow                                                                   1.57 TRIR
       $ per boe            Q2 2019(2): $4.1/boe                                              € million          Q2   2019(2):   €33 million                                                         Q2 2019: 3.49

       367                  CAPEX(3)                                                        90                   Adj. Net Income
                                                                                                                 Q2 2019(2): €330 million
                                                                                            € million
       € million            Q2 2019(2): €465 million

1)   EXCLUDING LIBYA ONSHORE PRODUCTION
2)   LIKE-FOR-LIKE PRESENTATION, AGGREGATING THE INCOME STATEMENT OF THE WINTERSHALL GROUP FOR APRIL 2019 (IN THE NEW REPORTING STRUCTURE), THE INCOME STATEMENT OF THE DEA GROUP FOR APRIL 2019 (IN THE NEW REPORTING STRUCTURE) AND THE
     INCOME STATEMENT OF THE WINTERSHALL DEA GROUP FOR MAY - JUNE 2019, EFFECTS FROM THE PURCHASE PRICES ALLOCATION ONLY INCLUDED FROM 1 MAY 2019 ONWARDS
3)   INCLUDING CAPITALIZED EXPLORATION AND ACQUISITIONS                                                                 PAGE 5
Q2 2020 RESULTS PRESENTATION

DELIVERING ON CRISIS ACTIONS

                               IMPLEMENTED                             CONTINUING
TOP PRIORITIES                 DECISIVE MEASURES                       TO DELIVER

Protecting our people              Production and development capex    No material impact to production
                               ✓
                                   budget reduced by 30%
Business continuity
                               ✓   Exploration budget reduced by 20%
                                                                       Record low production costs of
Balance sheet                                                          $3.5/boe in Q2 achieved

                               ✓   Opex budget reduced by 10%

                                                                       Positive free cash flow outlook for
                               ✓   Dividend suspended                  2020

                                                   PAGE 6
Q2 2020 RESULTS PRESENTATION

SECOND QUARTER OVERVIEW
Strong operational performance
- Stable production
- 2020 project delivery on track
- Two near field discoveries in Norway                         -
- Evaluation of Mexico discoveries and follow-up potential
ongoing

Financial performance impacted by low commodity prices
- €776 million post-tax impairment charge taken

Delivering on crisis actions
- Spending cuts on track
- Record low production costs at $3.5/boe
Forecasting Free Cash Flow positive Full Year Outlook
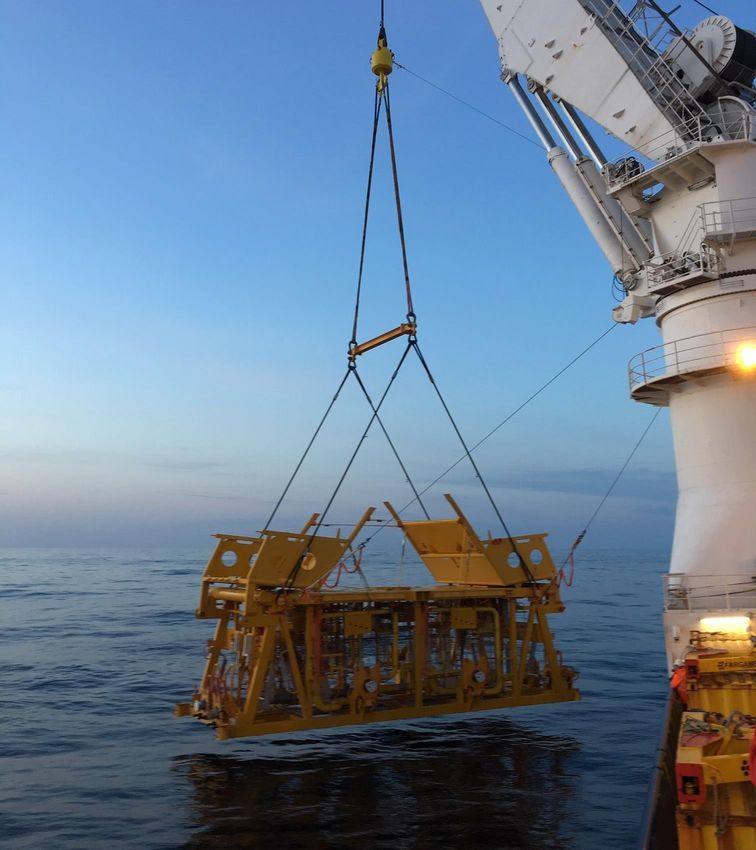
- Temporary tax incentives in Norway                           DVALIN DEVELOPMENT CONCEPT

Reaffirmed credit ratings at Baa2/BBB (neg/sta)

                                                             PAGE 7
FINANCIAL AND
OPERATIONAL RESULTS

        PAGE 8
Q2 2020 RESULTS PRESENTATION

  RESULTS SUMMARY
                                                                                         Unit                                                                                                                                      Q2 2020                                                     Q2 2019(2)
   Environment

                            Production(1)                                                mboe/d                                                                                                                                                606                                                           614

                            Brent                                                        $/boe                                                                                                                                                  30                                                             69

                            Gas TTF                                                      $/mscf                                                                                                                                                 2.1                                                           4.8

                            EBITDAX                                                      € million                                                                                                                                             254                                                           683
   Financial Results

                            Operating Cash Flow                                          € million                                                                                                                                              99                                                           494

                            Capex(3)                                                     € million                                                                                                                                             367                                                           465

                            Free Cash Flow                                               € million                                                                                                                                           -294                                                              33

                            Adjusted Net income(4)                                       € million                                                                                                                                              90                                                           330

                                                                                                                                                                                                                               30.06.2020                                                     31.03.2020
Balance Sheet
   Liquidity

                            Net Debt                                                     € million                                                                                                                                          5,999                                                         5,713

                            Leverage Ratio (LTM)                                         x                                                                                                                                                      2.9                                                           2.3

                            Liquidity                                                    € million                                                                                                                                          1,797                                                       2,441(5)

  (1)                  EXCLUDING LIBYA ONSHORE PRODUCTION; THE PERIOD Q2 2019 COMPRISES PRODUCTION FOR WINTERSHALL DEA GROUP ON AL LIKE-FOR-LIKE BASIS (AGGREGATING PRODUCTION FOR WINTERSHALL GROUP FOR APRIL 2019, THE PRODUCTION FOR DEA GROUP FOR APRIL 2019 AND THE PRODUCTION FOR WINTERSHALL DEA GROUP FOR MAY
                       – JUNE 2019) ON A WORKING INTEREST BASIS; INCLUDING PROPORTIONAL PRODUCTION FROM AT EQUITY ACCOUNTED COMPANIES
  (2)                  LIKE-FOR-LIKE PRESENTATION, AGGREGATING THE INCOME STATEMENT OF THE WINTERSHALL GROUP FOR APRIL 2019 (IN THE NEW REPORTING STRUCTURE), THE INCOME STATEMENT OF THE DEA GROUP FOR APRIL 2019 (IN THE NEW REPORTING STRUCTURE) AND THE INCOME STATEMENT OF THE WINTERSHALL DEA GROUP FOR MAY -
                       JUNE 2019, EFFECTS FROM THE PURCHASE PRICE ALLOCATION ONLY INCLUDED FROM 1 MAY 2019 ONWARDS.
  (3)                  INCLUDING CAPITALIZED EXPLORATION AND ACQUISITIONS
  (4)                  ADJUSTED FOR SPECIAL ITEMS LIKE IMPAIRMENT LOSSES AND EXPENSES RELATED TO THE MERGER SUCH AS RESTRUCTURING AND INTEGRATION
  (5)                  AS REPORTED, INCLUDING WORKING CAPITAL LINES SIGNED AFTER QUARTER END
Q2 2020 RESULTS PRESENTATION

PRODUCTION
PRODUCTION(1) (WI, MBOE/D)                                                                                                         Q2 2020 PRODUCTION(1) COMPOSITION

% Gas               72%                    72%                   71%                    73%             73%               73%                 Brent
                                                                                                                                              Crude
                                                                                                                                                      17%

                     626                                                                638              626                                                                   Russia
                                           614                                                                             606
                                                                  589                                                                                                    38%    Gas
                     74                                                                  75              70
                     41
                                            76
                                            48
                                                                   80                    55              49
                                                                                                                           74
                                                                                                                           46       Europe
                                                                                                                                                            606
                                                                   59                                                                         18%          (mboe/d)
                                                                                                                                   Spot Gas

                     306                   280                                          307              300               287
                                                                  264                                                                                 7%
                                                                                                                                                                   9%
                                                                                                                                     Other Non-             10%
                                                                                                                                     Europe Gas                           Russia
                                                                                                                                                       Argentina        Condensate
                     205                   210                    186                   200              207               199                            Gas

                 Q1 2019                Q2 2019               Q3 2019                Q4 2019           Q1 2020           Q2 2020
                                                                                                                                      ~36% of total production linked directly
                                                                                                                                       to spot Brent and European gas prices
                               Northern Europe                       Russia                     MENA             Latam
(1)   INCLUDES PRODUCTION FROM AT-EQUITY ACCOUNTED COMPANIES, EXCLUDING LIBYA ONSHORE VOLUMES

                                                                                                          PAGE 10
Q2 2020 RESULTS PRESENTATION

REALIZATIONS
GAS ($/MSCF)                                                                         LIQUIDS ($/BOE)

                                                         -48%                                                                  -53%

                                                                                                        55

                            2.3

                                                                                                                                                        26
                                                                          1.2
                                                                                                        41

                                                                                                                                                        19

                        Q2 2019                                         Q2 2020                       Q2 2019                                       Q2 2020
                                                                                                                         (1)
                                                                                                        Realized price         Realized price, excl. Russian condensate

       TTF                                               -56%                               BRENT                              -57%
     ($/MCF)                 4.8                                          2.1               ($/BBL)    69                                               30

1)    AVERAGE REALIZED LIQUIDS PRICE INCLUDING OIL PRICE HEDGE RESULT

                                                                                  PAGE 11
Q2 2020 RESULTS PRESENTATION

PROFITABILITY

EBITDAX (€ MILLION)                                                           ADJUSTED NET INCOME (€ MILLION)

                                 -63%                                                                     -73%

             683

              78
              65
              95
                                                                                               330
             105

                                              254
                                                  58
                                                             27
             379                                             43                                                    90
                                                             37
                                              118
             -39                                            -29
           Q2 2019                          Q2 2020                                          Q2 2019             Q2 2020

      Northern Europe   Russia     Latam   MENA        Midstream   Other

                                                                           PAGE 12
Q2 2020 RESULTS PRESENTATION

COST PERFORMANCE
PRODUCTION COST EVOLUTION ($/BOE)                                                                                          PRODUCTION AND OPERATING EXPENSES

                                                                                                                                             Other

                                                                                                                                                                                 Production
          5.7                                                                                                                                        32%                            Costs
                               5.4                                                                                                                                         40%

                                                                                                                                                              €333
                                                     4.3                                                                                                       million
                                                                           4.1
                                                                                                 3.5

                                                                                                                                                               28%

                                                                                                                                                           Cost of Trade
                                                                                                                                                              Goods(1)

        2017                  2018                  2019               Q2 2019               Q2 2020

1)   COST OF TRADE GOODS INCLUDES PRIMARILY TRADING ACTIVITIES. OTHER PRIMARILY INCLUDES TRANSPORT FEES AND LEASES AND OTHER COST OF SALES

                                                                                                                       PAGE 13
Q2 2020 RESULTS PRESENTATION

CASH FLOW DEVELOPMENT AND BALANCE SHEET
CASH FLOW BRIDGE (€ MILLION)                                                                                 NET DEBT POSITION (€ MILLION)

                         99
                                       -393                                                                                                                                         Leverage
                                                                                                                                                                                      2.9x
                                                  -294
                                                               WIGA Group cash                                         6,463
                                                                   pooling
                                                               deconsolidation                                                    156                   -464
                                                                   effect                                               385
       1,091
                                                                                                                       1,904

                                                               -313

                                                                                  33
                                                                -70                                                                                                                     5,999

                                                             Other                                                     4,018
                                                                                                 447

                                                                                         (1)
      BoP Cash     Operating CF Investing CF      Free CF   Financing CF         Other         EoP Cash              Total debt              Cash, cash eq. and financial             Net debt
                                                                                                                                            receivables from cash pooling
                                                                                                                         Bonds      Debt to Banks      At-equity Liability   Leasing Liability

(1)    INCLUDING FX AND CHANGE OF CONSOLIDATION

                                                                                                          PAGE 14
Q2 2020 RESULTS PRESENTATION

LIQUIDITY AND DEBT MATURITY PROFILE
LIQUIDITY EVOLUTION (€ MILLION)                                                                                             STABLE DEBT MATURITY PROFILE (€ MILLION)(3)

              € 2.44 billion                              € 1.80 billion                                                                              1,000           1,000                 1,000                 1,000
                                                                                                                                               942            942

                     450

                                                                                                (1)
                                                                                         WCL
                     900                                          450                           (2)
                                                                                         RCF
                                                                                         Cash

                                                                  900

                    1,091

                                                                  447

                  Q1 2020                                      Q2 2020                                                        2020      2021   2022   2023    2024    2025    2026   2027   2028    2029   2030   2031

                                                                                                                                                       Senior Notes                     Term Loans

(1)   WORKING CAPITAL LINES SIGNED IN APRIL 2020
(2)   UNDRAWN COMMITTED RCF, DUE 2025
(3)   INCLUDES ONLY EXTERNAL DEBT; TERM LOANS DENOMINATED IN USD WITH NOMINAL SIZE $1,050 MILLION EACH, BUT DRAWN BOTH IN USD AND EUR
                                                                                                                        PAGE 15
Q2 2020 RESULTS PRESENTATION

GUIDANCE AND OUTLOOK

                                                                                                                  Q2 2020         H1 2020          2020 Guidance (Q1)

      Production(1)                                                                                       606 mboe/d         617 mboe/d           600 - 630 mboe/d

      Production and Development Capex(2)                                                                  €356 million      €689 million     €1,000 – 1,200 million

      Exploration Expenditures                                                                               €32 million     €103 million         €150 - 250 million

                                                                                                                                            Suspended until further
      Common Dividend                                                                                                  n/a           n/a
                                                                                                                                                             notice

(1)   INCLUDES IMPACT FROM BOTH CONSOLIDATED AND NON-CONSOLIDATES ENTITIES, EXCLUDING LIBYA ONSHORE PRODUCTION
(2)   EXCLUDES CAPITALIZED EXPLORATION EXPENDITURES AND NON-CONSOLIDATED ENTITIES
                                                                                                                 PAGE 16
APPENDIX

   PAGE 17
Q2 2020 RESULTS PRESENTATION

2020 FCF BREAK-EVEN AND SENSITIVITIES
2020 UPDATED SENSITIVITIES                                                                   FCF BREAK-EVEN PRICES

                                                                                                  $35-40/bbl
                                  EBITDAX                    FCF
                                                                                                                            ~$30/bbl
Q2 2020 RESULTS PRESENTATION

DEFINITIONS
  Adjusted            • Adjusted net income is net income adjusted for special items such as impairments, expenses related to the merger, deconsolidation effects and other
 Net Income              one-off effects

 Break-Even
                      • FCF Break-even defined as brent price required for free cash flow before acquisitions and dividends to be zero, assuming TTF of $4.0 / mcf and constant domestic prices.
    Price

                      • Capex (excluding M&A, incl. capitalized exploration expenditure) for the Group consists of payments for intangible assets, property, plant and equipment and investment
    CAPEX
                         property

                      • EBITDAX defined as income before tax but adjusted for the following items: financing costs, exploration expense, DD&A and impairments, acquisitions, disposals, identified
  EBITDAX
                         items, minority interest, FX gains and losses, pensions, loss or gain in relation to disposal of fixed assets

  Free cash
                      • Free cash flow for the Group comprises the cash flow from operating activities and the cash flow from investing activities but excludes payments for acquisitions
    flow

  Leverage            • Net debt divided by last twelve months EBITDAX

     LTIF             • Lost time injury frequency per million work-hours

                      • Net debt consists of liabilities to banks, bonds, interest bearing financial liabilities from cash-pooling towards related parties and leasing liabilities less cash and cash
  Net Debt
                         equivalents and less interest-bearing financial receivables from cash-pooling from related parties

 Production
                      • Production costs include G&A allocation but exclude export and processing tariffs, finance items and R&D
    costs

     TRIR             • Total Recordable Incident Rate per million hours worked

NOTE:
CERTAIN NUMERICAL FIGURES AND PERCENTAGES SET OUT IN THIS PRESENTATION HAVE BEEN SUBJECT TO ROUNDING ADJUSTMENTS.

                                                                                                                    PAGE 19
You can also read