SEVAN MARINE ASA SECOND QUARTER AND FIRST HALF 2018 - OSLO, 10 JULY 2018 REESE MCNEEL, CEO / CFO
←
→
Page content transcription
If your browser does not render page correctly, please read the page content below
Sevan Marine ASA

  Second quarter and
    first half 2018

                Oslo, 10 July 2018

         Reese McNeel, CEO / CFO

 1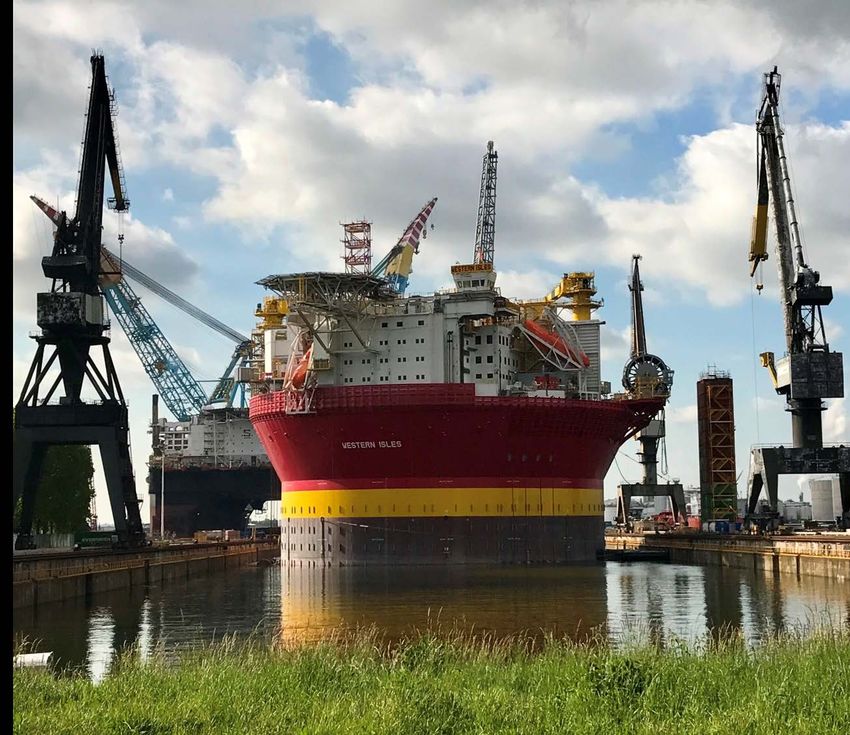
Important information
This presentation and its enclosures and appendices (hereinafter jointly referred to as the “presentation”) have been prepared by Sevan Marine ASA (”Sevan” or
the ”Company”) exclusively for information purposes. This presentation has not been reviewed or registered with any public authority or stock exchange.
Recipients of this presentation may not reproduce, redistribute or pass on, in whole or in part, the presentation to any other person.

The contents of this presentation are not to be construed as legal, business, investment or tax advice. Each recipient should consult with its own legal, business,
investment and tax adviser as to legal, business, investment and tax advice.

There may have been changes in matters which affect the company subsequent to the date of this presentation. Neither the issue nor delivery of this
presentation shall under any circumstance create any implication that the information contained herein is correct as of any time subsequent to the date hereof or
that the affairs of the company have not since changed, and the company does not intend, and does not assume any obligation, to update or correct any
information included in this presentation.

This presentation includes and is based on, among other things, forward-looking information and statements. Such forward-looking information and statements
are based on the current expectations, estimates and projections of Sevan or assumptions based on information available to the company. Such forward-looking
information and statements reflect current views with respect to future events and are subject to risks, uncertainties and assumptions. Sevan cannot give any
assurance as to the correctness of such information and statements.

An investment in the company should be considered as an high-risk investment, and several factors could cause the actual results, performance or
achievements of the company to be materially different from any future results, performance or achievements that may be expressed or implied by statements
and information in this presentation, including, among others, risks or uncertainties associated with the company's business, segments, development,
management, financing, market acceptance and relations with customers, ability to implement cost reducing initiatives, the company's technology and offshore
unit design, latent risks associated with divested businesses (including Teekay's / Logitel's ability to develop the accommodation business unit and repay the
USD 60 million convertible loan in full), and, more generally, general economic and business conditions, including, but not limited to, within the oil and gas
industry, changes in domestic and foreign laws and regulations, taxes, customs duties, vat or variations thereof, changes in competition and pricing
environments, fluctuations in currency exchange rates and interest rates and other factors. Should one or more of these risks or uncertainties materialise, or
should underlying assumptions prove incorrect, actual results may vary materially from those described in this document. The company does not intend, and
does not assume any obligation, to update or correct the information included in this presentation.

This presentation does not constitute or form a part of, and should not be construed as, an offer or invitation to subscribe for or purchase any securities of the
company. Neither this presentation nor anything contained herein shall form the basis of, or be relied on in connection with, any potential transaction referred to
in this presentation. Any potential offer of securities of the company would be based on a prospectus prepared for that purpose.

This presentation is subject to Norwegian law, and any dispute arising in respect of this presentation is subject to the exclusive jurisdiction of Norwegian courts.

2
SembCorp and Teekay transactions
    • Agreement to sell intellectual property, shares in HiLoad LNG AS and to transfer certain other assets and
      obligations, including employees, to SembCorp Marine Integrated Yard Pte Ltd (“SCM”) for USD 39 million

    • Sevan Marine will retain its net cash position, the Dana Western Isles license agreement and the financial
      benefit of the Shell Penguins license agreement

    • Teekay agrees to offer its 43.5 percent shareholding in Sevan Marine to all other shareholders in Sevan
      Marine on a pro rata basis for a price of NOK 10 per share, subject to adjustment for any distributions from
      Sevan Marine until completion of the offer (the “Teekay Offer”)

    • Upon completion of the Teekay Offer, Sevan Marine has agreed to withdraw the lawsuit against Logitel
      Offshore Pte Ltd. The completion of the Teekay Offer is subject to the following key conditions: (i) required
      corporate approvals; (ii) closing of the SCM transaction; (iii) the subscription of all Teekay's shares in Sevan
      Marine; and (iv) regulatory approvals

    • Until the earlier of (i) December 1, 2018 and (ii) close of the offer period for Teekay's shares, Sevan Marine
      has agreed defer all distributions to its shareholders including agreed share capital reductions of NOK 2.5 per
      share and any interim dividends to be agreed

    • Please refer to press releases from June 08, 2018, June 12, 2018 and July 06, 2018 for further details

    • It is expected that the SCM transaction will complete in Q3 2018 and the Teekay Offer in Q4 2018

                                                                                                                   3
3
Financial reporting and revenue
• In accordance with IFRS, the remaining Sevan Marine business is
reported as continued operations while the disposed business is
reported as discontinued operations from Q2 2018
• Revenue in continued operations:
• Overall decrease due to Shell Penguins license income of NOK 20.7
million in Q1 2018
• Increase in Dana Western Isles income to NOK 15.0 million in Q2 2018
versus NOK 6.8 million in Q1
• Increased engineering service revenue, discontinued operations, in
Q2 2018 of NOK 7.9 million versus NOK 3.4 million in Q1 2018 due
to increased activity for Shell Penguins, Dana and Teekay
4EBITDA
• Continued operations reported EBITDA of NOK 4.9 million
impacted by one-off items including:
• Legal fees of NOK 0.6 million related to dismissed Brazil matter and
patent infringement case which will be terminated with SembCorp
transaction
• SembCorp related transaction costs of NOK 5.8 million which includes
legal and advisor fees as well as transaction bonuses
• EBITDA for discontinued operations improved to negative NOK 6.3
million in Q2 2018 versus negative NOK 9.2 million in Q1 2018 due
to increased engineering activity in the quarter
• Continued operations EBITDA going forward driven by:
• License income from Dana Western Isles
• Costs to complete transactions and remaining operating costs
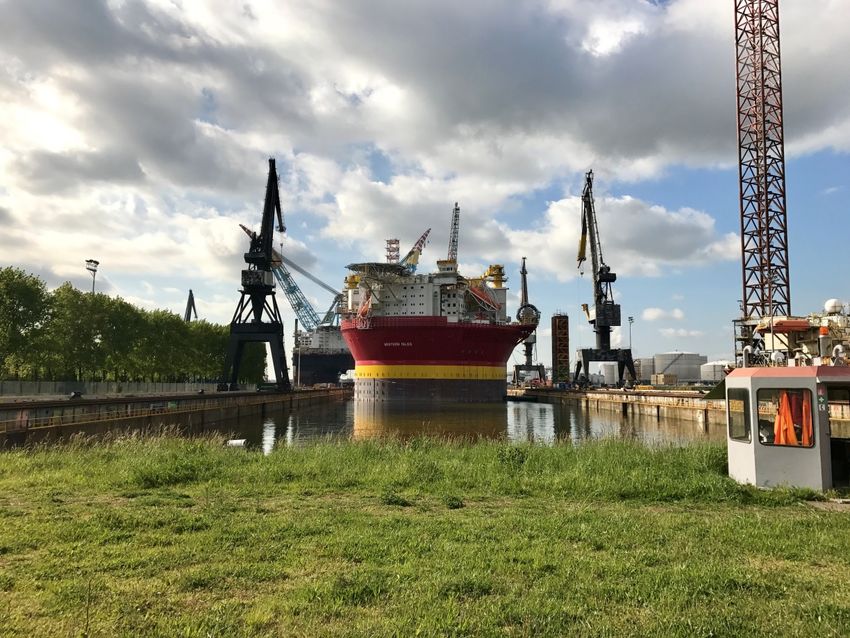
5Western Isles field
• Start-up of production in Q4 2017
• Sevan Marine receiving USD 0.5 per produced
barrel offloaded
• Income in Q2 2018 of NOK 15.0 million versus NOK
6.8 million in Q1 2018
• Capacity production of some 40,000 barrels per day
reached in April 2018
• Sevan Marine has hedged USD 2.75 million at an
average FX rate of NOK/USD 7.85 through
December 2018. A further USD 1.4 million is hedged
at an average FX rate of NOK/USD 7.90 from
January 2019 to April 2019
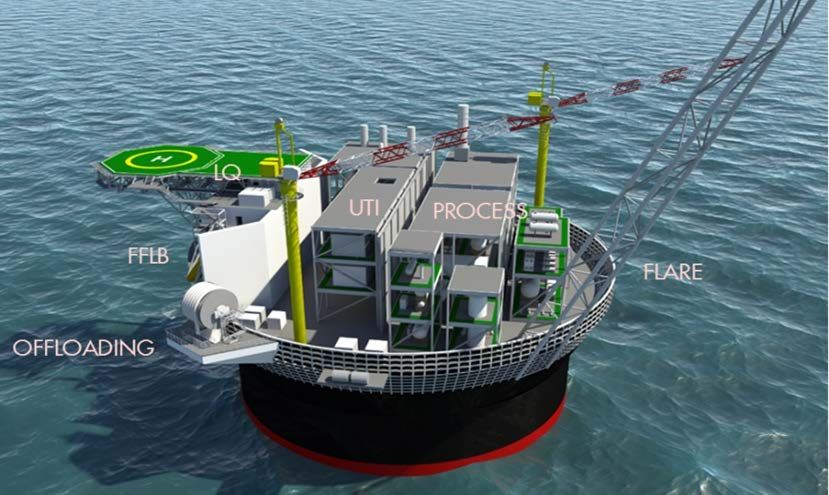
6Shell Penguins redevelopment
• Final investment decision taken in January 2018
• Sevan Marine has invoiced and received the first
milestone payment of USD 2.625 million under the
license agreement in Q1 2018
• Further payment milestones are (i) completion of the
unit,(ii) start-up and (iii) successful production
• Outstanding milestones are expected over coming 3
to 5 years with total nominal value of USD 16 million
7Outlook
• The SembCorp transaction gives the Sevan Marine cylindrical design a strong industrial partner to
further develop and commercialize the concept while realizing value for shareholders today
• Combined with the Teekay transaction, Sevan Marine will resolve all material legacy issues while
providing shareholders with a cash generating, stock exchange listed platform for future growth
• Operating costs for continued operations will decline with the resolution of all material one-off issues,
the completion of the transactions and the transfer of employees and operational costs to SembCorp
• Western Isles is expected to remain near peak production for the coming months
• The SembCorp transaction is expected to be completed in Q3 2018 and the Teekay transaction in Q4
8
8Appendix 9
Profit & loss statement (as reported)
NOK million                                  Note      Q2 18   Q1 18 30.06.2018   Q2 17 30.06.2017   2017

Continued operations
Operating revenue                              4        15.0    27.5       42.4     0.0        0.0     3.2
Operating expense                                      -10.1    -6.0      -16.1    -6.7      -15.0   -38.3
EBITDA                                                   4.9    21.4       26.3    -6.7      -15.0   -35.1

Depreciation, amortization and impairment                0.0     0.0        0.0     0.0        0.0     0.0
Operating profit/(loss)                                  4.9    21.4       26.3    -6.7      -15.0   -35.1
                                                    Please update
Financial income/(expense)                               0.9     0.8        1.7     2.8       10.1   11.6
FX gain/(loss)                                 7        -0.5     0.4       -0.1    -1.8       -3.8   -3.5
Net financial item s                                     0.4     1.2        1.6     1.0        6.3    8.1

Profit/(loss) before tax                                 5.4    22.6       27.9    -5.7       -8.7   -27.0

Tax income/(expense)                                     0.0     0.0        0.0    39.3       39.3   32.8
Net profit/(loss) continued operations                   5.4    22.6       27.9    33.5       30.5    5.7

Discontinued operations
Disposed group classified as held for sale     5        -6.7    -9.8      -16.4   -14.3      -25.8   -39.6
Net profit/(loss) discontinued operations               -6.7    -9.8      -16.4   -14.3      -25.8   -39.6

Net profit/(loss)                                       -1.3    12.8       11.5    19.2        4.7   -33.8

10
Balance sheet (as reported) NOK million Note 30.06.18 31.03.18 30.06.17 31.12.17 Fixed assets 0.0 0.1 0.3 0.1 Intangible assets 0.0 3.9 5.1 4.3 Other non-current assets 3 0.0 3.2 45.5 3.2 Total non-current assets 0.0 7.2 50.9 7.6 Trade and other receivables 3 16.1 11.8 19.6 16.1 Cash and cash equivalents 205.7 208.7 179.1 197.5 Total current assets 221.8 220.5 198.7 213.6 Assets held for sale 5 7.6 Total assets 229.4 227.7 249.6 221.2 Share capital 2 210.4 210.4 210.4 210.4 Other equity -14.6 -14.5 13.0 -26.7 Total shareholders' equity 195.9 196.0 223.4 183.7 Non-controlling interest 0.2 0.2 0.3 0.3 Total equity 196.0 196.2 223.7 184.0 Retirement benefit obligations 0.0 0.0 4.2 0.0 Other non-current liabilities 0.0 2.2 0.0 2.3 Total non current liabilities 0.0 2.2 4.2 2.3 Current liabilities 7 26.1 29.4 21.7 34.9 Total current liabilities 26.1 29.4 21.7 34.9 Total liabilities 26.1 31.5 25.9 37.1 Liabilities held for sale 5 7.3 Total equity and liabilities 229.4 227.7 249.6 221.2 11
Cash flow statement (as reported)
NOK million                                                 Q2 18   Q1 18   30.06.2018   30.06.2017   2017

Cash flow s from operating activities
Cash from operations                                          8.2    17.9         26.1        -52.2   -27.2
Taxes paid/repaid                                             0.0     0.0          0.0         31.7    31.7
Net cash generated from continued operating activi            8.2    17.9         26.1        -20.5     4.5
Net cash generated from discontinued operating activities   -11.1    -6.6        -17.7          9.4     2.6
Net cash generated from operating activities                 -2.9    11.2          8.4        -11.1     7.1

Cash flow s from investm ent activities
Sale of shares KANFA AS                                       0.0     0.0          0.0          0.9     0.9
Sale of fixed assets                                          0.0     0.0          0.0          0.0     0.0
Net cash from continued investm ent activities                0.0     0.0          0.0          0.9     0.9
Net cash from discontinued investment activities *            0.0     0.0          0.0        -36.5   -36.4
Net cash from investm ent activities                          0.0     0.0          0.0        -35.6   -35.5

Cash flow s from financing activities
Dividends paid                                                0.0     0.0          0.0          0.0     0.0
Net cash from continued financing activities                  0.0     0.0          0.0          0.0     0.0
Net cash from discontinued financing activities               0.0     0.0          0.0          0.0     0.0
Net cash from financing activities                            0.0     0.0          0.0          0.0     0.0

Net cash flow for the period - continued activities           8.2    17.9         26.1        -19.7     5.4
Net cash flow for the period - discontinued activities      -11.1    -6.6        -17.7        -27.1   -33.8

Cash balance at beginning of period                         208.7   197.5       197.5        225.9    225.9
Cash balance at end of period                               205.9   208.7       205.9        179.1    197.5

12
You can also read