Managing Member: Nick Tompkins - Owner: Dana Reserve LLC - Nipomo Community Services District
←
→
Page content transcription
If your browser does not render page correctly, please read the page content below
Owner: Dana Reserve LLC
Managing Member: Nick Tompkins
Owner History

The Dana Reserve is committed to ensuring that current
rate payers of the Nipomo Community Service District
(NCSD) will benefit from the project in a quantifiable and
meaningful manner.
Property History
Part of the original Rancho Nipomo land grant, the
Dana Reserve was sold by Captain Dana’s daughter
to the Canada family in 1911.

The Dana Reserve LLC acquired fee interest in 2017
and 2018 through multiple fractional interest
purchases.

In 2020 the Dana Reserve LLC acquired fee interest
in a Nipomo Ranch, which will be permanently
conserved and made available to the public through
docent led hikes.

Dana Reserve LLC is pleased to now present our
project to NCSD for consideration.
                                                     William Goodwin Dana (Captain Dana)
Work Completed Thus Far
                The following planning and review has
                          been completed:
            -   Archeological Study
            -   Soils Study
            -   Noise Study
            -   Traffic Study
            -   Water Supply Assessment
            -   Survey Including Topography
            -   Endangered Species and Plants Report
            -   Three Biological Surveys
            -   Draft Specific Plan
            -   Draft VTTM
            -   Area and Neighborhood Circulation Plan
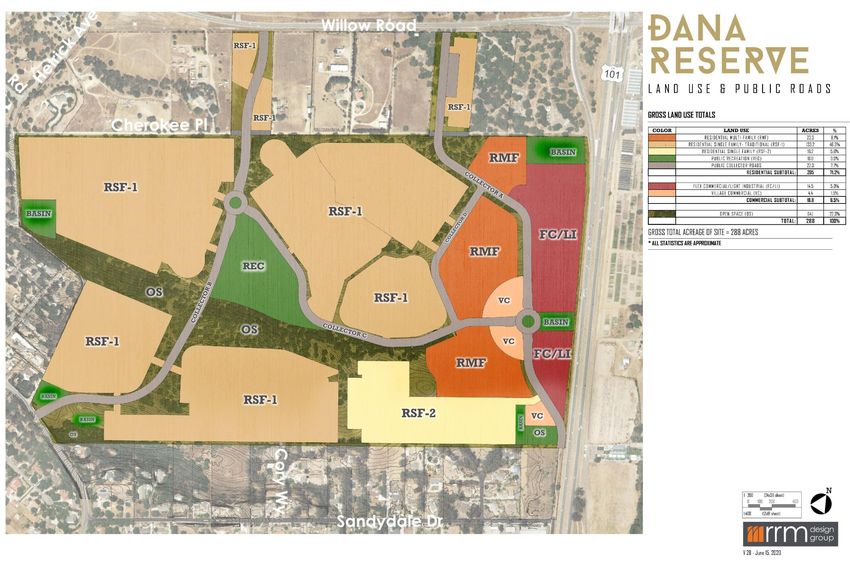
TheDana
                                                              The  Dana  Reserve
                                                                       Reserve
                                                               NCSDService
                                                              NCSD   Service Area
                                                                           Area
                                                               NCSDSphere
                                                              NCSD   Sphere   of Influence
                                                                          of Influence

                                                                                             NCSD Service Area and
                                                                                             Sphere of Influence
Willow Rd.
                               Willow Rd.

                 Pomeroy Rd.
                                                Pomeroy Rd.

             Mesa Rd.

                                            Mesa Rd.
Conservation Property
Conservation Property
Conservation Property
Conservation Property
Conservation Property
The Dana Reserve is committed to ensuring that current
rate payers of the Nipomo Community Service District
(NCSD) will benefit from the project in a quantifiable
and meaningful manner.
Laurie Tamura
County of San Luis Obispo                                             LAFCo                                                     NCSD
                  Planning Department
Submit Application to County                               Request Study Session to LAFCo                            Annexation Application to NCSD
                                              June 2020                                                  June 2020                                                  June 2020
30-day review                                                                                                        Board action on reimbursement agreement
                                               July 2020                                                                                                             July 2020
Submit additional information                                                                                        Engineering study starts
                                            August 2020                                                                                                              July 2020
Notice of intent for EIR                                                                                             Financial Study Starts
Request for Proposal
                                            August 2020                                                                                                              July 2020
Contract for EIR                                           Study Session to LAFCo                                    Complete Financial Study
                                       September 2020                                              September 2020                                                October 2020
Draft EIR for Public Review                                Study Session to LAFCO on Draft EIR                     Engineering study competed
                                            January 2021                                              January 2021 Forwarded to County for EIR review
                                                                                                                                                                 January 2021
45-day review period                                                                                                 Respond to Draft EIR with Comments
                                             March 2021                                                                                                           March 2021
Response to comments
                                              April 2021
Public Hearing Draft EIR
Staff report for Planning Commission
                                              May 2021
Planning Commission Hearing
                                              June 2021
Board of Supervisors Certified EIR                    Formal Annexation Application to LAFCo with Certified EIR
                                            August 2021                                                 August 2021
Negotiate Terms for Annexation                        Negotiate Terms for Annexation                                Negotiate Terms for Annexation
                                       September 2021                                              September 2021                                              September 2021
Board Hearing on Final Terms                                                                                        NCSD Board Meeting on Final Terms
                                       November 2021                                                                                                           November 2021
                                                      LAFCO Board Hearing
                                                                                                    December 2021
Rick Sweet. PE
The The
                                   DanaDanaReserve
                                            Reserve
                                   NCSD Service Area
                               NCSD Service Area
                                   NCSD Sphere of Influence
                               NCSD Sphere ofInfluence

Willow Rd.

                 Pomeroy Rd.

             Mesa Rd.
                                                              Water Availability
                                                              Analysis Presented by Rick Sweet for the Dana Reserve Project
Water Availability – Dana Reserve Project Usage Type of Useage Units Gal/unit-day Acreage Water Demand (AF/Y) Residential Condominiums 173 114 22.09 Townhomes 210 129 30.34 Cluster 124 186 25.83 Small Lot SFR (Lot size< 5,000 sq. ft.) 463 186 96.46 Medium Lot SFR (Lot size > 5,000 and < 7,000) 225 300 75.61 Multifamily 75 129 10.84 Total Residential 261.18 Commercial Building 1/3 0.136 AF/1000 sq ft 6.3 37.32 Landscaping 1/3 1 AF/Acre 6.3 6.30 Parking 0 6.3 0.00 Total Commercial 18.9 43.62 Public Public Park 1 10 10 Neighborhood Parks 1 15 15 Streetscape/Parkways 1 6.5 6.5 Total Public 31.5 Grand Subtotal Residential 261.18 Commercial 43.62 Public 31.5 Subtotal 336.31 10% Contingency 33.63 Total 369.94
Water Availability – Groundwater Pumping at Stipulation Levels
       Category                                             Water Usage

       Imported Water Quantity                              950 AF

       Groundwater Produced                                 950 AF

       Total Water Use                                      1,900 AF
                                                                           Water Available to Serve
       Ground Water Allowed by Stipulation Scenario          Water Usage
                                                                                  SOI Areas           1,205 AF
       Minimum Delivery of NSWP in 2025                      1,668 AF      Project Water Demand

       Groundwater Allowed by Stipulation                    1,267 AF
                                                                               Including 10%          370 AF
                                                                                Contingency

       Additional NSWP Available                             500 AF
                                                                               Project Demand
       Total Water Available                                 3,435 AF         w/Recycled Water
                                                                                                      336 AF
       Total 2019 Water Use                                  1,900 AF

       Water Available Beyond Present Use                    1,535 AF

       Amount of Water Required to Serve Remaining Infill    330 AF

       Water Available to Serve SOI Areas                   1,205 AF
Water Availability – Minimum Groundwater Pumping Scenario
Category Water Usage
Imported Water Quantity 950 AF
Groundwater Produced 950 AF
Total Water Use 1,900 AF Water Available to Serve
SOI Areas 538 AF
Minimum Groundwater Pumping Scenario Water Usage
Project Water Demand
Minimum Delivery of NSWP in 2025 1,668 AF
Including 10% 370 AF
Contingency
Minimum Groundwater Pumping to Maintain System 600 AF
Additional NSWP Available 500 AF Project Demand
w/Recycled Water
336 AF
Total Water Available 2,768 AF
Total Water Use 1,900 AF
Water Available Beyond Present Use 868 AF
Amount of Water Required to Serve Remaining Infill 330 AF
Water Available to Serve SOI Areas 538 AFFinancial Impact Water Connection Fees Sewer Connection Fees Water Use Fees Sewer Use Fees
Financial Impact

Water Connection Fees                              Sewer Connection Fees
The Dana Reserve Project anticipates the           The Dana Reserve Project anticipates 1,186 new
installation of 1,186 new water meters over a 7-   sewer line connections over a 7-year timeline
year timeline generating approximately $17.5       generating approximately $14.2 million in
million in fees.                                   connection fees.

Water Use Fees                                     Sewer Use Fees
The Dana Reserve Project anticipates the annual    The Dana Reserve Project anticipates the annual
water use revenue to be over $2.8 million upon     sewer use revenue to be over $1.1 million upon
project completion.                                project completion.
Water Connection Fees
How Water Connection Fees Were Calculated:                                                                              Cumulative Water Connection Fees
                                                                                 $20,000,000
 Step 1    Utilized past Water Meter Installation data to calculate historical
           cost, YoY percentage increases, and expense trends                                                                                                                         $17,520,000
                                                                                 $18,000,000

           Extrapolated 2020 Water Meter Installation fees to establish a                                                                                               $16,074,000
 Step 2    baseline
                                                                                 $16,000,000

           Grew 2020 baseline by growth rate implied by historical YoY           $14,000,000                                                              $13,053,000
 Step 3    percentage increases and expense trends (3.0%) through 2029
                                                                                 $12,000,000
                                                                                                                                            $10,089,000                               $12,642,000
 Step 4    Mapped construction timing to a monthly level                         $10,000,000                                                                            $11,599,000

                                                                                  $8,000,000                                   $6,993,000                  $9,419,000
           Multiplied the number of anticipated water meters needed by
 Step 5    the corresponding anticipated fee for each specific month                                                                         $7,280,000
                                                                                  $6,000,000
                                                                                                $1,229,000    $4,072,000
 Step 6    Compiled fees to match project’s fiscal year schedule                  $4,000,000
                                                                                                                               $5,046,000
                                                                                                                  $2,938,000
                                                                                                                                                                                       $4,878,000
                                                                                  $2,000,000$887,000   $342,000                                            $3,634,000
                                                                                                                                                                         $4,475,000
                                                                                                                  $1,134,000                 $2,809,000
                                                                                                                               $1,947,000
                                                                                         $-
                                                                                                FY 2022-23        FY 2023-24   FY 2024-25    FY 2025-26    FY 2026-27    FY 2027-28    FY 2028-29
                                                                                                                  District Connection Fee      SWP Connection Fee

                                                                                      Total Water Meter Installation Revenue for NCSD: $17,520,000
Water Use Revenue Annual Gross Revenue from Bi-Monthly Fees
How Water Fees Were Calculated:
$2,867,000
Utilized 2017 Tuckfield Rate Study to establish baseline water rates $3,000,000
Step 1 $2,505,000
$2,500,000
$2,000,000
Grew Tuckfield baseline by growth rate of 5.0% through 2029
Step 2 $2,000,000
$1,414,000
$1,500,000
Multiplied the number of anticipated occupied homes by the $993,000
Step 3 corresponding anticipated rate for that time period $1,000,000
$547,000
$500,000 $148,000
Step 4 Multiplied Tuckfield Rate by 1.5x to reflect Dana Reserve’s
exclusive use of NSWP water $-
FY 2022-23 FY 2023-24 FY 2024-25 FY 2025-26 FY 2026-27 FY 2027-28 FY 2028-29
Compiled bi-monthly payments to match project’s fiscal
Step 5 schedule Annual Net Revenue from Bi-Monthly Fees
Reduced revenue by cost for NSWP Water required to serve $1,940,000
Step 6 the project, resulting in revenue available after cost of water $2,000,000
$1,691,000
for NCSD $1,800,000
$1,600,000 $1,344,000
$1,400,000
$1,200,000 $959,000
$1,000,000
$668,000
$800,000
$600,000 $370,000
$400,000
$102,000
$200,000
$-
FY 2022-23 FY 2023-24 FY 2024-25 FY 2025-26 FY 2026-27 FY 2027-28 FY 2028-29Sewer Connection Fees
How Water Connection Fees Were Calculated: Cumulative Sewer Connection Fees
Step 1 Utilized past Sewer Connection data to calculate historical cost, $16,000,000
percentage increases, and expense trends
$14,239,000
Extrapolated 2020 Sewer Capacity fees to establish a baseline
Step 2 $14,000,000 $13,064,000
Grew 2020 baseline by growth rate implied by historical $12,000,000
Step 3 percentage increases and expense trends (3.0%) through 2029 $10,608,000
$10,000,000
Step 4 Mapped construction timing to a monthly level
$8,199,000
$8,000,000
Multiplied the number of anticipated sewer connections needed
Step 5 by the corresponding anticipated fee for each specific month $5,683,000
$6,000,000
Step 6 Compiled fees to match project’s fiscal year schedule
$4,000,000 $3,309,000
$2,000,000 $999,000
$-
FY 2022-23 FY 2023-24 FY 2024-25 FY 2025-26 FY 2026-27 FY 2027-28 FY 2028-29
Total Water Meter Installation Revenue for NCSD: $14,239,000Sewer Use Revenue
How Bi-Monthly Sewer Fees Were Calculated: Revenue from Sewer Bi-Monthly Fees
Step 1 Extrapolated proposed 2019 rate from 2015 NCSD Rate Study to $1,200,000
establish a baseline household expense $1,096,000
Grew baseline by 5% for two years to adjust for structural
Step 2 revenue shortfall $975,000
$1,000,000
Grew baseline by 3% thereafter to reflect annual inflationary
Step 3 demand
$791,000
$800,000
Multiplied the number of anticipated occupied homes and commercial
Step 4 usage by the corresponding anticipated rates for that time period
Compiled bi-monthly payments to match project’s fiscal $573,000
Step 5 schedule $600,000
$409,000
$400,000
$230,000
$200,000
$64,000
$-
FY 2022-23 FY 2023-24 FY 2024-25 FY 2025-26 FY 2026-27 FY 2027-28 FY 2028-29Financial Impact Summary – Cumulative Connection Fees
Cumulative Connection Fees
$35,000,000
$31,761,000
$30,000,000
$29,140,000
$25,000,000 $23,662,000 $14,239,000
$13,064,000
$20,000,000 $18,289,000
$10,608,000
$15,000,000
$12,676,000 $8,199,000
$10,000,000 $5,683,000
$7,381,000 $17,522,000
$16,076,000
$13,054,000
$5,000,000
$2,228,000 $3,309,000
$10,090,000
$999,000 $6,993,000
$1,229,000 $4,072,000
$-
FY 2022-23 FY 2023-24 FY 2024-25 FY 2025-26 FY 2026-27 FY 2027-28 FY 2028-29
Cumulative Water Connection Cumulative Sewer ConnectionFinancial Impact Summary – Water, Sewer Revenue
Bi-Monthly Revenue
$3,500,000
$3,036,000
$3,000,000
$2,666,000
$2,500,000 $1,096,000
$2,135,000
$975,000
$2,000,000
$1,532,000 $791,000
$1,500,000
$1,077,000 $573,000
$1,000,000
$1,940,000
$409,000 $1,691,000
$600,000
$1,344,000
$500,000 $230,000 $959,000
$166,000
$668,000
$64,000 $370,000
$102,000
$-
FY 2022-23 FY 2023-24 FY 2024-25 FY 2025-26 FY 2026-27 FY 2027-28 FY 2028-29
Net Bi-Monthly Water Bi-Monthly SewerNCSD Current and Upcoming Financial Obligations
Water Contract Supplemental Water Water Facilities Debt Wastewater Debt
Beginning in fiscal year 2025-26, NCSD Project Debt The District financed pipeline and In 2012, the District funded a sewer plant
is contractually required to increase the storage facilities in 2003. The District expansion and upgrade that would meet
To facilitate the transfer of the imported
purchase of water from Santa Maria by currently holds a debt of $2.2 million, the needs of the community and
water, the District designed, engineered,
an additional 700 acre-feet over 2019 maturing in 2032, which has an annual anticipated flows from new projects. The
and installed a pipeline and pumping
levels with minimum purchase amount debt service of $225,000. sewer facility was funded by an additional
system at a cost of approximately $24
increasing to 1,668 acre-feet. The bond, maturing in 2042, which has an
million. To fund these improvements, the
NCSD has the right to purchase and outstanding balance of $8.5 million and
NCSD financed the project with a
deliver from Santa Maria an additional an annual debt service of $600,000. The
Certificates of Participations (COPs) that
500 acre-feet annually more than the sewer facility has substantial available
matures in 2043. The District’s remaining
minimum contracted amount. The cost capacity to process increased volume over
debt from this project is $8.8 million. The
of the imported water is and above current levels.
annual debt service for this debt is
approximately 3.5 times the historical
approximately $530,000.
cost of groundwater that NCSD has
provided.
Total Obligations:
Water Contract: A minimum of 700 acre-feet over 2019 levels
at a rate approximately 3.5 times the historical cost of
groundwater that NCSD has provided.
Total Debt: An estimated debt service of $1,355,000.How Will the Dana Reserve Help the NCSD and Its Customers?
Water Debt Benefit Wastewater Debt Benefit Water Use Fee Benefit Sewer Use Fee Benefit
Over the Dana Reserve Project’s anticipated 7 Over the Dana Reserve Project’s anticipated 7 Due to the Dana Reserve Project’s exclusive use The Dana Reserve Project’s wastewater demand
year construction period, the District will year construction period, the District will of imported water, the Dana Reserve will be is well within the existing system’s capacity. Due
receive $17.5 million in connection fees for receive $14 million in connection fees for charged for water at roughly 1.5 times the rate to this, operating revenues for the Town Sewer
water service. wastewater service. of other customers within the District. System stand to benefit immensely from the
Approximately $12.6 million of these fees are All $14 million of these fees are available to pay project.
available to pay off the $8.8 million in debt from This will allow the Dana Reserve to absorb a
off the remaining $8.5 million in debt from the significant amount of the increased expense Upon completion and stabilization, the Dana
the import pipeline and pumping system and Sewer Plant Expansion Reserve Project will generate $1.1 million in
the $2.3 million in debt for the storage facilities associated with the minimum water imported
from Santa Maria beginning fiscal year 2025- revenue, a 50% increase over present revenues.
($11.1 million in total debt available for pay If the District elects to pay off this debt:
down). 2026.
- $600,000 in annual debt service, payable
If the District elects to pay off this debt: every year through 2042, would be After analyzing revenue and expenditures, and
- $530,000 in annual debt service for the eliminated. allowing for a growth in both imported water
import pipeline and pumping system, costs and water charges by the District of 5%,
payable every year through 2043, would be The $600,000 in savings can be utilized to water revenues, after the cost of the imported
eliminated. absorb future operating costs to the benefit of water to serve the Dana Reserve has been paid,
- $225,000 in annual debt service for the current rate payers. from the Dana Reserve Project will exceed $1.9
water storage facilities, payable every year million annually.
through 2032, would be eliminated.
The $755,000 in savings can be utilized to
absorb future operating costs to the benefit of
rate payers.
Water Debt Benefit Wastewater Debt Benefit Bi-Monthly Water Fee Benefit Bi-Monthly Sewer Fee Benefit
$755,000 $600,000 $1.9 Million $1.1 Million
Available to absorb future Available to absorb future Available to absorb future Available to absorb future
operating costs for the benefit of operating costs for the benefit of operating costs for the benefit of operating costs for the benefit of
all rate payers. all rate payers. all rate payers. all rate payers.
TOTAL ANNUAL BENEFIT AVAILABLE TO ABSORB FUTURE OPERATING COSTS TO THE BENEFIT OF THE RATE PAYERS: $4,355,000The Dana Reserve is committed to ensuring that current rate payers of the Nipomo Community Service District (NCSD) will benefit from the project in a quantifiable and meaningful manner
You can also read


