ASIS Software - Q&A Document - April 2021
←
→
Page content transcription
If your browser does not render page correctly, please read the page content below

ASIS Software – Q&A Document

           April 2021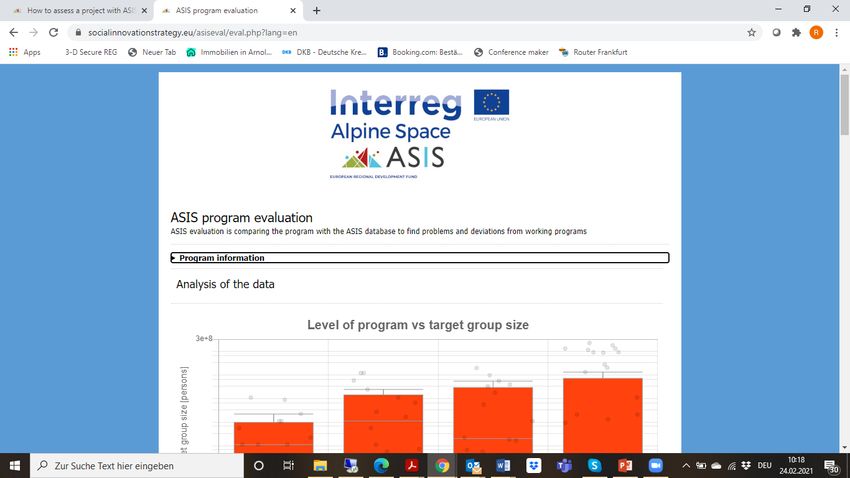
Inhalt
1.         Input............................................................................................................................................................................................................3
     1.1           Country ........................................................................................................................................................................................... 4
     1.2           Level of program ...................................................................................................................................................................... 4
     1.3           Target group size....................................................................................................................................................................... 5
     1.4           Internal individuals involved in the program ......................................................................................................... 5
     1.5           Academic education ............................................................................................................................................................... 5
     1.6           Experienced founders ............................................................................................................................................................6
     1.7           Funding ...........................................................................................................................................................................................6
     1.8           Stakeholders involved ............................................................................................................................................................7
     1.9           Milestones ..................................................................................................................................................................................... 8
2.         Output .......................................................................................................................................................................................................9
     2.1           Interpretation of the Graphs ............................................................................................................................................10

                                                                                                                                                                                                                          2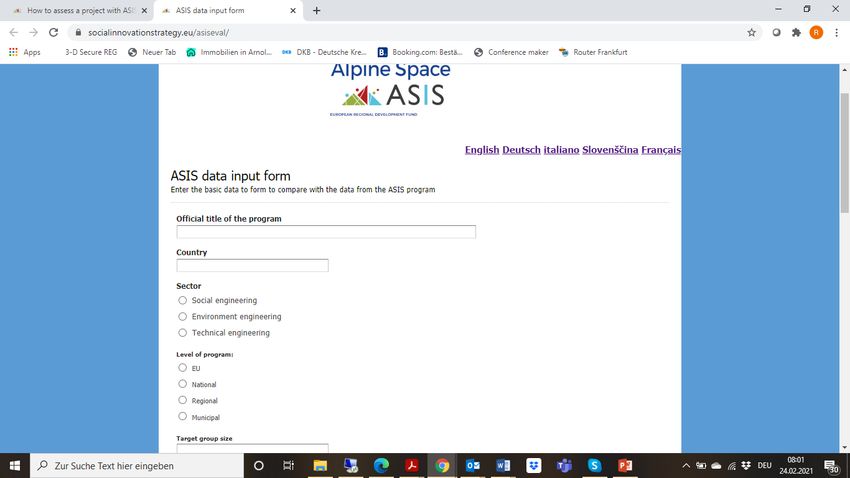
To further ease the use of the software for those individuals that will work with the

software on a daily basis, being in charge also to interpret the results, beyond the

training videos and the handbooks, the following Q&As provide users with

additional information regarding the needed input information and the output and

its interpretation.

   1. Input

The page appears as follows, you may scroll down to see all boxes.

All fields must be filled in. Numerical information must be entered as an integer

without a point or comma. If the mouse pointer is over an input element, a gray box

                                                                                   3
with help for input is displayed to the right of the input. For each question/box, the

following inputs are requested:

   1.1 Country

This information refers to the country the project is (mainly) active in, or in the case

of consortia or multinational companies, the headquarter or the basis of the project

coordinator. As this information is only used in a limited way later on, it does not

matter if it is not possible to have a clear-cut entry here.

   1.2 Level of program

Answer options: EU, National, Regional or Municipal

This point refers to the level the project is situated – will it be (mainly) active on the

EU level, the national level, the regional level, or the municipal level? Please tick the

box that is most close to the level where the project or its main components are

rooted – e.g. if it is a large national project with some municipal components, please

tick “national”; if it is a municipal project with one actor from another EU country,

tick “municipal”.

                                                                                        4
1.3 Target group size
Direct beneficiaries and indirect ones should be considered (e.g. if you have a train-
the-trainer activity, you include the directly trained individuals, but also the
beneficiaries from additional trainings if you have any information about the
respective numbers).
1.4 Internal individuals involved in the program
"Internal individuals" refers to internally involved persons that work on the project,
being it volunteers or employees. Thus, e.g. if a social enterprise has 10 employees of
whom 5 work on the project, the number to be inserted it “5”, no matter if these 5
individuals are professionals or volunteers.
1.5 Academic education
Answer options: Yes or No
This point refers to the academic education of the founder or the principal
investigator of the consortium (if the evaluated project is a more scientific project).
If the respective person that is mainly responsible for the project has an academic
education, please tick “yes”, if this is not given, “no” should be chosen.
51.6 Experienced founders
Answer options: Yes or No
This point refers to the experience of the founder or the principal investigator (if it is
a more scientific project). If there is a track record of projects, please tick “yes”, if
there is no experience in previous projects, “no” should be chosen.
1.7 Funding
The amount of funding is required here – please enter the amount of money that
has already been granted (if given) to the project, or that was applied for. The
different sources as below can be chosen, with more than one option possible.
EU grants
National grants
Total amount of grants the program get from national funding
Regional grants
Own business activity
Donations
Crowd funding
Private funding
61.8 Stakeholders involved
Please enter for each category the number of stakeholders. E.g. if the project is
planned to work with 3 Universities and 5 NGOs, please add “3” and “5” in the
respective box, and “0” in the other boxes. The following groups/actors can be
chosen – if there are other stakeholder groups involved that do not appear in the
list, please pick the keyword that is as close as possible (e.g. if a school is involved,
please tick “University” as it is an educational institution).
1. Public authorities
2. Universities
3. Business support organizations/cluster/sectorial agencies
4. Private sector -companies (large companies, SMEs, start-ups etc.)
5. Civil society - NGOs, citizens' associations, vulnerable groups etc.
6. Individuals that participate in activities
As for the last point (individuals that participate in activities), please take the
respective information from the proposal of the project. Otherwise, also estimates
are possible – e.g. if the proposed project indicates that all inhabitants of a
municipality are invited to participate, you may get this number from official
documents.
71.9 Milestones
The following milestones can be selected, it is possible to tick more than one
milestone.
Increased number of beneficiaries
Increased number of stakeholders
Improved position to nearest competitor
Public awareness
This indicator asks which kind of milestone is proposed or planned for the evaluated
project/programme. Please tick all boxes that are mentioned by the proposal. If no
milestones are proposed, leave it empty. If other milestones than the mentioned are
named in the project proposal, please chose the option that is most closely. E.g. if
the project proposal mentions “more children should benefit from free training
classes”, please chose “increased number of beneficiaries”.
82. Output
The evaluation page contains the evaluation of the entered data and looks as below.
When you click on the arrow or on the word "Program information", a summary of
the input data is displayed. This is followed by 7 diagrams, which display the
evaluation results of the program to be evaluated compared to the ASIS data.
Finally, a summary of the 7 indicators is displayed.
92.1 Interpretation of the Graphs
The green dot indicates for the evaluated project/programme compared to
the reference group. Its size has no meaning, minor changes of the size of the
dot might occur due to technical reasons.
The orange bars indicate for the distribution of the reference group of projects
analyzed and included in our model. The “middle” of the bar/box indicated for
the median, the orange parts below/above for the 2nd and 3rd quantile, and
the grey horizontal line in the lower or upper part for the 1s or 4th quantile
The green dot can be in the expected range (around the median, 2nd and 3rd
quantile, within the orange bar), in the lower or upper part of the expected
range (1st or 4th quantile) or out of the expected range.
For all indicators 1-5, diagrams are displayed in which the project to be evaluated is
plotted against the “reference group” that was analyzed. As delineated, the orange
areas show quartile 2 and quartile 3. The green point shows where the
program/project to be assessed is located.
The text below the picture is shown follows the “traffic light labelling system” in
green, yellow or red. As outlined, the text appears in green if the program to be
10assessed is in quartile 2 or quartile 3. If it is in quartile 1 or quartile 4, the text is
displayed in yellow. If it is outside the entire comparison area, the text is displayed
in red.
Diagram 6 shows a bar chart, showing the background of the founders (education
and experience). The orange bars indicate for the proportions of the 4 possible
combinations. The green point shows where the program to be evaluated is located.
The text below the picture is shown in green, if the program to be assessed has a
founder that is both, academically trained as well as experienced. This comes as
research demonstrates that the experience of the project leader or founder as well
as the training background plays an important role for the success of SI projects. If
it is a different combination, the text is displayed in yellow. Thus, if there is e.g. no
experience of founders, and no academic training (which is more important for
scientific projects/programmes), an in-depth analysis may be necessary if the
relevant skills are given, or if e.g. additional training activities should be conducted
by the founder of the project to acquire these skills. Thus, this indicator again gives
only a hint to the decision maker if the background of the founder/project leader is
sound enough to conduct the planned project successfully, or to investigate further
if expertise is missing.
11Diagram 7 shows a bar chart, showing the stakeholder structure across the program
types. Civil society NGOs and business-promoting organizations are dominant
stakeholder groups in the environmental sector and social sector. Private sector
companies and business support organizations are dominant stakeholder groups
in the technical area. The circles mark which stakeholders are represented in the
program to be assessed. The text below the picture is shown in green, if the program
to be assessed includes both dominant stakeholders in the respective sector
(technical, environmental, or social). If only one dominant stakeholder is
represented in the project evaluated, the text is shown in yellow. If both dominant
stakeholders are missing, the text is red.
This outcome can be the starting point for an in-depth analysis of the respective
part of the planned project – if the stakeholder groups represented are somewhat
“atypical”, the inclusion of other groups could be discussed with the project leader.
At the end of the evaluation page, a summary of the 7 indicators is displayed. The
summary indicates how many of the indicators are green, yellow or red – which
means, in the expected range, in the upper/lower part of the expected range, or
outside the expected range.
Attention: the traffic light system must not be interpreted as an indication of a
“good” or “bad” rating. The statement of the colors only applies to “typical” or
12“atypical” with regard to comparable programs/projects that are successfully
implemented. The interpretation of results should be done in triangulation with a
more qualitative analysis of the project – in particular if atypical outcomes are
displayed, this may give an important hint to the evaluators that the respective
indicators should be evaluated more deeply.
13You can also read