Toward zero emission - Mov'eo
←
→
Page content transcription
If your browser does not render page correctly, please read the page content below
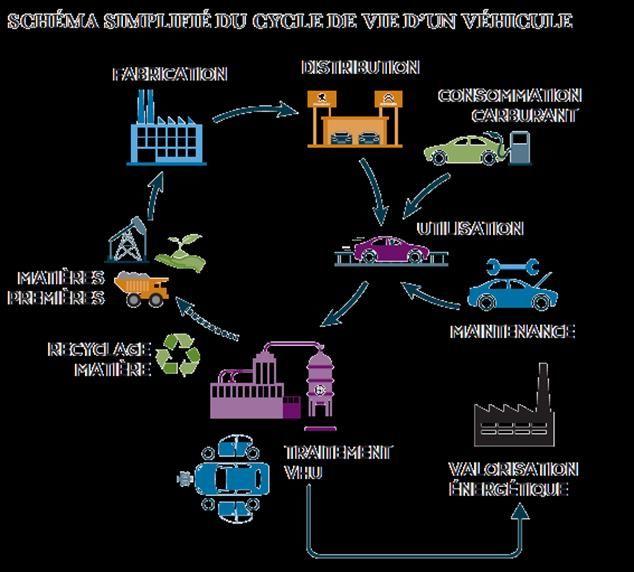
Toward zero emission
France Auto Mobile : Consolidate and develop the players
    from of the industrial automotive sector in France

                                                                4,000 entities
                                                                400,000 jobs

                    Propriété PFA- reproduction interdite   –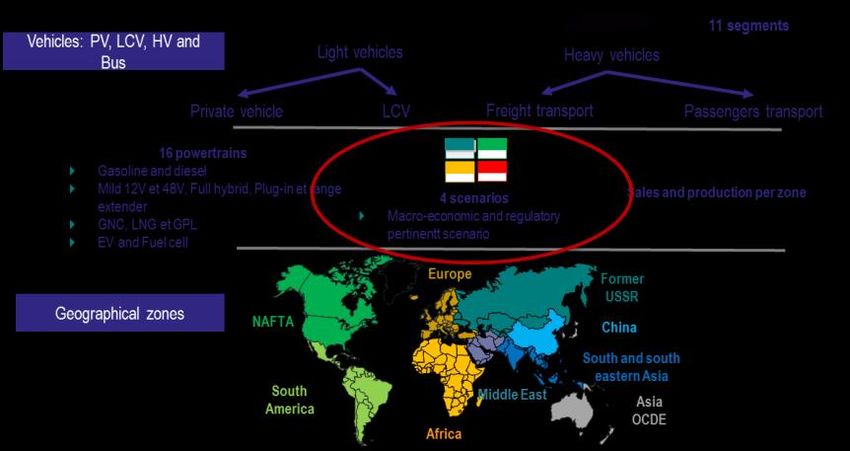
NEW EXPECTATIONS, USAGES AND TRENDS

     A DEEP MUTATION : Impacting the automotiv world                    OUR OBJECTIVE : To supply solutions & vehicles
                                                                              promoter of a sustainable mobility

                        | Une population
                           vieillisante

| La digitalisation         Green              | Une urbanisation        Faible empreinte   Véhicules sûrs et    Mobilité
   des services             Planet                 croissante            environnementale     autonomes         connectée

                                                                                               For ALL
                      | De la propriété vers
                       la mise à disposition

                                               Propriété PFA- reproduction interdite   –
Define a clear vision of the major medium and long term issues of
                               the sector
Automotive Industry Strategic Contract (CSF) 2018-2020
Signed the 22th may 2018

Axis 1: Be a player in the energy and ecological transition

Axis 2: Create the autonomous vehicle ecosystem and
experiment on a large scale, to offer new mobility services

Axis 3: Anticipate the changing needs of skills and jobs

Axis 4: Strengthen the industrial competitivity

                                Propriété PFA- reproduction interdite   –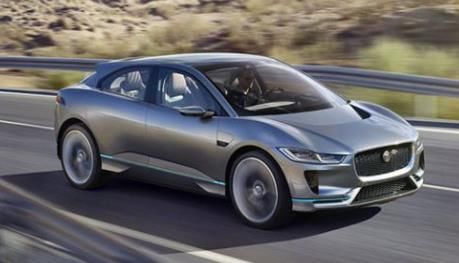
The environmental and technological challenge

The environmental agenda is binding and we
must adapt to it.

The automotive industry invests 6 billion euros
per year in R & D to provide technological
solutions adapted to meet environmental
challenges.

A public / private short-term objective                                 At the strategic contract of the
established in the CSF: to increase fivefold, by                        sector:
2022, the sale of electric vehicles                                     -600,000 VE and 400,000 PHEV
                                                                        -100,000 charging points in 2022

                                Propriété PFA- reproduction interdite   –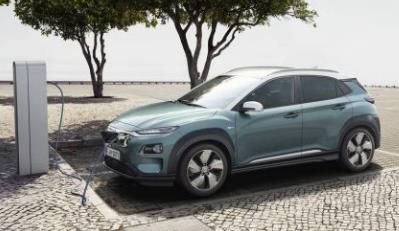
The environmental and technological challenge

The sector communicates each year on powertrains outlook (for the next 15
years), in collaboration with the DBO BIPE, based on documented scenarios on
techno-economic trends in order to define the energy mix of new vehicles.

                                       Deliverables:
                                       Forecasts for fleet volumes, sales, market shares by
                                       type of motorization
                                       Modeling of energy demand & CO2 emissions related
                                       to road transport
                            Propriété PFA- reproduction interdite   –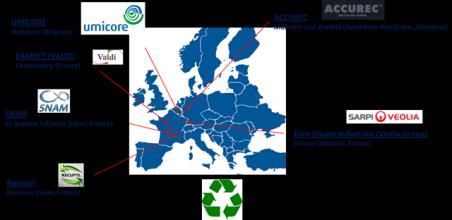
4 scenarios of evolution of the ecosystem of the road transport sector were
                                  modelled

                            Propriété PFA- reproduction interdite   –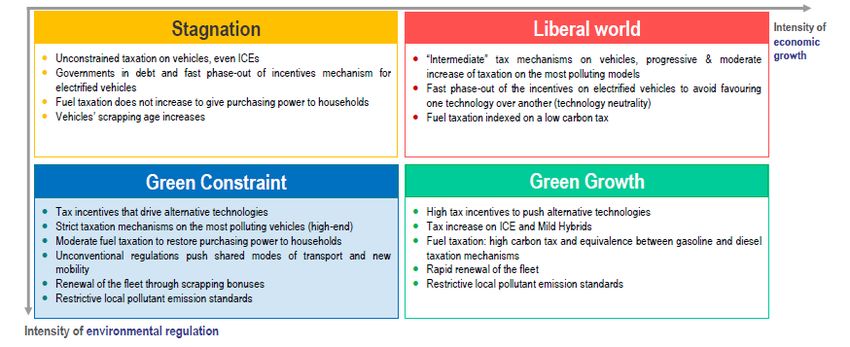
New Light vehicle sales increase from 30 to 55 million units in 2035
                                          compared to 2017

           200
                                            New Market - VL – Worldwide
                                                                       128                     138 150
Millions

           150                                                                  133 124      125       136
                                                                118
                                                                                                             Green Constraint
           100
                                                                                                             Green Growth
            50
                                                                                                             Liberal World
             0                                                                                               Stagnation
                     2017            2020             2025                   2030               2035

            Between 2017 and 2035, the new LV market sees an increase in sales of +25 million vehicles per
            year following the Green Constraint scenario. This increase in sales volumes is located in emerging
            countries (e.g. China, Africa)

                                                 Propriété PFA- reproduction interdite   –
Worldwide, BEVs and PHEVs will represent respectively 12% and 8% of sales
                                in 2035

                                 World – LV powertrain mix evolution for Green Constraint scenario
                                                                                                               Fuel Cell
100%
                                                                                                               EV High Range
 90%
                                                                                                               EV Low Range
 80%                                                                                                           LPG
 70%                                                                                                           CNG
 60%                                                                                                           Diesel PHEV
 50%                                                                                                           Diesel Mild 48V
                                                                                                               Diesel
 40%
                                                                                                               Gasoline EREV
 30%                                                                                                           Gasoline PHEV
 20%                                                                                                           Gasoline Full
 10%                                                                                                           Gasoline Mild 48V
     0%                                                                                                        Gasoline Mild 12V
              2017 2018 2019 2020 2021 2022 2023 2024 2025 2026 2027 2028 2029 2030 2031 2032 2033 2034 2035   Gasoline

 EVs will still be limited by a number of obstacles, including consumers' perception of vehicle
 charging times for certain geographical areas, but these should gradually dissipate by 2035 as a
 result of positive developments in the market. autonomy, charging time, and the cost of batteries
 •        .
                                                         Propriété PFA- reproduction interdite   –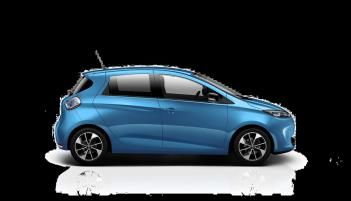
In Europe, BEVs and PHEVs represent respectively 24% and 10% of sales in
                                2035

                          Europe – LV powertrain mix evolution for Green Constraint scenario
                                                                                                        Fuel Cell
100%
                                                                                                        EV High Range
90%
                                                                                                        EV Low Range
80%                                                                                                     LPG
70%                                                                                                     CNG
60%                                                                                                     Diesel PHEV
50%                                                                                                     Diesel Mild 48V
                                                                                                        Diesel
40%
                                                                                                        Gasoline EREV
30%                                                                                                     Gasoline PHEV
20%                                                                                                     Gasoline Full
10%                                                                                                     Gasoline Mild 48V
 0%                                                                                                     Gasoline Mild 12V
       2017 2018 2019 2020 2021 2022 2023 2024 2025 2026 2027 2028 2029 2030 2031 2032 2033 2034 2035   Gasoline

 In Europe, the gradual halt in the sale of 100% thermal vehicles has boosted the shift from sales to
 alternative engines, especially 100% electric vehicles. Under the assumption that CNG will not be
 affected by this decision, they reach 12% of the LV market share in 2035.

                                                  Propriété PFA- reproduction interdite   –
In France, favorable to electromobility, BEVs and PHEVs
will account respectively for 34% and 20% of sales of LV
in 2035
France – LV powertrain mix evolution for Green Constraint scenario
Fuel Cell
100%
EV High Range
90%
EV Low Range
80% LPG
70% CNG
60% Diesel PHEV
50% Diesel Mild 48V
Diesel
40%
Gasoline EREV
30% Gasoline PHEV
20% Gasoline Full
10% Gasoline Mild 48V
0% Gasoline Mild 12V
2017 2018 2019 2020 2021 2022 2023 2024 2025 2026 2027 2028 2029 2030 2031 2032 2033 2034 2035 Gasoline
France is particularly favorable to the development of BEVs and PHEVs, those together represent
more than one in two cars sold in 2035, and 20 points of market share more than average in Europe.
Propriété PFA- reproduction interdite –LV in Europe: Emissions drop significantly
Contribution of different effects in Europe for the
CO2 emissions per scenario
Green Constraint scenario
700 600
600 500
500 400 - 70
400
MtCO2
300
-47%/y
488 - 157
300 -50%/y -9 -9
200
-59%/y
200 -66%/y 243
100 Total: -50%
100
0
2017 Evolution du Efficacité ICE et Incorporation Contenu Green
0 parc électrification de carbone des Constraint 2035
2010 2012 2014 2016 2018 2020 2022 2024 2026 2028 2030 2032 2034 biocarburants carburants
Between 2017 and 2035, the emissions of LV decrease by two. The improvement of the energy efficiency of
thermal LV and the electrification of part of the park contribute 64% to this decrease (-157MtCO2).
Two effects oppose them selves for the thermal vehicles. On the one hand, the decrease in the market share of diesel in favor of gasoline, with
more CO2 emission, is unfavorable to European Emissions, nevertheless on the other hand the improvement of the efficiency of the thermal
vehicles allows, also a significant fall in emissions.
Propriété PFA- reproduction interdite –Evolution of the powertrain mix of HV Sales
European HV sales powertrain mix by segment
Global HV sales powertrain mix Worldwide HV CO2 emissions evolution
Europe World
100% 100%
80% 80%
60% 60%
40% 40%
20% 20%
0% 0%
2020 2025 2030 2035 2020 2025 2030 2035
Propriété PFA- reproduction interdite –Synthesis
1 | By 2035, BEVs will account for 12% of global light vehicle sales and PHEVs 8%.
In Europe, BEVs will have 24% market share and PHEVs 10%.
2 | Improving the energy efficiency of thermal vehicles, which translates into lower consumption, is the main contribution to the
reduction of CO2 emissions of LVs by 2035 globally. The electrification of vehicles contributes to a lesser extent to the reduction of
these emissions, notably due to increasing market share of BEVs, which is, however, limited to 12% in 2035 Worldwide
3| Between 2017 and 2035, CO2 emissions from all road transport increased by 14%, penalized by the increase in CO2
emissions of heavy vehicles worldwide, but decreased by 8% for light vehicles. The evolution of emissions is differentiated by
zone. As a result, they are down 31% in the United States and Europe, which account for 77% of all emission reductions recorded
between 2017 and 2035, when they increase by 15% in China over the same period.
4| The decarbonisation of alternative energy sources (biofuels, electricity, biomethane and hydrogen), the development of new
mobility offers (eg auto sharing, car pooling), and access restriction measures are among the most effective measures to bend the
curve of CO2 emissions. On the other hand, stricter CO2 emission standards are relatively less efficient and have a delayed impact
on the part of time required to renew fleets
Propriété PFA- reproduction interdite –Electric vehicles: a strong trend seen at the Mondial de
l'Automobile
Hyundai Kona EV Kia Niro EV Jaguar i-PACE
DS3
Renault
Crossback
ZOE
e-tens
Propriété PFA- reproduction interdite –Electrified vehicles categories LV
2030 Electric vehicle uses
LONG RANGE VEHICLE ACCESSIBLE VEHICLE URBAN MOBILITY VEHICLE
HIGH PERFORMANCE VEHICLE
>500Kms on motorway Peri-urban use Dedicated to urban use
5 seaters 4-5 seaters 2-4 seaters (mobility in the city center)
Urban access (ZEV) Entry-level price Individual and self-shared Premium or sport luxury vehicles
Autonomy > 500 km Autonomy : 100-300 kms AutonomyBattery specifications expected
2030 Electric vehicle specifications
LONG RANGE VEHICLE ACCESSIBLE VEHICLE URBAN MOBILITY VEHICLE HIGH PERFORMANCE VEHICLE
Europe > 600 kv/year Europe>> 2000 kv/year Europe >300 kv/year Europe >100 kv/year
BEV battery (15 -45 KWh) BEV battery (10 -15 KWh)
BEV battery (80-100 KWh) (vs FCVE ar PHEV) Charge time : high speed or 8h maximum BEV battery (150 -200 KWh)
Charge time : 8h maximum (7KW)
Charge time : 15 min (capacity 80%) (3KW) Charge time : high speed (350 KW)
Energy : 450 Wh/L
Adapted infrastructure 150KW Energy : 150 - 300 Wh/L Energy : >>400 Wh/L (1000 Wh/L)
Power < 75 KW
Energy : >>450 Wh/L (1000 Wh/L) Power < 25 KW Power 300-800 KW
Power < 150KW
Véhicules PHEV Véhicules MHEV
PREMIUM VEHICLE MAIN STREAM VEHICLE MAIN STREAM VEHICLE
Europe >500 kv/year Europe >>1000 kv/year Europe >5000 kv/year
PHEV 50-80 Kms, ZEV battery (10 -20 KWh) PHEV 10-20 Kms, battery (Electrified vehicles categories HV
2030 Electric Trucks specifications
LONG DISTANCE FRET REGIONAL DELIVERY URBAN DELIVERY
>800Kms on motorway Peri-urban use Dedicated to urban use
> 425 KW > 225 KW
>220 KWh >125 KW
>500 KWh
Range < 350 Kms >90 KWh
Range > 600 Kms
< 200 Kms
Public tansportation Construction
BUS
COACH CONSTRUCTION
Multi use
>225 KW > 325 KW
48V battery
>175 KWh >350 KWh
PHEV 3 kms
RangePoints of attention regarding electromobility
• Think full environmental footprint
• Preserve the value chain
Valeur non sécurisée, action
Partiellement sous contrôle Sous contrôle
nécessaire
• Critical raw materials
• Need of recyclability
Propriété PFA- reproduction interdite –Three major technical developments needed
A competitive TCO (incl. Cost of purchase and residual
value (batteries, engines, energy, recycling ...))
Fast Charging
Autonomy and charging time acceptable
FCEV
Dynamic charging
Energy management (decarbonised) and an
adapted infrastructure with the smart-grid
connection & associated services
Propriété PFA- reproduction interdite –Thanks
You can also read