A Study on Fundamental Analysis of Automobile Companies (Car Manufacturing Companies) in India
←
→
Page content transcription
If your browser does not render page correctly, please read the page content below
International Journal of Scientific Research and Review                                                ISSN NO: 2279-543X

              A Study on Fundamental Analysis of Automobile Companies
                       (Car Manufacturing Companies) in India
                                                         P. Devika1,
                                                     1
                                                      Asst. Professor,
                                                 Department of BBA(CA),
                                   Sri Krishna Arts and Science College, Coimbatore.
                                            1
                                              E mail Id : devikap@skasc.ac.in
             Abstract: The term Financial Markets is often used to refer just to the markets that are
             used to raise finance. A financial market is a market in which people trade financial
             securities and derivatives such as futures and options at low transaction costs. An
             investor wants to invest his money in various kinds of securities but each and every
             investment contains some level of risk and as a reward he gets the return. But before
             making an investment in particular security he makes the analysis on the particular
             security. Fundamental analysis of Indian Automobile companies in which Five major
             automobile companies have considered which are having a major impact on Indian stock
             market, in which an investor is guided properly as to which stock is to be chosen for the
             future investment and which is to be not. In this research Exploratory Research Design is
             selected which is based on the secondary data. Years i.e. from 2014-18 for top five
             automobile companies (Car- Indian Manufacturing) namely Maruti Suzuki, Hyundai
             Motor India, Mahindra & Mahindra, Tata Motors and Honda Cars India. The
             researchers also compared the fundamentals of these 5 companies and applied different
             statistical tools.

             Key words: Fundamental Analysis, Automobile, NPA, ROE, P/E ratio.

                                                 1. Introduction
                Fundamental analysis studies the core underlying elements that influence the economy
             of a particular entity, like a stock or currency. It attempts to predict price action and trends
             by analyzing economic indicators, government policy, societal and other factors within a
             business cycle framework. The fundamental analyst would love to purchase the stock if
             the current market price is below its intrinsic value and would sell the stock when the
             market price goes far above the intrinsic value. Hence, fundamental analysis is important
             in stock picking.

                The Indian auto industry became the 4th largest in the world with sales increasing 9.5
             per cent year-on-year to 4.02 million units (excluding two wheelers) in 2017. It was the
             7th largest manufacturer of commercial vehicles in 2017. The Two Wheelers segment
             dominates the market in terms of volume owing to a growing middle class and a young
             population. Moreover, the growing interest of the companies in exploring the rural
             markets further aided the growth of the sector.

                India is also a prominent auto exporter and has strong export growth expectations for
             the near future. Automobile exports grew 20.78 per cent during April-November 2018. It
             is expected to grow at a CAGR of 3.05 per cent during 2016-2026. In addition, several
             initiatives by the Government of India and the major automobile players in the Indian
             market are expected to make India a leader in the two-wheeler and four wheeler market in
             the world by 2020.

Volume 8, Issue 1, 2019                                                                                         Page No: 911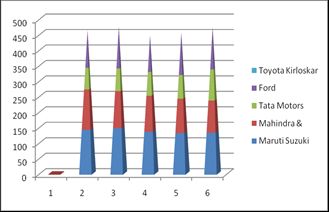
International Journal of Scientific Research and Review                                           ISSN NO: 2279-543X

                                    2. Automobile Industry in India

                                            3. Literature Review
                Richard C. Grimm (2012) explores fundamental analysis to determine its application as
             an Austrian approach to common stock selection. The Thymologic method and the
             category of understanding are applied as frameworks for an Austrian approach and to
             evaluate fundamental analysis as a process for common stock selection. The analysis
             supports the conclusion that fundamental security analysis can be practiced in a manner
             consistent with traditional Austrian views and is suitable as a common stock selection
             method by those who wish to adhere to such views. Venkates C K, Dr. Madhu Tyagi, Dr.
             Ganesh L (2012), revealed out that investors can create a stronger value portfolio by using
             simple historical financial performance. They used ‘F Score’ Model for the same.
                     Hemal Pandya and Hetal Pandya (2013) carried out Fundamental Analysis of
             both the companies is carried out and their intrinsic value ranges are obtained from the
             EIC Analysis of Tata motors and Maruti Suzuki to help investor decisions.

                                         4. Objectives of the Study
             [1] To evaluate the profitability position of Indian Car Manufacturing companies in the
                 automobile sector.
             [2] To Analyze the fundamentals of sample automobile companies selected for study.

                                            5. Research Method
                 Data                         : Secondary

                Population                    : Companies in Automobile sector

                Source of data                : Balance sheet, Stock Market, Websites

                Source of data                : Quantitative

                Sample size                   : Top 5 Indian Car Manufacturing companies

                Statistical Tools             : Mean, Standard Deviation & Ratios

                Time Period                   : 5 Years, 2014-2018

Volume 8, Issue 1, 2019                                                                                    Page No: 912
International Journal of Scientific Research and Review ISSN NO: 2279-543X
6. Data Analysis and Interpretation
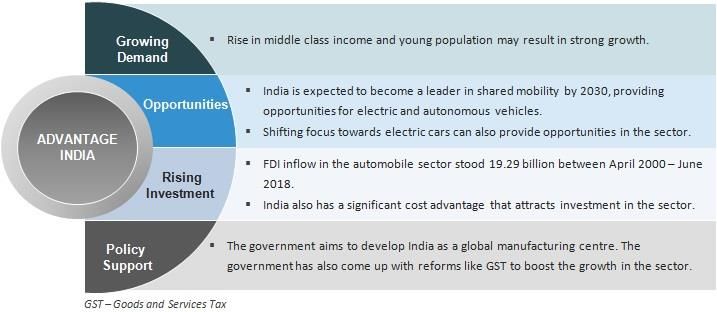
Net Profit Margin: The percentage of revenue remaining after all operating expenses,
interest, taxes and preferred stock dividends (but not common stock dividends) have been
deducted from a company's total revenue. NPM indicates how much a company is able to
earn all direct and indirect expenses for every rupee of revenue. The Toyota Kirloskar
earned 509.99 for the NPM of the selected companies. Next Tata Motors earned 5.07
scores above all the companies as far as the NPM is concerned.
Table 1
Maruti Mahindra Tata Toyota
Year Ford
Suzuki & Mahindra Motors Kirloskar
2014 6.36 9.27 0.97 4.28 686.27
2015 7.42 8.52 -13.05 5.86 1331.16
2016 9.32 7.83 -0.14 5.86 1268.31
2017 10.80 8.27 -5.48 4.28 816.25
2018 9.68 8.94 -1.75 4.28 2137.48
Mean 8.71 8.56 -3.89 4.91 1247.89
SD 1.60 0.50 5.07 0.77 509.99
Figure 1
Return on Equity: The Return on Equity ratio essentially measures the rate of return that
the owners of common stock of a company receive on their shareholdings. Return on
equity signifies how good the company is in generating returns on the investment it
received from its shareholders. ROE indicates Tata Motors earned 12.14 equity, Mahindra
& Mahindra earned 3.25 scores.
Table 2
Mahind
Maruti Tata Toyota
Year ra & Ford
Suzuki Motors Kirloskar
Mahindra
2014 13.26 22.39 1.74 7.69 6.97
2015 15.65 17.25 -31.93 12.11 6.51
2016 17.95 14.29 -0.26 10.80 8.24
2017 20.17 13.60 -11.48 8.16 3.79
2018 18.49 14.37 -5.13 8.16 6.64
Mean 17.10 16.38 -9.41 9.38 6.43
SD 2.40 3.25 12.14 1.74 1.45
Volume 8, Issue 1, 2019 Page No: 913International Journal of Scientific Research and Review ISSN NO: 2279-543X
Figure 2
Asset Turnover Ratio (%): An efficiency ratio that measures a company's ability to
generate sales from its assets by comparing net sales with average total assets. It’s
Indicate Tata Motors turnover ratio 10.76 earned, Next score to Mahindra & Mahindra its
8.87
Table 3
Mahindra
Maruti Tata Toyota
Year & Ford
Suzuki Motors Kirloskar
Mahindra
2014 143.11 129.46 68.94 119.88 0.98
2015 148.93 118.21 72.67 133.39 0.46
2016 137.19 115.14 75.59 118.03 0.63
2017 132.74 110.22 75.26 136.17 0.45
2018 134.34 102.67 99.35 136.17 0.30
Mean 139.26 115.14 78.36 128.72 0.56
SD 5.98 8.87 10.76 8.06 0.23
Figure 3
Return on Assets: It measures the amount of profit the company generates as a
percentage of the value of its total assets. ROA indicates Tata Motors earned 3.65, Maruti
Suzuki earned 1.85 score, compared with the all the companies these two companies get
the high earning in ROA.
Volume 8, Issue 1, 2019 Page No: 914International Journal of Scientific Research and Review ISSN NO: 2279-543X
Table 4
Maruti Mahindra Tata Toyota
Year Ford
Suzuki & Mahindra Motors Kirloskar
2014 9.08 12.01 0.67 5.14 6.79
2015 11.04 10.08 -9.48 7.82 6.19
2016 12.86 9.02 -0.10 6.91 8.02
2017 14.45 9.11 -4.12 5.83 3.68
2018 13.07 9.18 -1.74 5.83 6.45
Mean 12.1 9.88 -2.95 6.30 6.22
SD 1.85 1.13 3.65 0.94 1.41
Figure 4
7. Suggestion
[1] All the companies performed will during period of ten years. Their performance is
also good and investors can invest their money in the shares of these companies.
[2] NPM Indicates the Highest earnings from Toyota Kirloskar, It’s the best invest out of
Five.
8. Conclusion
A small investor may not have a huge investable amount. Hence, he cannot invest
his money in different sectors. Therefore, his ability to diversify investment is very much
restricted. A sensible investor should try to identify few sectors first and then should go
for comprehensive study of the sector. He should inspect carefully the fundamentals of
the sector before taking any investment decision. This paper help us to know the
fundamentals of the automobile (Car-Indian Manufacturing) sector in India by taking a
sample of top five leading automobile (Car-Indian Manufacturing) companies
9. References
[1] Dyna Seng & Jason R. Hancock (2012), “Fundamental Analysis and the
Prediction of Earnings”, International Journal of Business and Management Vol. 7,
No. 3; February 2012. [Google Scholar] Financial reports of concerned companies
fetched from moneycontrol.com. [Google Scholar]
[2] Hemal Pandya and Hetal Pandya (2013), ‘Fundamental Analysis Of Indian
Automobile Industry’, International Journal of Current Research, Vol. 5 , Issue, 5,
pp.1273-1286. [Google Scholar]
[3] Hossein Khanifar, Nasser Jamshidi & Mohammadbagher Mohammadinejad (2012),
“Studying Affecting Factors on Analysts’ Decisions Regarding Share Analysis in
Tehran Stock Exchange: A Fundamental Analysis Approach” European Journal of
Economics, Finance and Administrative Sciences Issue 44 (2012). [Google Scholar]
Volume 8, Issue 1, 2019 Page No: 915International Journal of Scientific Research and Review ISSN NO: 2279-543X
[4] Richard C. Grimm (2012), “Fundamental analysis as a traditional Austrian approach
to common stock selection” The Quarterly Journal of Austrian Economics, Vol.15,
No.2, Summer 2012. [Google Scholar]
[5] Venkates C K, Dr. Madhu Tyagi, Dr. Ganesh L (2012), ‘Fundamental analysis and
stock returns: An Indian Evidence’ Global Advanced Research Journal of Economics,
Accounting and Finance Vol. 1(2) pp. 033-039. [Google Scholar]
Volume 8, Issue 1, 2019 Page No: 916You can also read