MARKET UPDATE Jeremy Fehr - BMO ETF Dashboard
←
→
Page content transcription
If your browser does not render page correctly, please read the page content below
Jeremy Fehr

MARKET UPDATE
Wednesday April 1, 2020

Dial in number: 1 (647) 497-9389
Attendee Access Code: 462-147-083#
Computer audio also available

     Jeremy has spent 21 years working within the Investment
     Industry as an investment advisor and developing proprietary
     risk management and performance enhancing technologies.
     This background has been drawn upon extensively in the
     creation of SIACharts.com, a technical analysis service with a
     subscriber base of investment professionals across Canada
     and SIA Wealth Management.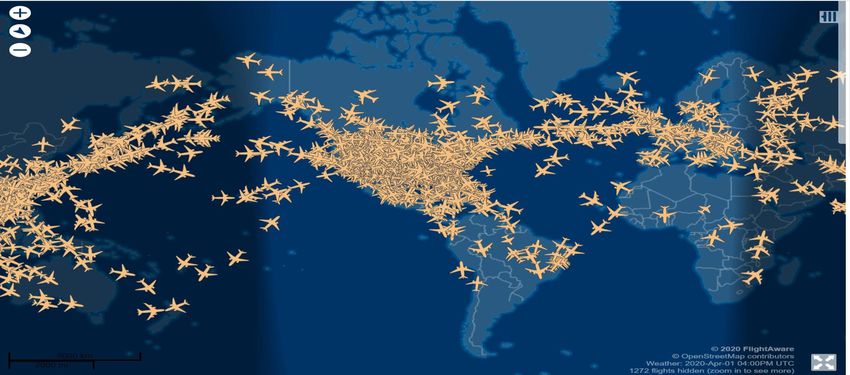
Agenda
         SIA Wealth Management Update

         Bear Market Bounce “Bull Trap”

         What do the Charts Tell Us?
How Can SIA Wealth
Management Help From Here?
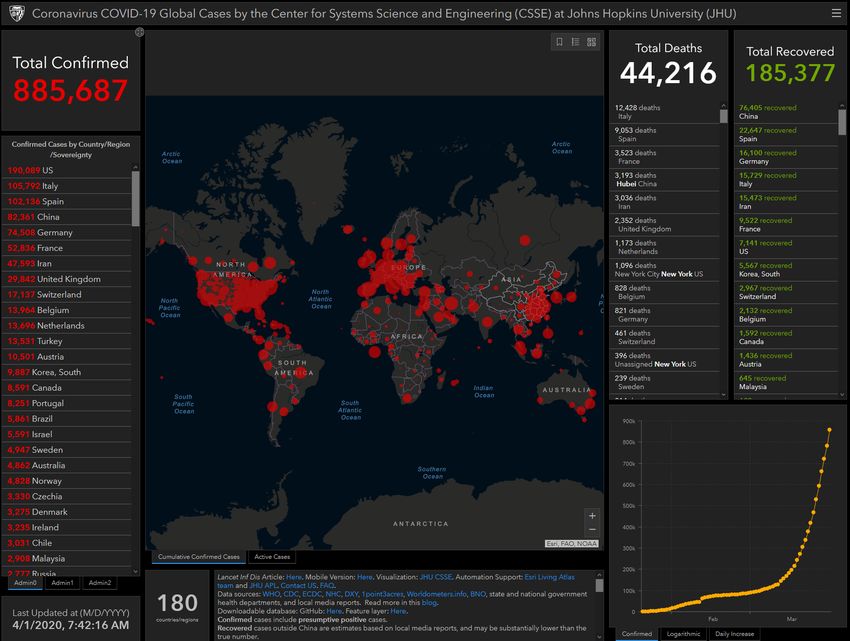
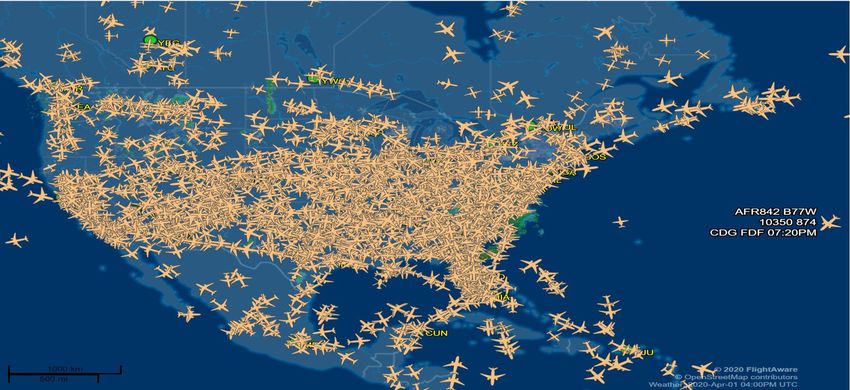
COVID-19 Update
●   Cases still rising
    exponentially

●   Isolation periods being
    extended

●   Economies will be on
    hold longer than
    expected

                              The performance data shown is all in U.S. Dollars   4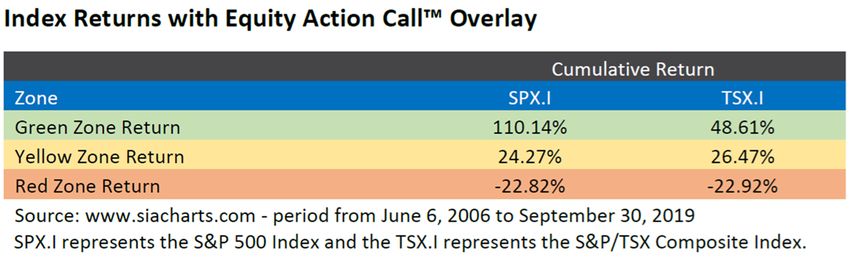
FlightAware – Live Flight Tracking

www.flightaware.com
FlightAware – Live Flight Tracking

www.flightaware.com
How does being tactical help?
●   Where will markets go from here?

     ○   Scenario 1: Markets continue to go up and our system goes
         back into the green zone and we become fully invested once
         more.

     ○   Scenario 2: Markets go down further and we stay away from
         equities, preserving capital

●   Hope for the best but prepare for the worst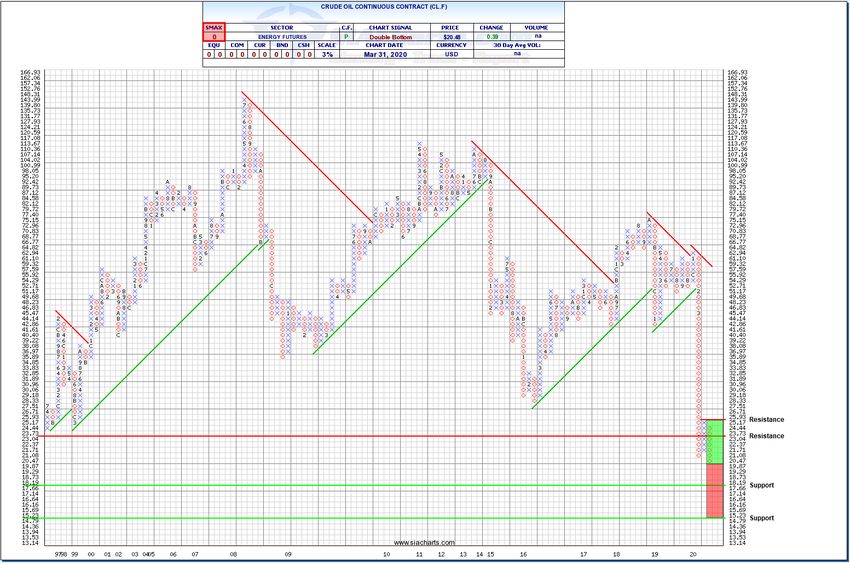
How much to get back to break even
      Percentage Loss    Percent Rise To Break Even
           -10%                    +11%
           -15%                    +18%
           -20%                    +25%
           -25%                    +33%
           -30%                    +43%
           -35%                    +54%
           -40%                    +67%
           -45%                    +82%
           -50%                   +100%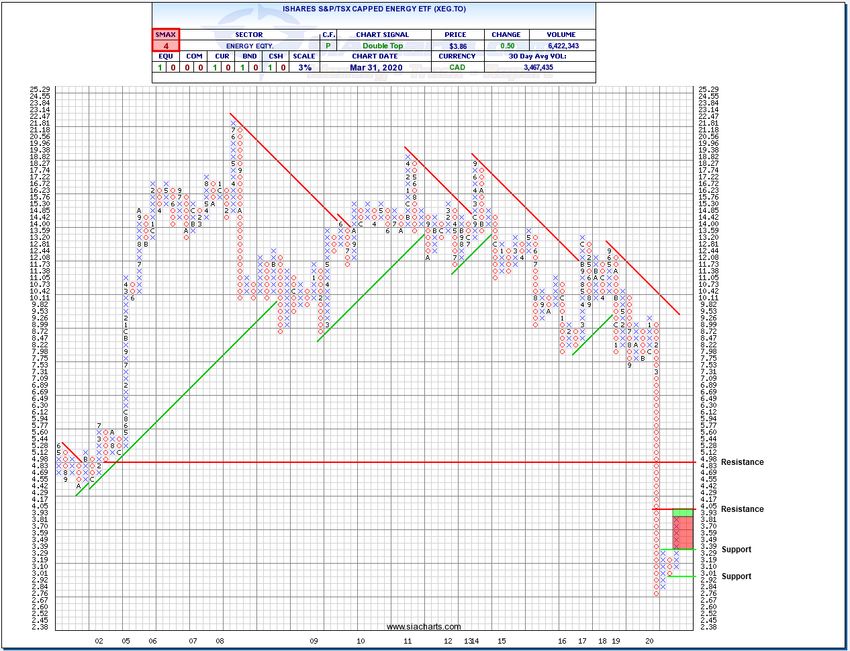
Now is the time to add a TACTICAL SLEEVE
●   Having a 15% - 25% allocation to a tactical sleeve. One where the fund
    manager will go completely out of equity markets according to their rules
    (Like SIA Wealth) is an essential tool to risk management.

●   Advisors who have utilized this strategy already have protected client assets
     Hypothetical Example:
                  20% Stock Portfolio
               ●  20% Global Fundamental Fund
               ●  20% BMO Tactical Global Equity
               ●  13% Global Fixed Income Fund
               ●  13% Global Fixed Income Fund
               ●  13% BMO Tactical Global Bond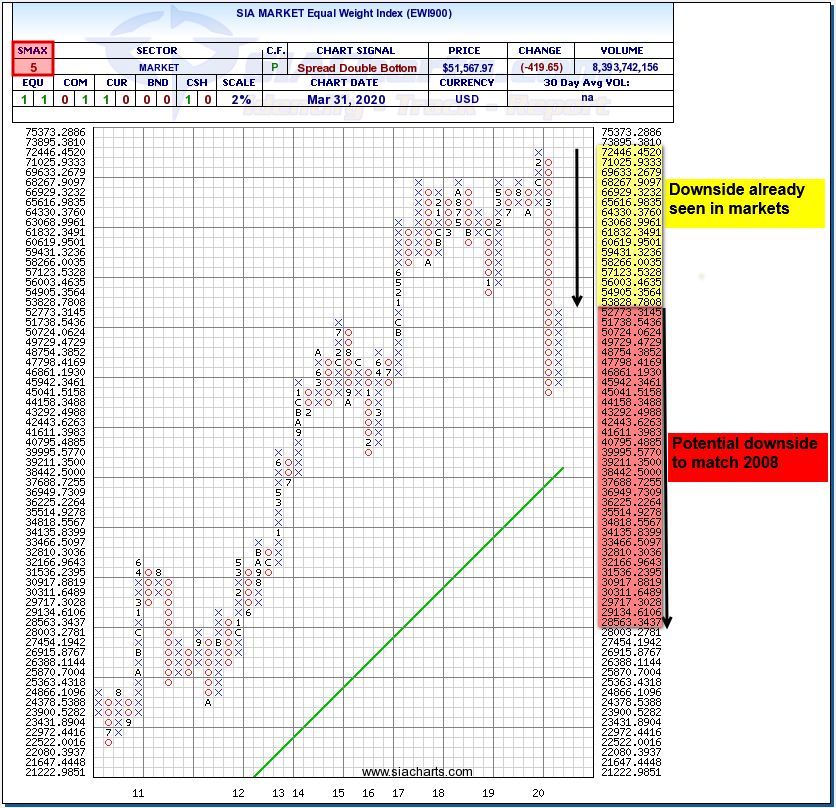
Call to Action – Equity Allocation
                                          Green EAC                 Red EAC

Asset Allocation             Weight   Equity   Cash & F.I.   Equity     Cash & F.I.

Equity                        40%     40.0%       0.0%       40.0%            0.0%
BMO Tactical Global Equity
OR BMO SIA Focused North
America                       20%     20.0%       0.0%       0.0%         20.0%

Cash and Fixed Income         40%     0.0%       40.0%       0.0%         40.0%

Totals                       100%     60.0%      40.0%       40.0%        60.0%
Call to Action – Balanced
Portfolio’s
*
• As you can see in the above chart how your allocation will change when
SIA Wealth is in the Green, Yellow and Red zones.
• *Moving from Red EAC to Yellow EAC will not result in a change in the
equity exposure.Bear Market Rally “Bull Trap”
HOW BAD CAN IT GET?

●   Returns highlighted are “after” moving to Red Zone

●   Red Zone performance history shows significant risk with an average of -22% drop

                                                                                       13
BEAR MARKET RALLIES
“THE BULL TRAP”
The performance data shown is all in U.S. Dollars 14History Shows Us to Be Careful!
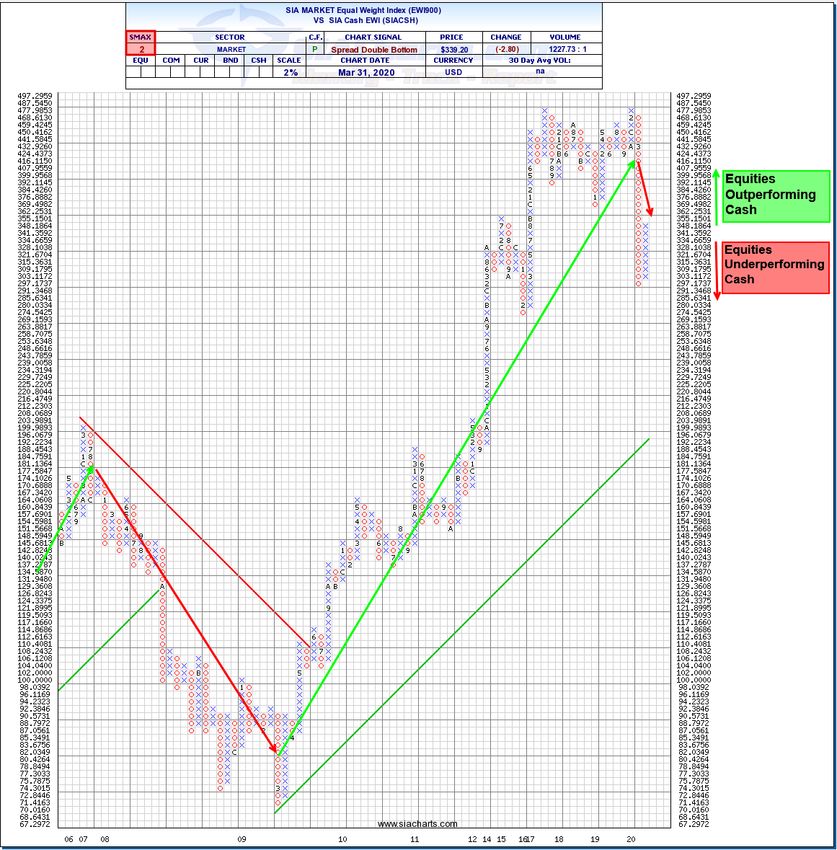
SIA Charts MARKET EWI 2008
● Indicators started to decline in July
2007
● Red Zone in January 2008
● 6 Rallies Greater than ~10% that failed
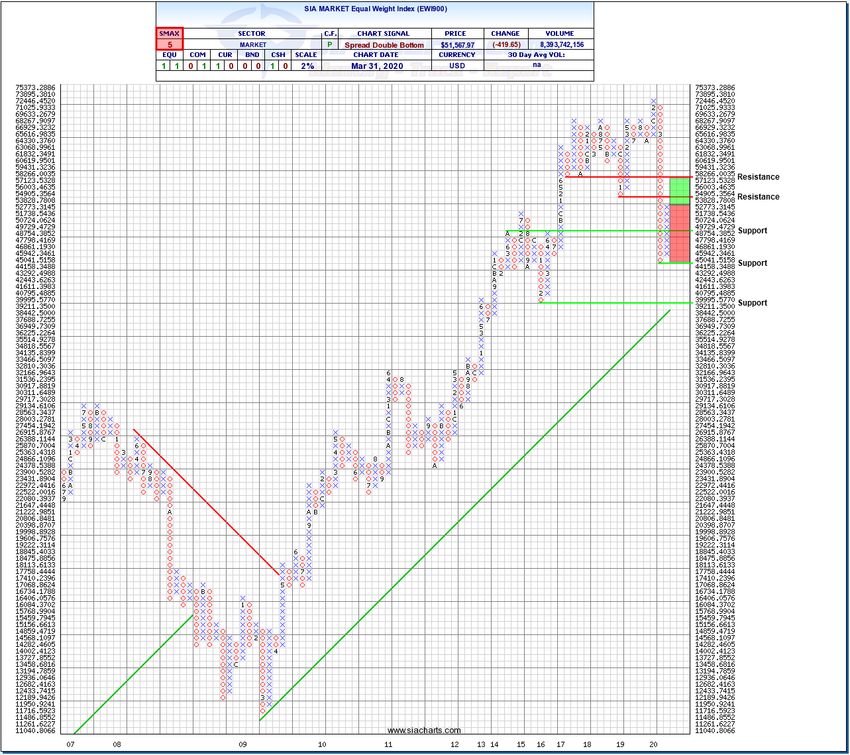
15HOW BAD CAN IT GET?
SIA Charts MARKET EWI 2020
● Currently sitting at only 1/3 the
losses of 2008
● What are the odds of us moving up
16 boxes vs going down?
● What is your Risk vs. Reward?
● Can your clients take the risk?
16What Do The Charts
Tell Us?SIACharts Equity Action Call™
First Level of Analysis
The SIACharts Equity Action CallTM (EAC) is a proprietary measurement created by SIACharts as a macro measure of
global equity market risk, money flows and overall price action changes relative to alternative asset classes to
determine equity market opportunitySIACharts Asset Class Ranking
Second Level of Analysis
SIA AI ranks these 7 Asset Classes Daily from the strongest to the weakest, below is the change since the last webinar:
The SIACharts Asset Class RankingsTM (ACR) is a proprietary measurement and created by SIACharts to determine which areas of the
market are experiencing the highest positive money flow (or lowest negative money flow) and ranking them down to the areas that have
the lowest positive money flow (or highest negative money flow) as measured by price action
Source: SIA ChartsSIA Market EWI VS SIA Cash EWI
● Still a downward trend for
Equities
● Risk remains high for another leg
down
● An oversold bounce which was to
be expected
20SIA Market EWI
● Oversold bounce retraced
1/3 of drawdown
● Strong resistance above
● Still in downtrend
21S&P 500 Index
● Oversold bounce retraced
40% of drawdown
● Approaching strong resistance
● Still in a downtrend
22S&P/TSX
Composite Index
● Retraced 1/3 of
drawdown
● Approaching key
resistance
● Still in a downtrend
23Crude Oil
● Crude has
moved below all
support for data
available
● Downward
potential to $15
range
● An agreement
between U.S.,
Saudi Arabia,
and Russia
needed to stop
fall
24S&P/TSX
Capped Energy ETF
● Bouncing strongly
on grossly oversold
levels
● Remains in Bear
Market
● Just for traders at
this time
25Gold
● Moved back strongly
to test resistance at
$1,682.12
● Upward potential to
the $1,820 range
● Pricing in risk of
higher interest rates
as Governments
issues Trillions in
debt
26Fund Codes & Sales Information
AI Powered ETFs & Managed Funds
Fund Name Advisor Series Mgmt Fee F Series Mgmt Fee ETF Mgmt Fee
BMO SIA Focused Canadian Equity Fund BMO99257(FE)/ BMO98257(LL) 1.65% BMO95257 0.65% TSX: ZFC 0.75%
BMO99258(FE)/ BMO98258(LL)
BMO95258
BMO SIA Focused North American Equity Fund BMO79258(FE:US$)/ 1.70% 0.75% TSX: ZFN 0.80%
BMO40258(US$)
BMO78258(LL:US$)
BMO99217(FE)/ BMO98217(LL) BMO95217
BMO Tactical Global Equity ETF Fund 1.60% 0.70% -
BMO79217(FE:US$)/ BMO78217(LL:US$) BMO40217(US$)
BMO99220(FE)/ BMO98220(LL) BMO95220
BMO Tactical Global Bond ETF Fund 1.30% 0.60% -
BMO79220(FE:US$)/ BMO78220(LL:US$) BMO40220(US$)
BMO99763(FE)/ BMO98763(LL) BMO95763
BMO Tactical Global Asset Allocation ETF Fund 1.55% 0.65% -
BMO79763(FE:US$)/ BMO78763(LL:US$) BMO40763(US$)
For additional information:
www.bmo.com/gam/us/campaigns/sia
SIA Wealth Management Inc. www.siawealth.com 403 744 5190 For Advisor Use OnlyDisclaimer
SIA Wealth Management Inc. specifically represents that it does not give investment advice or advocate the
purchase or sale of any security or investment. Any investment decision by any party shall be without reliance of
any kind whatsoever on SIA Wealth Management Inc. or the information herein and shall be at the sole and
absolute discretion and liability of the party making such decision. None of the information contained in this
website or document constitutes an offer to sell or the solicitation of an offer to buy any security or other
investment or an offer to provide investment services of any kind. The information is provided solely for
illustration purposes and the delivery and/or redistribution of this content in any manner whatsoever, to any
other person, party, or organization shall be formal agreement and confirmation by the delivering party that any
and all liability resulting therefrom shall rest with the party delivering such information. Neither SIA Wealth
Management Inc. nor its third party content providers shall be liable for any errors, inaccuracies or delays in
content, or for any actions taken in reliance thereon.
Past or historical performance does not guarantee future results. Investment returns and principal value will
fluctuate, so that investors' shares, when sold, may be worth more or less than their original cost. Investing in
any investment process, does not guarantee that an investor will make money, avoid losing capital, or indicate
that the investment is risk-free. There are no absolute guarantees in investing so when reviewing any
performance information and/or data of any kind whatsoever on the SIA Wealth Management Inc. website,
email content, or other materials, you specifically represent, acknowledge and confirm that you have not used,
and/or will not use, such information to make investment decisions.
SIA Wealth Management Inc. www.siawealth.com 403 744 5190 For Advisor Use Only
25THANK YOU FOR
YOUR TIME!
GET IN TOUCH
1-844-744-5190
sales@siawm.com
Suite 1700
663 - 6th Avenue SW
Calgary AB
T2P 2Y5You can also read