ASML reports €4.0 billion net sales and €1.0 billion net income in Q2 - Net sales now expected to grow by around 35% in 2021
←
→
Page content transcription
If your browser does not render page correctly, please read the page content below

Public

ASML reports €4.0 billion net sales and €1.0 billion net income in Q2
                Net sales now expected to grow by around 35% in 2021

                                             ASML 2021 Second-Quarter

                                                    Veldhoven, the Netherlands

                                                                  July 21, 2021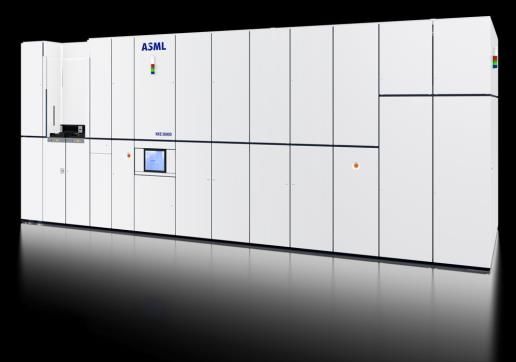
Public
                                Slide 2
                          July 21, 2021

Agenda

• Investor key messages
• Business summary
• Outlook
• Financial statements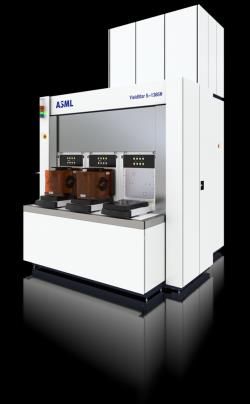
Public
                              Slide 3
                        July 21, 2021

Investor key messages
Investor key messages Public
Slide 4
July 21, 2021
• Expanding end market applications, fueled by innovation from a highly profitable
ecosystem, drive semiconductor demand across all markets
• Shrink is a key industry driver supporting innovation and providing long term industry
growth
• Holistic Lithography enables affordable shrink and therefore delivers compelling value
for our customers
• DUV, EUV and Application products are highly differentiated solutions that provide
unique value drivers for our customers and fuel significant growth opportunities for
ASML
• EUV will enable continuation of Moore’s Law and will drive long term value for ASML
well into this decade
• In November 2018 ASML modeled an annual revenue opportunity between €15 – €24
billion for 2025. We will provide an update at our Investor Day which is currently
planned on 29 September 2021 in London
• We expect to continue to return significant amounts of cash to our shareholders
through a combination of growing annualized dividends and share buybacksPublic
Slide 5
July 21, 2021
Business summaryQ2 results summary Public
Slide 6
July 21, 2021
• Net sales of €4.0 billion, net systems sales of €2.9 billion, Installed Base
Management* sales of €1.1 billion
• Gross margin of 50.9%
• Operating margin of 30.8%
• Net income as a percentage of net sales of 25.8%
• Earnings per share (basic) of €2.52
• Net bookings of €8.3 billion, including €4.9 billion of EUV systems
* Installed Base Management equals our service and field upgrades salesEUV: shipped first NXE:3600D Public
Slide 7
July 21, 2021
~15%-20% productivity improvement capability
and around 30% improved overlay over the 3400C
Applications: shipped first YieldStar 1385
improved accuracy and ~50% productivity
improvement capability over the YieldStar 1375Net system sales breakdown (Quarterly) Public
Slide 8
July 21, 2021
*
Q2’21
total system sales
€2,949 million
Q1’21
total system sales
€3,129 million
* Q1.2021: Excluding EMEA region which represents negative 6% as we bought back two unused systems previously sold to a customer, which we counted for as a revenue reversalTotal net sales € million by End-use Public
Slide 9
July 21, 2021
Installed Base
Management
Logic
Memory
As of January 1, 2018, ASML has adopted the new Revenue Recognition Standard (ASC 606) and Lease Standard (ASC 842).
The comparative 2017 numbers presented above have not been adjusted to reflect these changes in accounting policy.Litho systems bookings activity by End-use Public
Slide 10
July 21, 2021
Lithography systems
Q2’21 total system value New Used
€8,271 million Units 156 11
Lithography systems
New Used
Q1’21 total system value
Units 110 10
€4,740 million
Our systems net bookings include all system sales orders for which written authorizations have been accepted (for EUV excluding the High-NA systems).Capital return to shareholders Public
Slide 11
July 21, 2021
• In Q2, ASML paid a final dividend of €1.55 per ordinary share or €639 million. Together with
the interim dividend paid in 2020, this results in a total dividend for 2020 of €2.75 per ordinary
share
• A new share buyback program of up to €9.0 billion, replacing the previous program, starts on
July 22, 2021, to be executed by December 31, 2023, with up to 0.45 million shares to be
repurchased for employee share plans. ASML intends to cancel the remainder of the shares
repurchased
• ASML has repurchased around €5.2 billion of shares under the €6.0 billion 2020-2022
program, of which around €2.0 billion in Q2 2021
Total dividend Dividend paid
Share buyback
The dividend for a year is paid in the subsequent year, except interim Capital return is cumulative dividend + share buybackPublic
Slide 12
July 21, 2021
OutlookOutlook Public
Slide 13
July 21, 2021
Q3
• Net sales between €5.2 billion and €5.4 billion, including
◦ Installed Base Management sales of around €1.0 billion
• Gross margin between 51% and 52%
• R&D costs of around €645 million
• SG&A costs of around €180 million
2021
• Strong demand across markets drives expected net sales growth by around 35%
• Gross margin between 51% and 52%
• Estimated annualized effective tax rate around 15%Public
Slide 14
July 21, 2021
Financial statementsConsolidated statements of operations € million Public
Slide 15
July 21, 2021
Quarter on Quarter
Q2 2020 Q3 2020 Q4 2020 Q1 2021 Q2 2021
Net sales 3,326 3,958 4,254 4,364 4,020
Gross profit 1,603 1,881 2,212 2,352 2,045
Gross margin % 48.2 47.5 52.0 53.9 50.9
R&D costs (567) (534) (556) (623) (634)
SG&A costs (131) (132) (152) (168) (172)
Income from operations 905 1,216 1,504 1,561 1,239
Operating income as a % of net sales 27.2 30.7 35.3 35.8 30.8
Net income 751 1,062 1,351 1,331 1,038
Net income as a % of net sales 22.6 26.8 31.7 30.5 25.8
Earnings per share (basic) € 1.79 2.54 3.23 3.21 2.52
Earnings per share (diluted) € 1.79 2.53 3.23 3.20 2.52
Lithography systems sold (units) 1 61 60 80 76 72
Net booking value 2 1,101 2,868 4,238 4,740 8,271
1 Lithography systems do not include metrology and inspection systems.
2 Our systems net bookings include all system sales orders for which written authorizations have been accepted (for EUV excluding the High-NA systems).
These numbers have been prepared in accordance with US GAAP. Numbers have been rounded for readers' convenience.Consolidated statements of cash flows € million Public
Slide 16
July 21, 2021
Quarter on Quarter
Q2 2020 Q3 2020 Q4 2020 Q1 2021 Q2 2021
Cash and cash equivalents, beginning of period 2,724 3,499 3,532 6,049 3,244
Net cash provided by (used in) operating activities 372 191 4,670 (942) 3,569
Net cash provided by (used in) investing activities 215 (166) (956) (307) 991
Net cash provided by (used in) financing activities 192 9 (1,194) (1,560) (2,613)
Effect of changes in exchange rates on cash (3) (2) (2) 3 (4)
Net increase (decrease) in cash and cash equivalents 776 33 2,518 (2,806) 1,943
Cash and cash equivalents, end of period 3,499 3,532 6,049 3,244 5,187
Short-term investments 941 876 1,302 1,412 187
Cash and cash equivalents and short-term investments 4,440 4,408 7,351 4,656 5,374
Purchases of property, plant and equipment and intangible assets (232) (222) (305) (197) (247)
Free cash flow 1 140 (31) 4,365 (1,139) 3,322
1 Free cash flow, which is a non-GAAP measure, is defined as net cash provided by (used in) operating activities minus purchases of Property, plant and equipment and intangible assets), see US
GAAP Consolidated Financial Statements.
These numbers have been prepared in accordance with US GAAP. Numbers have been rounded for readers' convenience.Consolidated balance sheets € million Public
Slide 17
July 21, 2021
Quarter on Quarter
Assets Q2 2020 Q3 2020 Q4 2020 Q1 2021 Q2 2021
Cash & cash equivalents and short-term investments 4,440 4,408 7,352 4,656 5,374
Net accounts receivable and finance receivables 3,286 4,664 3,421 4,524 4,426
Contract assets 261 177 119 107 179
Inventories, net 4,686 4,614 4,569 4,748 5,086
Other assets and Held for sale assets 1,833 1,734 1,753 2,396 2,088
Tax assets 846 876 739 1,510 1,319
Equity method investments 892 918 821 842 865
Goodwill 4,541 4,541 4,629 4,556 4,556
Other intangible assets 1,059 1,035 1,049 1,014 988
Property, plant and equipment 2,110 2,198 2,470 2,522 2,609
Right-of-use assets 354 298 345 344 326
Total assets 24,306 25,463 27,267 27,219 27,816
Liabilities and shareholders' equity
Current liabilities 4,631 4,991 6,604 6,876 8,754
Non-current liabilities 6,976 6,730 6,798 6,714 6,969
Shareholders' equity 12,700 13,742 13,865 13,629 12,093
Total liabilities and shareholders' equity 24,306 25,463 27,267 27,219 27,816
For more details see US GAAP Consolidated Financial Statements.
These numbers have been prepared in accordance with US GAAP. Numbers have been rounded for readers' convenience.Forward looking statements Public
Slide 18
July 21, 2021
This document contains statements that are forward-looking, including statements with respect to expected trends, including trends in end markets and
technology industry and business environment trends, outlook and expected financial results, including expected net sales, free cash flow, gross margin, R&D
costs, SG&A costs and estimated annualized effective tax rate, expected growth in net sales, system bookings, backlog, expected trends in Logic and Memory
demand and sales, EUV coverage for 2021, revenue opportunity for 2025, expected shipments of systems and revenue recognition, long term growth
opportunities, expected capacity, future growth outlook, long term demand drivers, expected benefits and performance of systems and applications, expanding
end market trends, expected trends in the semiconductor industry, growth opportunities and drivers, expected increase in output and expected increase trends in
EUV and DUV sales and supply chain capacity, the expectation of higher sales growth from increased output capacity and supply chain revenue opportunity,
plans and strategies, the expectation that EUV will continue to enable Moore's law and drive long term value for ASML, product roadmaps, statements and
intentions with respect to dividends and share buybacks, including the intention to continue to return significant amounts of cash to shareholders through a
combination of share buybacks and growing annualized dividends and statements with respect to the 2021-2023 share buyback program including the amount of
shares intended to be repurchased under the program from 2021 to 2023. You can generally identify these statements by the use of words like "may", "will",
"could", "should", "project", "believe", "anticipate", "expect", "plan", "estimate", "forecast", "potential", "intend", "continue", "target", "future", "progress", "goal" and
variations of these words or comparable words. These statements are not historical facts, but rather are based on current expectations, estimates, assumptions
and projections about our business and our future financial results and readers should not place undue reliance on them. Forward-looking statements do not
guarantee future performance and involve a number of substantial known and unknown risks and uncertainties. These risks and uncertainties include, without
limitation, economic conditions; product demand and semiconductor equipment industry capacity, worldwide demand and manufacturing capacity utilization for
semiconductors, the impact of general economic conditions on consumer confidence and demand for our customers’ products, performance of our systems, the
impact of the COVID-19 outbreak and measures taken to contain it on the global economy and financial markets, as well as on ASML and its customers and
suppliers, and other factors that may impact ASML’s sales and gross margin, including customer demand and ASML’s ability to obtain supplies for its products,
the success of technology advances and the pace of new product development and customer acceptance of and demand for new products, production capacity
and our ability to increase capacity to meet demand, the number and timing of systems ordered, shipped and recognized in revenue, and the risk of order
cancellation or push out, production capacity for our systems including the risk of delays in system production and supply chain capacity and disruptions, trends in
the semi-conductor industry, our ability to enforce patents and protect intellectual property rights and the outcome of intellectual property disputes and litigation;
availability of raw materials, critical manufacturing equipment and qualified employees; trade environment; import/export and national security regulations and
orders and their impact on us, changes in exchange and tax rates; available liquidity and liquidity requirements, our ability to refinance our indebtedness, available
cash and distributable reserves for, and other factors impacting, dividend payments and share repurchases, results of the share repurchase programs and other
risks indicated in the risk factors included in ASML’s Annual Report on Form 20-F for the year ended December 31, 2020 and other filings with and submissions
to the US Securities and Exchange Commission. These forward-looking statements are made only as of the date of this document. We undertake no obligation to
update any forward-looking statements after the date of this report or to conform such statements to actual results or revised expectations, except as required by
law.You can also read