Update: COVID-19 in Canada - June 4, 2020
←
→
Page content transcription
If your browser does not render page correctly, please read the page content below

Update: COVID-19 in Canada
June 4, 2020
Data and modelling are guiding Canada’s response to COVID-19

This presentation provides an update on the status of COVID-19 in Canada.
As we re-open Canadian society, data and modelling indicate that core public
health measures remain essential to control the epidemic in Canada:
   • physical distancing amongst individuals,
   • detect and isolate cases,
   • trace and quarantine contacts, and
   • manage risk of importation.

                                                                               2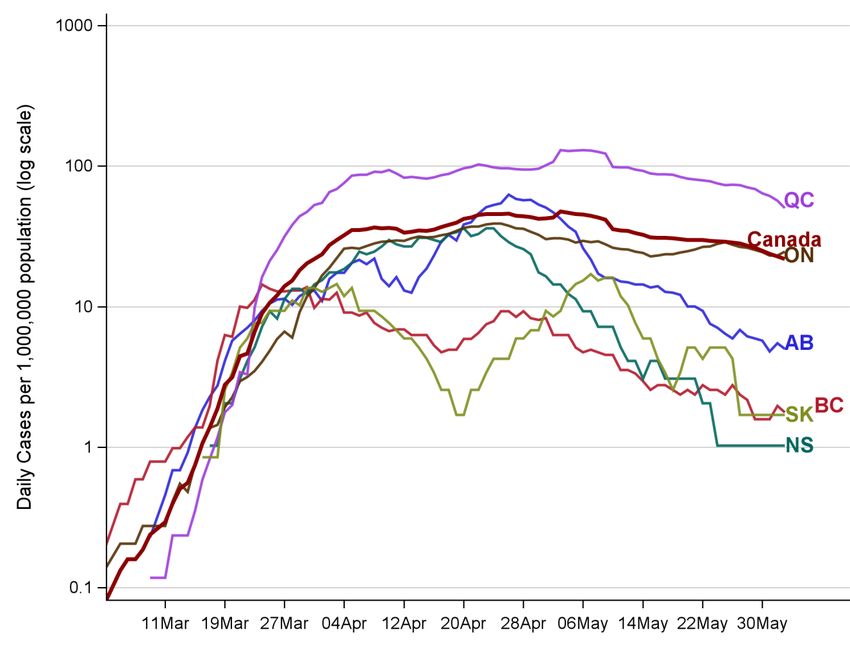
COVID-19 cases have occurred in most health regions in Canada

                                                                                              92,748
                                                                                 Total cases 92,410
                                                                                    > 300                 Median age (range)           51 years (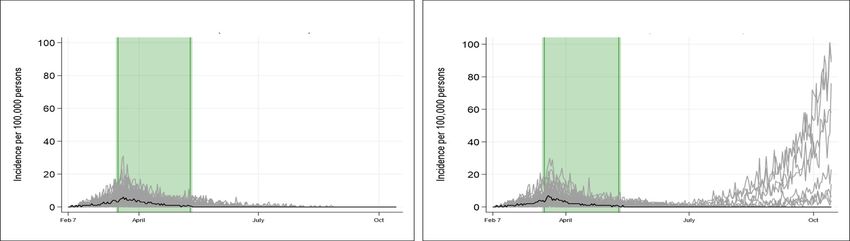
Older Canadians are at greater risk of severe outcomes

Based on available data, people                                  Distribution of COVID-19 cases by age group
aged ≥ 60 years comprise:                        80%

   • 94% of 7,495 deaths                         70%

   • 71% of 8,742 hospital                       60%

     admissions                                  50%
   • 61% of 1,721 ICU admissions

                                    Percentage
                                                 40%

                                                 30%
82% of 7,495 deaths are linked to
long-term care and seniors’                      20%

homes.                                           10%

                                                 0%
                                                          ≤ 19              20-39          40-59           60-79           80+
                                                                                        Age groups

                                                       General population      Cases   Hospitalizations   ICU admissions    Deaths

Data as of June 3, 2020, 21:00

                                                                                                                                 4
Epidemic growth has slowed across all age groups

All age groups have been affected         Number of cases by date of illness onset* and age group (N=85,328)
although the number of cases among                                                                                                                          Reporting Lag

children and youth has remained low.

Young and middle age adults account
for the majority of cases early on and
through to the present.

The sharp peak of cases aged 80
years and older is in large part due to
outbreaks in long-term care homes in
Quebec and Ontario.

 Data as of June 3, 2020, 21:00
                                            *If illness onset not available, the first available of specimen collection or laboratory test date was used.
National trends reflect a series of regional epidemics
                                           Daily Cases (7-day moving average, population adjusted)

Quebec and Ontario account for
over 90% of the national case
count over the past 14 days.

No community transmission in
Prince Edward Island, the
Northwest Territories or the
Yukon.

There have been no cases
reported to date in Nunavut.

 Data as of June 3, 2020, 21:00   Source: Provincial and Territorial websites

                                                                                                     6
Outbreaks point to vulnerabilities in congregate settings
Cases among residents of long-term care and seniors’ Linked
Clusters
homes represent 18% of cases and 82% of deaths Outbreak Setting Cases
(n)
(n)
country-wide.
Long-term care and
981 19,130
Outbreaks in other congregate living and work settings seniors’ homes
are also driving case counts. Hospital 120 >1,500
• Canada’s largest outbreak occurred at the Cargill
meat-processing plant in Alberta with 1,560 cases Correctional facilities 23 833
among workers, household and community
Meat and poultry plants 13 >3,000
members.
Movement of workers, whether between workplaces or Worker camp/congregate
13 >480
across jurisdictions, has initiated new chains of living for workers
transmission, for example: Shelters >23 >400
• Health care workers working at more than one
*Estimates are based on public information sources and likely
facility underestimate the true number of outbreaks and cases in these settings.
• Outbreak in northern Saskatchewan linked to
worker camp in Alberta
7 7Canada’s effective reproductive value (Rt) is trending close to 1
Rt is the time variable reproduction rate,
representing the average number of new
Rt values
3 infected people for each infected person.
2.5
The graph shows how the Rt has remained
below 1 for nearly 2 weeks suggesting public
2
health measures are being effective in
1.5 controlling the epidemic.
1 Fluctuations above and below 1 in the last
month reflect ongoing transmission in some
0.5
communities and settings across the country,
especially in and around Canada’s most
0
populous cities, Toronto and Montreal.
2020-03-20
2020-03-22
2020-03-24
2020-03-26
2020-03-28
2020-03-30
2020-04-01
2020-04-03
2020-04-05
2020-04-07
2020-04-09
2020-04-11
2020-04-13
2020-04-15
2020-04-17
2020-04-19
2020-04-21
2020-04-23
2020-04-25
2020-04-27
2020-04-29
2020-05-01
2020-05-03
2020-05-05
2020-05-07
2020-05-09
2020-05-11
2020-05-13
2020-05-15
2020-05-17
2020-05-19
2020-05-21
2020-05-23
2020-05-25
2020-05-27
2020-05-29
2020-05-31
R(t)
Based on data as of June 1, 2020
8Data driven models forecast short-term epidemic trajectory
97,990 to 107,454 cases by June 15 7,700 to 9,400 deaths by June 15
9,400
Cumulatively reported cases
107,454
Cumulative number of deaths
97,990
7,700
Days Days
Extrapolation based on recent trends
using a forecasting model (with ranges of uncertainty)Modelling is a tool to explore different scenarios
A series of models were used to generate a number of scenarios including three key scenarios: ‘no
control’, ‘weaker controls (delay and reduce the peak)’, and ‘stronger epidemic control’. This lets
us estimate the range of the population infected and the potential duration of the epidemic.
Stronger epidemic control models include: Weaker control models include:
• A high degree of physical distancing • A low degree of physical distancing
• A high proportion of cases identified • A low proportion of cases identified
and isolated and isolated
• A high proportion of contacts traced • A low proportion of contacts traced
and quarantined and quarantined
10Modelled scenarios show the impact of public health measures
Models help us identify which combinations of public health measures, applied with what intensity,
are most likely to reinforce epidemic control.
Stronger epidemic control Weaker controls (delay and
No control effort reduce the peak)
• high degree of physical 70% to 80% infected
distancing • low degree of physical distancing
• high % of cases and their • low % of cases and their contacts
contacts traced and isolated traced and isolated or quarantined
or quarantined
Number of new cases
25% to 50% infected
1% to 10% infected
Spring Summer Fall Winter Spring
2020 2021
11Core public health measures remain essential to control the epidemic
• Dynamic models show that when we lift restrictive population-based public health measures (e.g. business and
school closures, stay at home requirements), we must strengthen other core public health measures to maintain
epidemic control (e.g. personal physical distancing, detect and isolate cases, trace and quarantine contacts).
• Lifting population-based measures without strengthening other public health measures will likely cause the
epidemic to rebound.
Ease population-based measures Ease population-based measures
Strengthen other public health measures Insufficient other public health measures
Feb 7 April July Oct Feb 7 April July Oct
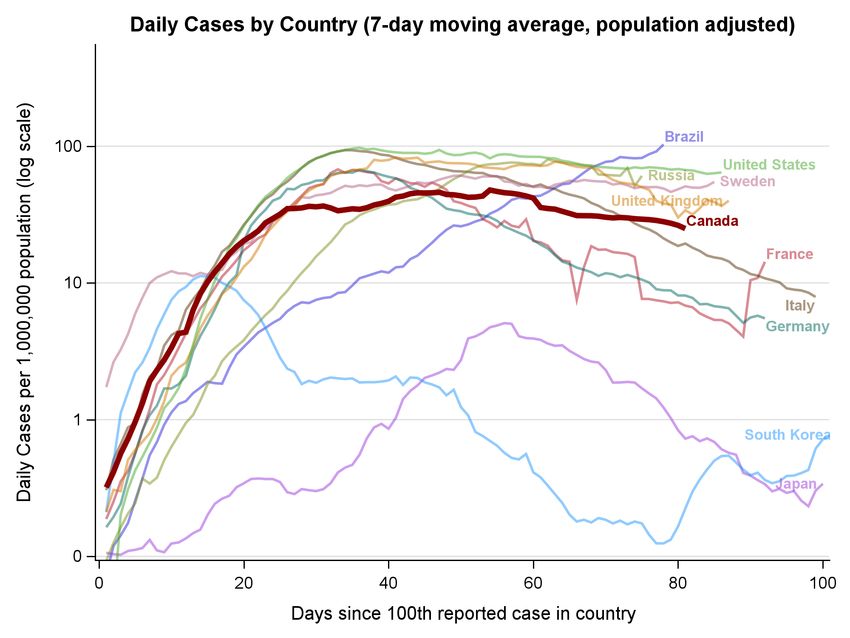
12We are learning from the experience of the global community
Canada flattened the curve sooner
than a number of countries such as
the UK, Italy and US.
Other countries such as South Korea
and Japan demonstrated strong
epidemic control to keep their curves
smaller overall.
All countries realise this is an
ongoing effort, requiring sustained
public health measures to avoid
resurgent transmission.
Data as of May 31, 2020 21:00
13Living with COVID-19 will require ongoing effort
Canada has made significant progress to bring the epidemic under control, thanks to the
commitment of Canadians who are following public health advice to protect themselves and others.
Until there is a vaccine or effective treatment, we must carefully balance the risks associated with
spread of COVID-19 with the unintended social and health consequences of restrictive public health
measures.
Jurisdictions across the country are taking a gradual, phased approach to increasing social and
economic activity with appropriate conditions and controls in place to minimise serious illness, death
and burden on the health care system. Priority areas include:
Rapidly identify and isolate cases, trace and quarantine contacts
Continue to increase health care and public health capacity
Provide high degree of protection for vulnerable populations and settings including supporting
workplaces
Engage communities to practice core personal public health measures
14Additional information
APPENDIX
15Monitoring COVID-19: Reproduction number (Rt)
• Rt is the time variable reproduction rate, representing the average number of new infected people for each
infected person
• If Rt is > 1 the epidemic is not coming under control
• If Rt is < 1 the epidemic might be controlled, but it might be just starting to come under control
• Rt does not say where you are on the curve
• Care should be taken when interpreting Rt values.
• Rt can dip below 1 transiently when the epidemic is not controlled due to variation in surveillance data
• Rt can also transiently go over 1 when the epidemic is controlled if there is a new outbreak that is rapidly brought
under control
• Reported cases are up to 2 weeks behind what is actually happening in transmission
• Given this, Rt < 1 is required for more than 3 weeks to be sure public health measures are controlling the
epidemic
16You can also read