Quarterly Investment Bulletin - Capita

Page created by Roberto Wagner
 
CONTINUE READING
Quarterly Investment Bulletin - Capita
Quarterly
Investment
Bulletin
June 2021
Quarterly Investment Bulletin - Capita
Contents   1. Equities
                             2. Nominal yields
                             3. Inflation
                             4. Real yields
                             5. Credit
                             6. Asset class performance summary
                             7. An Introduction to dynamic de-risking triggers

Owned by Capita                                                                  2
Quarterly Investment Bulletin - Capita
Global equities continued to rise over the quarter

   Figure 1: Equity market returns (rebased at 100) 1
                                                                                                                • Global equities generally continued to see improvements over the second
   150                         S&P 500 TR                                                                         quarter of 2021, with markets now comfortably ahead of pre-Covid-19 levels.
   145                         FTSE All Share TR
                               Eurostoxx 50 TR
                                                                                                                  All major indices made positive returns over the quarter, apart from Topix
   140
   135
                               Topix TR                                                                           which returned -0.3%.
                               MSCI Emerging Markets Index TR (USD)
   130
   125                                                                                                          • US equities posted a strong quarter of positive performance, rising by +8.5%.
   120                                                                                                            This means that the S&P 500 index is now up by +40.8% since the end of
   115                                                                                                            June 2020.
   110
   105
                                                                                                                • The FTSE All-Share index continued to see improved growth with returns of
   100
                                                                                                                  +5.6% over the quarter. The UK Equity market is now up by 21.5% since end
    95
    90
                                                                                                                  June 2020.

                                                                                                                • In the eurozone, the EuroStoxx 50 index returned +4.9% over the quarter.
   Source: Bloomberg, Capita                                                                                      European equities are now up by 28.2% since end June 2020.

     Equity Markets                                                           Percentage Change
                                                                                                                • In Japan, the Topix index fell slightly over the quarter, returning around -0.3%.
                                                                                                                  However, the Japanese equity market is up +27.3% since the end June 2020,
     Index                                               30/06/2021 (Price)    1 Month     1 Quarter   1 Year
                                                                                                                  similar to European equities.
     S&P 500 (TR)
                                                                 8943           2.3%         8.5%      40.8%
     FTSE ALL-Share (TR)
                                                                 7852           0.2%         5.6%      21.5%    • In emerging markets, the MSCI Emerging Markets Index returned +5.0% over
     EuroStoxx 50 (TR)                                                                                            the quarter. Emerging Market Equities are now up +40.9% since the end of
                                                                 8931           0.7%         4.9%      28.2%
     Topix (TR)
                                                                                                                  June 2020, similar to US Equities.
                                                                 3071           1.2%        -0.3%      27.3%
     MSCI Emerging Markets Index TR (USD)
                                                                 671            0.2%         5.0%      40.9%

   Source: Bloomberg, Capita |   1 Total   returns in local currency

Owned by Capita                                                                                                                                                                                       3
Nominal gilt yields fall slightly across the curve during the quarter

                                        Figure 2: Nominal term structure of gilts                                                                         Figure 3: 10-year and 30-year nominal yields
                                       2.5                                                                                                                 1.6                                Nominal Gilt Yield - 30-year
                                                                                                                Gilt Yield Curve 30-Jun-21                 1.4                                Nominal Gilt Yield - 10-year
                                       2.0
   Redemption Yield %

                                                                                                                                                           1.2
                                                                                                                Gilt Yield Curve 31-Mar-21
                                                                                                                                                           1.0
                                       1.5

                                                                                                                                                  Yield
                                                                                                                                                           0.8
                                                                                                                                                           0.6
                                       1.0
                                                                                                                                                           0.4
                                                                                                                                                           0.2
                                       0.5
                                                                                                                                                           0.0

                                       0.0
                                             0                                     10                      20                                30
                                                                                        Maturity (yrs)                                                    Source: Bloomberg, Capita

                                                 0

                                              -2
                                                                                                         Rise in both gilts yields and growth assets over the year presents opportunities
                        Change (bps)

                                              -4                                                         • Nominal gilt yields decreased slightly across all maturities, over the second quarter of the year.
                                              -6                                                         • The funding level improvements that were seen over the first quarter of 2021 have maintained at a similar level
                                              -8
                                                                                                           due to the continued rally in growth assets.

                                             -10                                                         • As a reminder, this has presented an attractive de-risking opportunity for some schemes as they have found
                                             -12
                                                                                                           themselves ahead of where they expected to be on their Journey Plan.
                                                     2       5          10        15      20        30
                                                                                                         • This is especially true for schemes with relatively low levels of liability hedging (LDI).
                                         Gilt Yield Change       Maturity (yrs)
   Source: Bloomberg, Capita
                                                                                                         • Trigger-based dynamic de-risking strategies, where funding levels are tracked daily and pre-agreed de-risking is
                                                                                                           undertaken when triggers are hit, are often the most efficient way to capture temporary de-risking opportunities.
Owned by Capita                                                                                                                                                                                                              4
Future inflation expectations broadly unchanged
   Realised (past) inflation rises over the quarter

                            Figure 4: Gilt-Implied Future Inflation Expectations 2                                                                                                     Figure 5: Realised (past) CPI in the UK, US and Eurozone
                            4.0
                                                                                                                                                                                       6.0
                            3.5                                                                                                                                                                                                                                         UK (CPI)                       UK (RPI)
    Breakeven Inflation %

                                                                                                                                                                                       5.0
                            3.0
                                                                                                                                                                                                                                                                        Eurozone (CPI)                 US (CPI)
                                                                                                                                                                                       4.0
                            2.5

                                                                                                                                                                         Change in %
                            2.0                                                                       Breakeven Inflation Curve 30-Jun-21                                              3.0

                            1.5                                                                                                                                                        2.0
                                                                                                      Breakeven Inflation Curve 31-Mar-21
                            1.0
                                                                                                                                                                                       1.0
                            0.5
                                                                                                                                                                                       0.0
                            0.0
                                  0                                     10                                                 20                                 30                       -1.0
                                                                                      Maturity (yrs)

                                                         8                                                                                                                                                                                                                                                 Source: Bloomberg, Capita
                                                                                                          Breakeven inflation
                                                         6                                                Change

                                                         4
                                                                                                                                                           Inflation
                                                                                                                                                           • Future inflation expectations maintained at around the same level as the end of June
                                         Change (bps)

                                                         2
                                                         0                                                                                                   2021 causing little effect to each maturity, with the biggest effects for the middle
                                                         -2                                                                                                  turns. This has acted to keep pension scheme liabilities at around the same levels.
                                                         -4
                                                         -6                                                                                                • Realised (past) UK CPI inflation rose over the quarter from 1.0% as at end of March
                                                         -8                                                                                                  (as restated) to 2.1% at end of the quarter 3. Realised UK RPI, however, was up to
                                                        -10                                                                                                  3.3% compared to 1.5% for the end of the previous quarter (as restated).
                                                              2            5           10            15           20            30
                                                                                       Maturity (yrs)

                                                                  Source:               2   Gilt breakeven inflation has been calculated as the
                                                                  Bloomberg, Capita         difference between nominal Gilt yields and real Gilt yields.

                                                                                                                                                               3 At the publication date of this bulletin, the ONS had not yet announced the end June CPI and RPI rates so we have used end May figures as the
Owned by Capita                                                                                                                                                  latest available.                                                                                                                                          5
Real yields decrease across most of the curve

                                                   Figure 6: Gilt real yield4 term structure                                                                                                        Figure 7: 10-year and 30-year real yields                   Source: Bloomberg, Capita

                                                  0.0                                                                                                                                                0.0
                                                  -0.5                                                                                                                                               -0.5
                    Real Redemption Yield %

                                                                                                      Gilt Real Yield Curve 30-Jun-21                                                                                                                   Gilt Real Yield - 30-year
                                                  -1.0                                                                                                                                               -1.0
                                                                                                                                                                                                                                                        Gilt Real Yield - 10-year
                                                                                                      Gilt Real Yield Curve 31-Mar-21
                                                  -1.5                                                                                                                                               -1.5

                                                                                                                                                                                            Yield
                                                  -2.0                                                                                                                                               -2.0
                                                  -2.5                                                                                                                                               -2.5
                                                  -3.0                                                                                                                                               -3.0
                                                  -3.5                                                                                                                                               -3.5
                                                         0                                   10                                         20                                          30
                                                                                                  Maturity (yrs)

          10
                                                                           Gilt Real Yield
                                                                                                     Real Gilt                               Maturity Points (yrs)
               5
                                                                           Change
                                                                                                     Yields
                                                                                                                                                                                                    Real yields
                                                                                                                           2             5          10          15          20       30
                                                                                                  Current % as at
                                                                                                                                                                                                    • Real gilt yields remain negative for all maturities.
Change (bps)

               0                                                                                                         -2.27        -2.92       -2.62       -2.40       -2.27     -2.06
                                                                                                  30/06/2021
                                                                                                  1 Month Change                                                                                    • Real yields fell slightly across all maturities, except 5 years, and
               -5                                                                                                          4            20           4          -1           4       4
                                                                                                  (bps)                                                                                               are still at similar levels to last quarter across most of the curve.
                                                                                                  1 Quarter Change
     -10                                                                                                                   -7            7          -2          -2          -7      -12
                                                                                                  (bps)
                                                                                                  1 Year Change
                                                                                                                           25           -18         21          31          25       28
     -15                                                                                          (bps)
                                              2      5        10      15       20       30
                                                                                                  Source:                   4 Gilt real yield has been calculated as the yield on
                                                             Maturity (yrs)                       Bloomberg, Capita             index-linked Gilts

                Source: Bloomberg, Capita

Owned by Capita                                                                                                                                                                                                                                                                             6
Corporate bond spreads largely unchanged over the quarter

                              Figure 8: GBP corporate bond spreads over gilts by rating                                               Figure 9: GBP corporate bond spreads over gilts by rating
                              (change over month/quarter/year)                                                                        (historic)
                               10              4.6                                                                                                             4.0                     Over 15 Year AAA Credit Spread
                                         2.8

                                                                                                                                      (+15 Yr Gilts Index) %
                                                                                                                                       Premium over Gilts
                                0                                                                                                                              3.5                     Over 15 Year AA Credit Spread
                                                                    -2.0   -2.0           -2.3                                                                                         Over 15 Year A Credit Spread
       Credit Spreads (bps)

                              -10                                                                -3.6           -5.0   -6.7                                    3.0
                                                                                                                                                                                       Over 15 Year BBB Credit Spread
                              -20                    -16.9                        -17.3                                                                        2.5

                              -30                                                                                                                              2.0
                                               1 Month Movements
                              -40                                                                                                                              1.5
                                               1 Quarter Movements                                      -43.9                                                  1.0
                              -50
                              -60                                                                                                                              0.5
                                               1 Year Movements
                              -70                                                                                                                              0.0
                                                                                                                              -66.4
                                               AAA                         AA                     A                    BBB                                       Jun 16     Jun 17               Jun 18               Jun 19   Jun 20   Jun 21

                              Source: Bloomberg, Bank of America Merrill Lynch, Capita
                                                                                                                                                   Source: Bloomberg, Bank of America Merrill Lynch, Capita

Owned by Capita                                                                                                                                                                                                                                  7
Asset class performance summary in local currency and GBP
                                                                                                 Asset Class                                               Quarter Return         1 Year Return

                                                                                                 FTSE All Share TR                                                5.6%               21.5%
       Asset class performance summary                                                           S&P 500 TR (Local, GBP)                                       8.5%, 8.5%         40.8%, 26.3%
       • The charts below and the table to the right show the one-quarter                        Eurostoxx 50 TR (Local, GBP)                                  4.9%, 5.8%         28.2%, 21.2%
         and one-year performance in local currency and GBP of                                   Topix TR (Local, GBP)                                       -0.3%, -0.8%         27.3%, 10.9%
         investments in major asset classes to the end of June 2021.
                                                                                                 MSCI Emerging Markets Index TR (USD, GBP)                     5.0%, 4.4%         40.9%, 23.9%

       • Over the quarter, US equities was the best performing asset                             FTSE A GILT +15 Yrs                                              3.2%               -10.9%
         class.                                                                                  iBoxx Non-Gilt £ 10+ TR                                          3.1%                0.7%

                                                                                                 FTSE A ILG +5 Yrs                                                3.9%               -4.4%

                                                                                                 FTSE 350 Real Estate Index                                       7.9%               21.2%

                                                                                                 Morningstar Diversified Alternative Index TR                     2.1%                2.8%

                                                                                                 Bloomberg All Hedge Fund Index                                   0.3%                6.3%
                                                                                               Total returns in local currency, GBP | Source: Bloomberg, Capita

       Quarter Return                                                                      1 Year Return
                                     FTSE All Share TR                                                                  FTSE All Share TR
                              S&P 500 TR (Local, GBP)                                                           S&P 500 TR (Local, GBP)
                         Eurostoxx 50 TR (Local, GBP)                                                       Eurostoxx 50 TR (Local, GBP)
                                 Topix TR (Local, GBP)                                                              Topix TR (Local, GBP)
            MSCI Emerging Markets Index (USD, GBP)                                           MSCI Emerging Markets Index (USD, GBP)
                                  FTSE A GILT +15 Yrs                                                                FTSE A GILT +15 Yrs
                                iBoxx Non-Gilt £ 10+ TR                                                           iBoxx Non-Gilt £ 10+ TR
                                     FTSE A ILG +5 Yrs                                                                  FTSE A ILG +5 Yrs
                           FTSE 350 Real Estate Index                                                         FTSE 350 Real Estate Index
            Morningstar Diversified Alternative Index TR                                     Morningstar Diversified Alternative Index TR
                      Bloomberg All Hedge Fund Index                                                    Bloomberg All Hedge Fund Index
                                                      -2%   0%   2%   4%   6%   8%   10%                                                       -20%     -10%      0%        10%   20%     30%     40%   50%
                     Source: Bloomberg, Capita                                                 Source: Bloomberg, Capita
                                                                                                                                                                                                              8
Owned by Capita
An introduction to dynamic de-risking triggers

                                                                                                                  Monitoring with intent
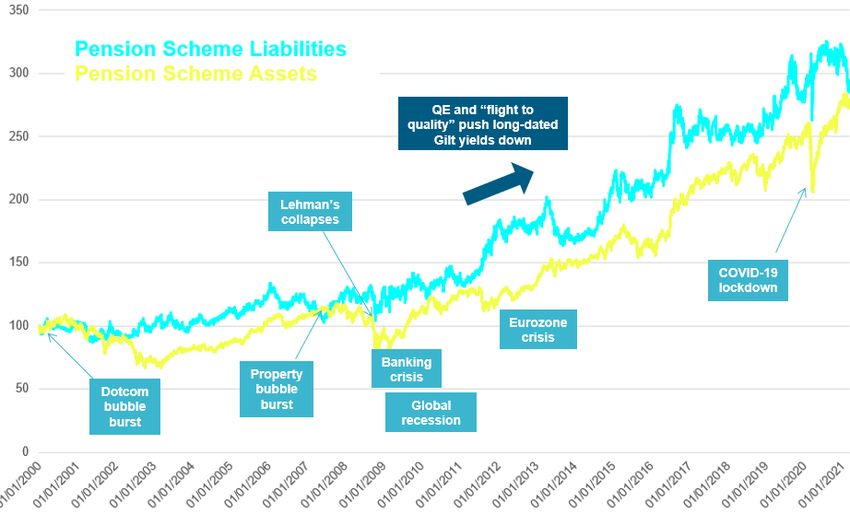
                                                                                                                  • Introducing a dynamic de-risking framework will
Some schemes have missed short-lived opportunities when   Schemes invested in equities experience funding level     try to make sure that de-risking takes places
    assets and liabilities have moved close together            outcomes which differ from projections              at the optimal times in a pension scheme’s
                                                                                                                    journey, rather than being reviewed triennially.
                                                                                                                  • In conjunction with the scheme actuary, we can
                                                                                                                    monitor a scheme’s funding level and risks daily
                                                                 Opportunities to de-
                                                                        risk
                                                                                                                    using the PFaroe technology.
                                                                                                                  • We can implement a trigger based de-risking
                                                                                                                    framework, which takes risk off by moving
                                                                                                                    from growth assets to matching only as the
                                                                                                                    funding position improves, based on a
                                                                                                                    funding-level information feed. Triggers are
                                                                                                                    monitored daily.
                                                                                                                  • We can also provide quarterly monitoring reports
                                                                                                                    which show the position of a scheme versus the
                                                                                                                    agreed triggers.

                                                                                                                                                                       9
    Highly Confidential – Owned by Capita                                                                                                                                  9
“We have been using Capita’s daily de-risking trigger service for over five years. Our scheme has three
                                                               sections and in 2020 we were able to purchase annuities for all the liabilities in one section of the scheme due to
            Dynamic de-risking                                 the de-risking actions we had taken. The trigger framework is clear and when a trigger is hit, advice is given by
                                                               the investment consultant with the confirmation of the scheme actuary.
            triggers – case study                              This gives us the comfort to act and implement the pre-agreed investment switches. The other two sections
                                                               remain on triggers and both are close to their next trigger. The service gives us confidence that if a short term
                                                               market event leads to an unexpected improvement in funding, we are ready to act.”
                                                               Chair of Trustees
A client of £19.5m in assets and approximately 650
members wanted to look at a dynamic trigger mechanism.

We performed the initial analysis to set up triggers based
on the 2011 actuarial valuation. The trigger plan was
agreed in 2012. At that point, the solvency level was
approximately 60%.

We agreed a series of 8 triggers to get to fully funded on a
low risk basis by 2021. The aim was to then move to 100%
in gilts. This was revised later on as buyout came within
range to be an approximate portfolio to better match
annuity prices.

Between 2013 and 2016 a number of triggers were hit. We
then produced revised analysis following a new actuarial
valuation, which allowed us to reset triggers, with only 3
triggers remaining – still with the aim of targeting full-
funding on a low risk basis by 2021.
                                                                                                                                       100%

                                                                                                                    Asset Allocation
In 2018 the final trigger was hit and buyout was within                                                                                80%                                         Gilts
reach. Improvements in funding then allowed the plan to                                                                                60%                                         Corporate
buy out completely in 2020, with the final assets being                                                                                                                            Bonds
                                                                                                                                       40%                                         DGF
transferred to an annuity provider.
                                                                                                                                       20%
                                                                                                                                                                                   Equities
                                                                                                                                        0%

                                                                                                                                                                                               10

                                                                                                                                              Required Return (above Gilts) p.a.
Highly Confidential – Owned by Capita
Contacts and regulatory statement

                                                       Lydia Fearn                                                                                       Joel Riddaway
                                                       Head of Pensions Consulting                                                                       Senior Investment Analyst
                                                       Email: Lydia.Fearn@capita.com                                                                     Email: Joel.Riddaway@capita.com

   Regulatory statement

   The information contained within this presentation does not constitute financial advice.
   The information provided is based on our understanding of current law and taxation as at the date of this report.
   HMRC policy, practice, and legislation may change in the future.

   Capita Pension Solutions Limited is part of Capita plc www.capita.com. Registered in England and Wales No. 02260524. Registered office 65 Gresham Street London EC2V 7NQ. Capita Pension Solutions
   Limited is authorised and regulated by the Financial Conduct Authority 2021 Capita plc. All rights reserved

   2021 Capita plc. All rights reserved.

                                                                                                                                                                                                        11
Owned by Capita
Owned by Capita   12
You can also read