Managing Road Safety & Collisions An Update on Progress - Brian Farrell, Communications Manager - lasntg
←
→
Page content transcription
If your browser does not render page correctly, please read the page content below
Managing Road Safety & Collisions
           An Update on Progress

Brian Farrell, Communications Manager   9 May 2019
The RSA exists to save lives

   Our Vision                                                       Our Mission
   ‘The Road Safety Authority is recognised as the leading          The aim of the Road Safety Authority is to save lives
   voice for road safety nationally and a leading voice             and prevent injuries by reducing the number and
   Internationally, driving change in attitudes and behaviours in   severity of collisions on our roads.
   road users, collaborating with key stakeholders, to save
   lives.’

The RSA exists to save lives

   Our purpose
   For the general public
   We research, educate and intervene to ensure that all road users are safer, year on year. We do this by challenging
   and changing attitudes to road safety in order to reduce high-risk, dangerous behaviour on our roads.

   For road users
   We set standards, we set out training, we test and we provide feedback so that road users can achieve an acceptable
   level of competence, that vehicles are at an acceptable level of safety such that road users can be confident about
   their own safety and the safety of others in their use of the road.

   For professional drivers and business operators
   We establish a regime to protect road users, drivers, commercial and public enterprises from the hazards of defective
   vehicles and poor commercial driving practices to ensure their road users and the commercial enterprise is not
   impacted negatively.

   For victims, victim organisations and those impacted by collisions
   We advocate to reduce the personal, family, community and societal impact of death and injuries on our roads.
Governance
How we are organised

      Road Safety, Driver                  Driver Testing and                     Vehicle Standards and
      Education and                        Licensing                              Enforcement
      Research                             ‘Our purpose is to set and             ‘Our purpose is to set
      ‘Our purpose is to educate           assess driving standards,              standards for vehicles, test
      and protect road users by            promote remedial training              against minimum standards
      improving their knowledge,           and licence drivers                    and support compliance
      skills and behaviours as             according to entitlements’             amongst commercial vehicle
      they move through life’                                                     drivers and operators and
                                                                                  enforce where necessary’

        Finance and Commercial Services, Human Resources (HR) and Information and
                           Communications Technology (ICT)
      ‘Our purpose is to ensure that the operation of the RSA is enabled; efficiently, effectively and sustainably’
Our services 2018                                                    4.7 million population

2.7m Licence Holders                 2.4m Vehicles                  Education                  24 RSA Enforcement
                                                                   and Training                      Officers
   684,000 licences,          1.34 million National Car Test
 162,000 driver tests,                    (NCT),               825,000 hours education         18,000 Roadside vehicle
                               493,000 Commercial Vehicle        interactions annually,               inspections
 130,000 theory tests,
                                Roadworthiness Tests (CVRT)     1,758 Registered ADI’s,          1,500 drivers’ hours’
20,000 digital tachograph
         cards,                                                1,014Driver CPC trainers,              inspections

 77,795 Driver CPC card                                         650,000 EDT lessons            150 prosecutions initiated
         holders                                                  completed in 2015,
                                                                  6,218 IBT lessons
                                                                  completed in 2015

                                           Number of Service Centres
                   Theory Test 41;     Driver Testing 52; NDLS 36; NCT 46;                 CVRT 144
Figures relate to 2018
Road Safety Interactive
Education Initiatives
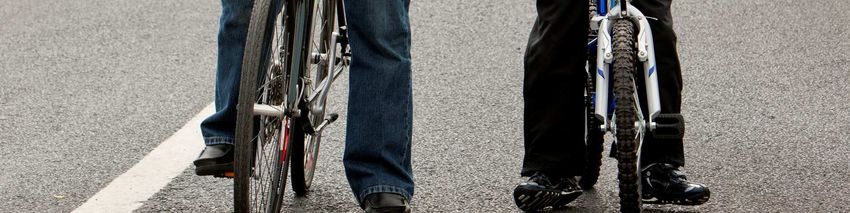
Check it Fits Streetsmart Mobile Education Unit - Shuttle Roll Over Simulator
8,429 Checks 13,026 Participants 150,235 Visitors 53,131 Participants
National Road Safety Education
Education Programmes Leaflets / Booklets Distribution High Visibility Distribution
Service
5,231 Deliveries 217,949 Distributed 773,064 Items
9,192 Contact Hours
Government Road Safety Strategy
Government Road Safety Strategy
        2013 to 2020

• The 4th Government Road Safety Strategy runs Governance
                                               from 2013-2020.
• RSA is the Strategy “Owner”
• High Level Quarterly Ministerial Review.
• Mid-term review
• Target 124 deaths or fewer by 2020
There were 146 fatalities in 2018, Ireland’s safest year
Performance Versus Target   on record. This represents 30 deaths per million
                            population.

                            To reach 124 fatalities by 2020, a 16% decline in
                            fatalities is required from 2018 to 2020.

  10
Government Road Safety Strategy
Local Authority Actions
Actions Responsibility Due Date
Establish a Road Safety Working Together CCMA Q4 2013
Group(RSWTG) in each Local Authority area to co-
43
ordinate multi-agency road safety policy and
implementation at a local level.
Each Local Authority RSWTG to publish a multi-agency CCMA Annually
44 Road Safety Action Plan and to publish an annual
review on progress with implementation.
Implement safety schemes at high risk locations on LA's Annually
54 regional and local roads.
Each Local Authority to publish/renew their prioritised LA's / CCMA Annually
58 plan on road building construction and maintenance
on an annual basis.
11Government Road Safety Strategy
Local Authority Actions
• Mid Term Review of Road Safety Strategy – New Actions
Action 35 – Review the feasibility of extending the number of 30km/h
zones in VRU rich locations (urban city / town centres), in
consultation with UK experts on best practice models in place in
the UK and internationally
Agency - CCMA
Delivery - Q4 2018
12Progress since first
Government Road
Safety Strategy
600
500
458
413 415 411
396
400 376 374 365
338
Fatalities
335
300 279
238
212
186 188 193 185
200 163 162 156 146 Target
124
-20.3% +9% -55.3% -10.4%
100
1998 - 2002 First Road Safety 2004 - 2006 Second
2007 - 2012 Third RSS 2013 - 2020 Fourth RSS
Strategy RSS
4th
RSS
0
1998 1999 2000 2001 2002 2003 2004 2005 2006 2007 2008 2009 2010 2011 2012 2013 2014 2015 2016 2017 2018 2019 2020
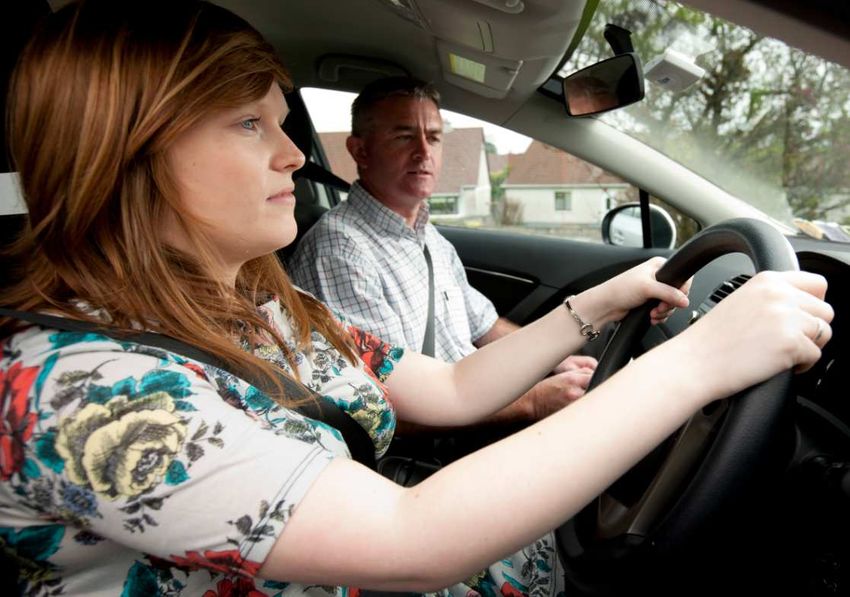
FataliltiesRoad deaths per million inhabitants in the EU28 - 2018 2nd
Contributory Factors

                  Excessive &
No Seatbelt                             Distracted Driving   Driver Fatigue
                  Inappropriate Speed

Drink Driving          Drug Driving     Drunk Pedestrians    Vehicle Factors
Fatal Collisions 2008-2012
Pre Crash Reports
Report is based on an analysis of the completed Garda investigation file where the full
circumstances of the collisions are available. Access was granted by An Garda Síochána to the
completed Investigation File produced for each collision. The file contains two main reports:
1. An Garda Investigation Report
2. Forensic Collision Investigation Report
So far, four reports have been completed:
• Speed
• Vehicle Factors
• Alcohol Report in Co-Operation with Medical Bureau of Road Safety
• MotorcyclistsSummary of Vehicle Factor Report
Summary of Findings
Speed as a factor in Fatal Collisions
Half of the Over Half The Top Five 43% of the The Majority The Primary The Main
Drivers (55.8%) of the Counties Collision (91%) of the Trip purpose Action
collisions where where most where 274 drivers was social indicated for
(both male and
excessive speed collisions had excessive speed were male. (84%). the culpable
female) were
was cited as a excessive speed was a factor driver was loss
aged between
contributory cited as a factor occurred of control of
16 to 24 years.
factor involved were Donegal between 9pm the vehicle
a single vehicle (8.4%), Cork and 4am. (70%).
only. (8%), Wexford
(8%), Cavan
(7%) and
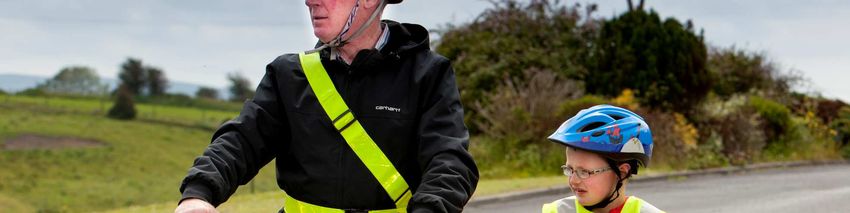
Galway (7%).Summary of Findings
Motorcyclist Report
98% Male 50% of the 86% on social Over half 60% of the Almost half Almost a third
motorcyclists trip (56%) of the fatal collisions (49%) of the (29%) of all
were aged fatal collisions involving a 93 collisions motorcyclists
between Over half involving a motorcyclist had excessive involved in the
25-34. (56%) occurred motorcyclist occurred on a speed as a 93 fatal collisions
on a Saturday occurred regional road contributory had consumed
or Sunday. between 12pm and a quarter factor. alcohol.
Sunday alone and 7pm. (26%) on a Sunday alone
accounting for national road. accounting for
a third (33%). (33%)Where
Vehicle Factors Speed Alcohol Motorcyclists
The county where the The top three Of all 330 Of all 93 collisions,
largest proportion of counties where most collisions, Cork, Gal Cork, Dublin,
culpable drivers collisions had speed way, Dublin and Galway, Kerry,
which had defective cited as a factor were Donegal accounted Limerick and
tyres on their vehicles Donegal (8.4%), Cork for over a third Tipperary
was Donegal (18.2%). (8%) and Wexford (36%) of all accounted for 44
Followed by (8%). However, collisions where (47%) of all fatal
Cork, Kerry and counties Cavan and alcohol was a collisions involving
Wexford (9.1% each). Galway has similar contributory factor a motorcyclist.
levels.Road Fatalities 2018
Road Fatalities 2018

23
Road Fatalities 2019

                DRIVER       PEDESTRIAN   PASSENGER   MOTORCYCLIST+   CYCLIST   TOTAL

  2018           26             14           7             1            6        56

  2019           34              8           7             4            3        54

                 +8             -6            -            +3           -3       +2
DIFFERENCE

 24
Thank You.
Fatalities Per 100,000 Population

   26
You can also read