Adaptive Signal Control Technology Research in Illinois - Kyle Armstrong, Ray Benekohal, Hongjae Jeon

Page created by Ivan Larson
 
CONTINUE READING
Adaptive Signal Control Technology Research in Illinois - Kyle Armstrong, Ray Benekohal, Hongjae Jeon
Adaptive Signal Control Technology
        Research in Illinois
      Kyle Armstrong, Ray Benekohal, Hongjae Jeon
Adaptive Signal Control Technology Research in Illinois - Kyle Armstrong, Ray Benekohal, Hongjae Jeon
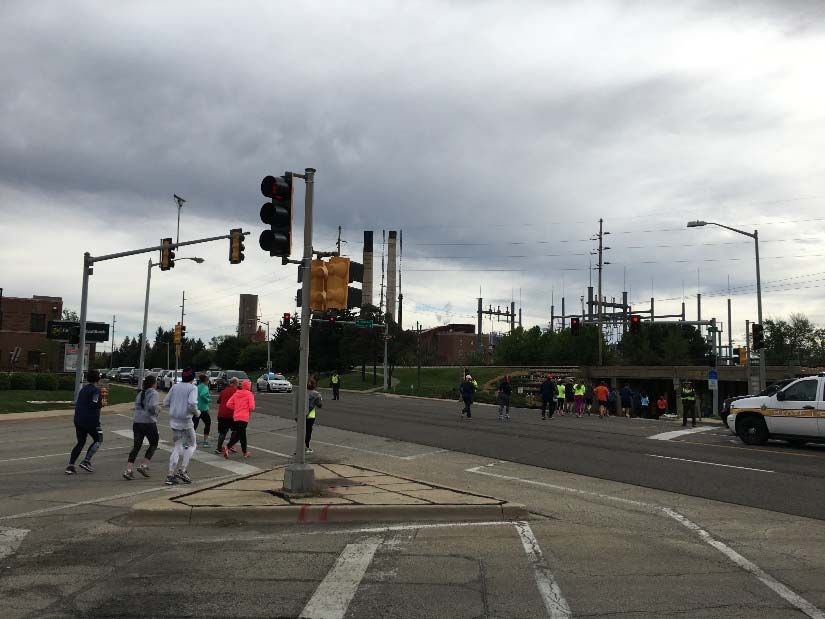
Overview
•   ASCT Overview and Installation
•   First Year After Implementation Results
•   Final Year (TBC 2017 and ASCT 2017) Results
•   Safety Analysis
•   Travel Time and Speed
•   System Response to Heavy Volume and Special Events
Adaptive Signal Control Technology Research in Illinois - Kyle Armstrong, Ray Benekohal, Hongjae Jeon
What is Adaptive Signal Control Technology
(ASCT)?
 Continuously adjusts timings to accommodate real-time
  changes in traffic patterns and improve traffic flow

 Several products with different methodologies

 Some systems may only require software upgrades while
  others may require additional controller and detection
  hardware
Adaptive Signal Control Technology Research in Illinois - Kyle Armstrong, Ray Benekohal, Hongjae Jeon
Benefits of ASCT
 Improves travel times through coordinated signal systems
 Adaptability to sudden changes in traffic patterns
 Reduce number of vehicle stops and wait times
 Reduce fuel consumption
 Reduced number of crashes?
Purpose of ASCT Research
 Determine if there is a reduction in crashes due to ASCT
  implementation (rear-end crashes & left turn crashes)

 Develop a Crash Modification Factor (CMF) for ASCT
  implementation

 Measure improvements in traffic flow and efficiency
Research Overview
 Initially 3-year project beginning in 2013

 Phase 1 – Select test site, perform systems engineering
  analysis, collect pre-implementation data

 Phase 2 – Purchase and install ASCT system, post-
  implementation data, develop benefit-cost and CMF
  information
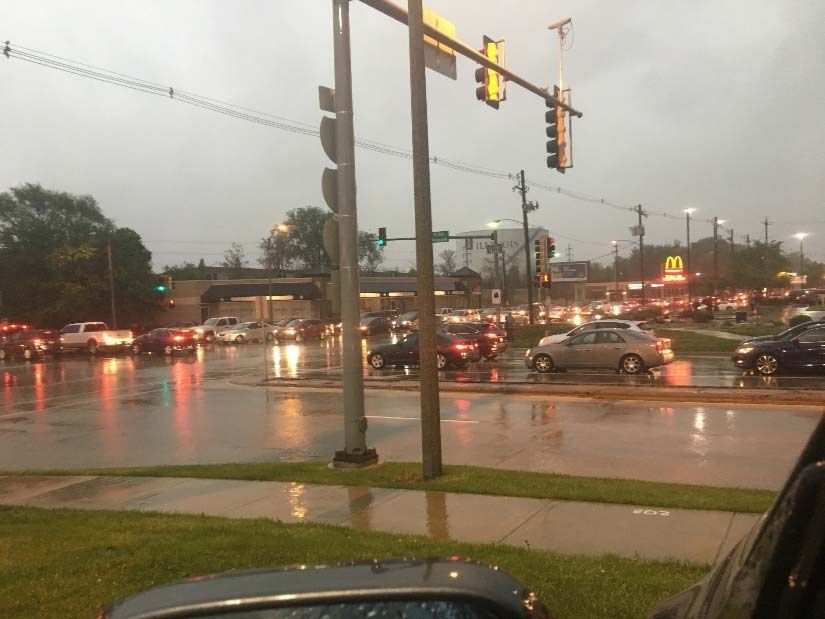
ASCT Installation
   Selected Neil St. corridor in Champaign

   Performed systems engineering analysis based on the needs of the Neil St. corridor
    to help select ASCT system

   Trafficware SynchroGreen system selected

   Installed April 2015 with full acceptance November 2015

   System required video detection installation

   Allowed vendor to adjust detection and timing programs

   Improved version installed April 2017
Performance Indicator (PI)
 Examined changes in volume, delay and queue individually (with
  97% confidence level)
 Then, considered volume, delay, and queue length combined
  and called it PI (with 91% confidence level)
 PI is:
   • Improved (Imp)
   Example: Delay and queue decreased with volume increase significantly
   • Unchanged (Unch)
   Example: Volume, delay, and queue remained unchanged
   • Deteriorated (Det)
   Example: Delay and queue increased without volume increase significantly
First Year After Implementation Results
                             (2013 vs 2015)
Total 83 approaches from 6 intersections in 4 time periods
   4*[(4*4 + 1*3 + 1*2)]=84, minus off-peak of Windsor due to video failure
 Traffic volume
    33% increased, 65% unchanged, and 2% decreased significantly
 Delay
    17% increased, 72% unchanged, and 11% decreased significantly
 Queue length
    22% increased, 60% unchanged, and 18% decreased significantly
First Year After Implementation Results
                         (2013 vs 2015)
 Performance Indicator (PI)
    41% improved, 30% unchanged, and 29% deteriorated

PI on Major-street
    34% improved, 26% unchanged, and 40% deteriorated
 PI on Minor-street
    50% improved, 36% unchanged, and 14% deteriorated

ASCT seemed to make a compromise between the minor- and
major-street
Final Year Implementation Results
                 (2017 TBC vs 2017 ASCT)
Total 56 approaches from 5 intersections in 3 time periods
   3*(4*4+1*3)=54, but one lane group was excluded due to insufficient volume
 Traffic volume
    7% increased, 72% unchanged, and 21% decreased significantly
 Delay
    56% increased, 40% unchanged, and 4% decreased significantly
 Queue length
    35% increased, 65% unchanged, and 0% decrease significantly
 Performance Indicator (PI)
    5% improved, 32% unchanged, and 63% deteriorated
Final Year Implementation Results
                    (2017 TBC vs 2017 ASCT)
 PI on Major-street
        7% improved, 30% unchanged, and 63% deteriorated
 PI on Minor-street
        4% improved, 35% unchanged, and 61% deteriorated
 35 out of 56 cases were deteriorated
• For 20 out of 35 cases could be explained, even though that does not justify
   the system performance deterioration
      Unfavorable arrival types (8 cases), Insufficient response to volume increase (3
       cases), Signal-timing changes (6 cases), Increase in proportion of vehicles
       stopped (13 cases). Some cases had more than one explanation
•   For 15 cases no reasonable explanation
Comparison between First Year and Final Year
      56 cases that were in the first year and final year
                    First year after                                    Final year

                                       15                                            18

                                                                   35
               18
                                       23                                             3

Deteriorated          Improved          Unchanged   Deteriorated         Improved    Unchanged
Comparison between First Year and Final Year
  16 deteriorated cases are common in both first year after and
   final year
  19 cases are only deteriorated in final year

                                        Only Deteriorated in the
                                        final year

          2    16          19
Comparison between First Year and Final Year
  in 8 of the 19 cases, some explanation for deterioration was
   found, though the deterioration is not justified
        Unfavorable arrival types
        Signal-timing changes
        Increase in proportion of vehicles stopped   8       11

  No explanation for the remaining 11
Worsening in the Final Year
 If it was Imp. in the first year and Unch. in the final year, it is
  considered a worsening case.
     PI improved in the first year after implementation (23 cases)
     PI unchanged in the final year (18 cases)
     7 cases satisfy both condition            Additional worsening cases

                                16          7        11

                First year after improved       Final year unchanged
Safety Analysis
  Quantify safety effects of ASCT system by developing   CMF
   Data                       Data
Acquisition                 Processing

                 SPF                     Before-After
              Calibration                   Study
                                                             Crash
                                                           Modification
                                                             Factor
Safety Report
 Before & after study applying Empirical Bayes method
 Safety Performance Functions (SPF) were calibrated to local
  conditions.
    Highway Safety Manual:
        Multiple vehicle total crashes
        Multiple vehicle fatal and injury (FI) Crashes
        Multiple vehicle property damage only (PDO)
    Illinois Specific SPF
        Fatal, type A, and type B injury crashes (KAB)
        Type A injury Crashes only
        Type B injury crashes only
Before and After Study
 Before period: 2012-2014 (36 months)
 After Period: May 2015 – Oct 2016 (18 months)
 Data requirements for SPF calibration by HSM procedures:
      AADT of major and minor roads per intersection
      Approaches with left-turn lanes
      Intersection left-turn signal phasing (protected/permissive)
      Approaches with right-turn lanes
      Approaches with right turn on red prohibited
      Presence of lighting
      Presence of red-light cameras
      Available pedestrian data
Before and After Study Results
         Four-Legged Intersection (Only) CMF Results
                                                Standard
          Crash Severity       CMF
                                                  Error
              Total            1.00               0.16
                FI             0.67               0.23
              PDO              1.09               0.20

Project level CMF (All Intersections) for Multiple-vehicle Crashes
                                                Standard
          Crash Severity       CMF
                                                  Error
              Total            0.96               0.15
                FI             0.67               0.22
              PDO              1.04               0.18
Before and After Study Results
             Paired T-test Results for Crash Types and Severities
    Crash        Avg. Difference per intersection
                                                    p-value           Interpretation
 Type/Severity         (crashes/18month)

    Angle                    -0.25                  0.67      Decreasing trend, not sig.
  Rear End                  -0.083                  0.923     Decreasing trend, not sig.
  Sideswipe
                                0                   1.00             No change
Same Direction
   Turning                      0                   1.00             No change
   Type A                     -0.5                  0.22      Decreasing trend, not sig.
   Type B                       0                   1.00             No change
   Type C                    -0.58                  0.44      Decreasing trend, not sig.
Safety Results
 Fatal and injury crashes showed decreasing trend (CMF
Travel Time
  Travel-time data was collected using GPS
  Two sets of runs were collected with TBC
  Two sets were collected with ASCT
                  Data Collection Days and Number of Runs
     Year               Day of Data Collection             AM         OP         NP         PM
                                                      SB    NB   SB    NB   SB    NB   SB    NB
  2014 (TBC)        Oct 28-29; Nov 18-19; Dec 3-4     24    24   16    16   17    16   17    15
 2016 (ASCT)        March 16, 30-31; April 7, 12-13   19    19   17    18   17    18   20    21
  2017 (TBC)               March 9; 15-16             8     8     -     -    9     9   12    12
 2017 (ASCT)                April 12;18-19            8     8     -     -   7     7    11    11

2015 (Feedback)          May 5-7; July 14-15          20    20   18    18   19    19   20    20
Travel Time
 Three main comparisons were performed:
    Travel time data from 2014 (TBC) vs 2016 (ASCT)
    Travel time data from 2017 (TBC) vs 2017 (ASCT)
    Travel speed data from 2017 (TBC) vs 2017 (ASCT)
 The “preferred” directions were:
    NB in AM peak (vehicles driving into downtown)
    SB in PM peak (vehicles driving away from downtown)
 T-test at 90% confidence is used
Travel Time (TT) and Speed
 TT were compared from each segment and for the corridor
 Corridor:
       Stadium Dr. to Windsor Rd. (5 links and 6 intersections)
 TT were measured from the midpoints of intersections.
 Speeds found at the middle third of each segment
Travel Time and Speed Results
 In both comparisons of travel time:
     The preferred directions (AM NB and PM SB) experienced an average
      increase in travel time
     The Noon-Peak experienced an increase in travel times for the SB
      direction
     No changes in Off-Peak hours

 Speed Comparison:
     The corridor experienced an overall decrease in speed in the PM SB
      direction
     This is not beneficial for efficiency but may contribute to safety benefits
      (may decrease crash severity).
System Performance
1. When heavy volume on WB Thru of Kirby Avenue
     •   Observed in PM peak on three days right after the vendor did the “final
         fine tuning” of the system

2.   During special events
     •   Garth Brooks concerts at the State Farm Center
     •   Pre-marathon
Heavy Volume on WBT of Kirby Avenue
  Afternoon peak observations on three consecutive days
      4:28 PM to 5:43 PM on April 10, 2017
      4:31 PM to 5:37 PM on April 11, 2017
      4:35 PM to 5:00 PM on April 12, 2017
  Multiple cycle failures (WB queue did not clear during green time)
      Nearly one-half to two-thirds of cycle failures
  During cycle failure on Minor street (Kirby Avenue)
      Unused green on Major street
      Most of cases receiving link of Minor link had space to receive more
       queued vehicles
Heavy Volume on WBT
 Condition on competing directions (NBT/SBT at Neil) and receiving link on Apr 11, 2017
                                                               Field Observation                    Video Observation
                                         WBT
                            Cycle                                                                            Unused Green
            Beginning                   Green     Number of Vehicles    Number of Vehicles in
                           Length                                                               Receiving       Time on
             of Cycle                   Time      in Queue on WBT at   Queue on WBT at End of
                          (seconds)                                                               Link         NBT/SBT
                                      (seconds)      Start of Green            Green
                                                                                                               (seconds)
             4:31:18 PM      112        33.1               7                        0            EMPTY            0–5
             4:33:10 PM      108        33.1              15                        0            EMPTY             14
             4:34:58 PM      114        33.1              16                        4            EMPTY            7–8       Cycle failure
             4:36:52 PM      117        32.1              19                        5            EMPTY             11
             4:38:49 PM      119        34.1              24                       13            EMPTY             0
             4:40:48 PM      117        48.1              25                        8            EMPTY          12–15
             4:42:45 PM      121        36.1              22                        2            EMPTY             16       Available
             4:44:46 PM      132        47.1              24                        0            EMPTY             0
             4:46:58 PM      117        30.1              11                        0            EMPTY             0
                                                                                                                            green time and
             4:48:55 PM      110        26.1              16                        5            EMPTY          10–13       storage space
             4:50:45 PM      118        34.1              21                        5            EMPTY          13–15
             4:52:43 PM      119        38.1              17                        1            EMPTY             0
             4:54:42 PM      126        41.1              22                        2            EMPTY             0
             4:56:48 PM      126        41.1              15                        0           HALF FULL        0–4
             4:58:54 PM      119        45.1              19                        4           HALF FULL        7–8
             5:00:53 PM      117        34.1              23                        3            EMPTY             8        Green time not
             5:02:50 PM
             5:04:45 PM
                             115
                             117
                                        34.1
                                        32.1
                                                          25
                                                          22
                                                                                    8
                                                                                    6
                                                                                                 EMPTY
                                                                                                 EMPTY
                                                                                                                   11
                                                                                                                   0
                                                                                                                            available
             5:06:42 PM      112        43.1              21                        0            EMPTY           8–10
             5:08:34 PM      127        42.1              18                        0            EMPTY             0
             5:10:41 PM      126        41.1              17                        1           HALF FULL          0
             5:12:47 PM      135        57.1              12                        0           HALF FULL          0
             5:15:02 PM      120        36.1              25                        5            EMPTY             5        Available
             5:17:02 PM
             5:19:04 PM
                             122
                             125
                                        25.1
                                        36.1
                                                          24
                                                          28
                                                                                   10
                                                                                   14
                                                                                                 EMPTY
                                                                                                 EMPTY
                                                                                                                   10
                                                                                                                  3–5
                                                                                                                            green time, but
             5:21:09 PM      122        43.1              28                       12            EMPTY          15–18       no storage
             5:23:11 PM      128        33.1              35                       15            EMPTY             0
             5:25:19 PM      128        39.1              32                       17             FULL           5–8        space
             5:27:27 PM      135        45.1              26                        7           HALF FULL          9
             5:29:42 PM      135        49.1              18                        0            EMPTY          18–20
             5:31:57 PM      126        39.1              12                        0            EMPTY            5–7
             5:34:03 PM      116        36.1              10                        0            EMPTY             10
             5:35:59 PM      116        33 1               6                        0            EMPTY              0
Special-Event Traffic
 Garth Brooks concerts at UI’s State Farm Center
     Two concerts on April 29, 2017 and one concert on April 30, 2017
     System inability to respond to volume increase on Kirby Avenue
     Police took control of signal operation when both inbound and outbound had congestion
 Pre-marathon
     Traffic pattern and traffic-signal operation were not normal
     Data was not helpful to assess system performance
     Police controlled traffic pattern and traffic-signal operation
 Marathon day
     Flashing mode at the traffic signal of Stadium Drive
     Traffic was closed at Neil Street between Kirby Avenue and Stadium Drive → traffic pattern
      changed and not operating in adaptive mode
Garth Brooks concerts at the State Farm Center
 Inability to respond to volume increase on EBT (going to concert) on April 29, 2017
                                                                                                               Video Observation
                                                       EBT Green
                                        Cycle Length                                              Number of Vehicles in                                Unused Green Time on
                   Beginning of Cycle                     Time     Number of Vehicles in Queue
                                         (seconds)                                               Queue on EBT at End of           EBT Receiving Link         NBT/SBT
                                                       (seconds)     on EBT at Start of Green
                                                                                                        Green                                               (seconds)

                      1:35:46 PM            121          17.1                  7+                         6+                          EMPTY                      0
                      1:37:47 PM            115          33.1                  8+                          4                          EMPTY                    3–5
                      1:39:42 PM            121          21.1                  8+                          4                          EMPTY                     20            Cycle failure
                      1:41:43 PM            125          28.1                  5+                          1                          EMPTY                     0
                      1:43:48 PM            125          28.1                  7+                         5+                         HALF FULL                   0
                      1:45:53 PM            128          38.1                  5+                         7+                         HALF FULL                   0
                      1:48:01 PM            122          29.1                  8+                          2                          EMPTY                     0
                      1:50:03 PM            125          25.1                  8+                          4                          EMPTY                    5–6
                      1:52:08 PM
                      1:54:13 PM
                                            125
                                            125
                                                         24.1
                                                         28.1
                                                                               7+                         7+                         HALF FULL                   0
                                                                                                                                                                              Available
                      1:56:18 PM
                      1:58:23 PM
                                            125
                                            125
                                                         18.1
                                                         17.1
                                                                                                                   No recording                                               green time and
                      2:00:28 PM
                      2:02:34 PM
                                            126
                                            124
                                                         28.1
                                                         21.1                  8+                          5                           FULL                     0
                                                                                                                                                                              storage space
                      2:04:38 PM            125          28.1                  7+                          4                         HALF FULL                 0
                      2:06:43 PM            125          28.1                  8+                         6+                         HALF FULL                  0
                      2:08:48 PM            125          28.1                  9+                         6+                           FULL                     0
                      2:10:53 PM            127          28.1                  8+                          5                         HALF FULL                 0
                      2:13:00 PM            123          28.1                  7+                         7+                           FULL                     0
                      2:15:03 PM            115          37.1                  7+                         6+                         HALF FULL                  0             Green time not
                      2:16:58 PM            127          28.1                  7+                         6+                           FULL                     0
                      2:19:05 PM            112          33.1                  7+                         8+                           FULL                     0             available
                      2:20:57 PM            114          36.1                  8+                         5+                           FULL                     0
                      2:22:51 PM            117          31.1                  7+                         8+                           FULL                     7
                      2:24:48 PM            107          22.1                  8+                         9+                           FULL                     0
                      2:26:35 PM            117          32.1                  9+                         7+                           FULL                     0
                      2:28:32 PM            110          29.1                  7+                         8+                           FULL                     0
                      2:30:22 PM
                      2:32:27 PM
                                            125
                                            114
                                                         35.1
                                                         28.1
                                                                               8+
                                                                               8+
                                                                                                          8+
                                                                                                          7+
                                                                                                                                       FULL
                                                                                                                                       FULL
                                                                                                                                                                0
                                                                                                                                                                0
                                                                                                                                                                              Available
                      2:34:21 PM
                      2:36:11 PM
                                            110
                                            114
                                                         28.1
                                                         28.1
                                                                               7+
                                                                               8+
                                                                                                          5+
                                                                                                          6+
                                                                                                                                       FULL
                                                                                                                                       FULL
                                                                                                                                                              5–10
                                                                                                                                                              5–10
                                                                                                                                                                              green time, but
                      2:38:05 PM
                      2:40:02 PM
                                            117
                                            116
                                                         28.1
                                                         31.1                  7+
                                                                                                    No recording
                                                                                                          6+                         HALF FULL
                                                                                                                                                              4–6
                                                                                                                                                                0
                                                                                                                                                                              no storage
                      2:41:58 PM
                      2:45:51 PM
                                            233
                                            153
                                                         95.1
                                                         47.1
                                                                               7+
                                                                               8+
                                                                                                           1
                                                                                                           0
                                                                                                                                     HALF FULL
                                                                                                                                      EMPTY
                                                                                                                                                               30
                                                                                                                                                              3–6
                                                                                                                                                                              space
                      2:48:24 PM            186          54.1                  7+                          0                          EMPTY                    40
Garth Brooks concerts at the State Farm Center
 Inability to respond to volume increase on EBT (going to concert) on April 29, 2017
                                                                                 Video Observation
                             Cycle     EBT Green         Number of       Number of
         Beginning of                                                                                 Unused Green
                            Length        Time          Vehicles in   Vehicles in Queue EBT Receiving
            Cycle                                                                                       Time on
                          (seconds)    (seconds)      Queue on EBT at on EBT at End of      Link
                                                                                                        NBT/SBT
                                                       Start of Green       Green
          1:35:46 PM        121             17.1               7+                 6+               EMPTY       0
          1:37:47 PM        115             33.1               8+                  4               EMPTY      3–5
          1:39:42 PM        121             21.1               8+                  4               EMPTY       20
          1:41:43 PM        125             28.1               5+                  1               EMPTY       0
          1:43:48 PM        125             28.1               7+                 5+              HALF FULL    0
          1:45:53 PM        128             38.1               5+                 7+              HALF FULL    0
          1:48:01 PM        122             29.1               8+                  2               EMPTY       0
          1:50:03 PM        125             25.1               8+                  4               EMPTY      5–6
          1:52:08 PM        125             24.1               7+                 7+              HALF FULL    0
          1:54:13 PM        125             28.1
          1:56:18 PM        125             18.1
                                                                                       No recording
          1:58:23 PM        125             17.1
          2:00:28 PM
          Cycle failure
                            126             28.1
                          Available green time and storage space    Green time not available
Conclusion
 First year implementation, ASCT seemed to favor minor-street over major-
  street
 Final year implementation deteriorated cases (63%) were more than first year
  (29%)
 Some reasonable explanation(s) for deteriorated cases (20 out of 35 cases) in
  final year
 Decreasing trend on fatal and injury crashes (CMF
Conclusion
 Average travel time increased in preferred directions
 PM SB experienced decrease in speed, and it may contribute to safety
  benefits by compromising efficiency
 Nearly one-half to two-thirds of cycle failures during WBT PM peak
  observation on three days
       Most cases had unused green on SBT/NBT with available storage space on
        WBT receiving link
 Garth Brooks concerts at the State Farm Center
    System inability to respond to volume increase on Kirby Avenue
    Cycle failures even for early arrivals with unused green on SBT/NBT with
      available storage space on WBT receiving link
        → Could have created worsened situation for late arrivals with unused
        green on SBT/NBT with NO available space
Thanks!

          Questions?

Kyle Armstrong (Kyle.Armstrong@illinois.gov)
Ray Benekohal (rbenekoh@illinois.edu)
Hongjae Jeon (hjeon17@Illinois.edu)
You can also read