MONTHLY STATISTICS PACKAGE - JANUARY 2021
←
→
Page content transcription
If your browser does not render page correctly, please read the page content below

MONTHLY
STATISTICS
PACKAGE
JANUARY 2021
MEDIARELEASE
FEBRUARY 1, 2021
LOWEST INVENTORY ON RECORD CONTINUES TO PLAGUE BUYERS
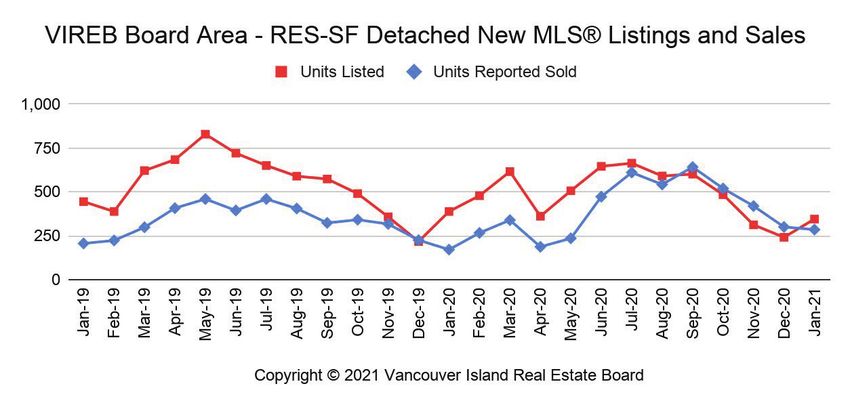
NANAIMO, BC – The Vancouver Island Real Estate Board (VIREB) reports that sales of single-family homes in
January increased by 66 per cent board-wide from one year ago but were five per cent lower than in December.
Last month, 286 single-family detached properties (excluding acreage and waterfront) sold on the MLS® System
compared to 172 the previous January and 302 in December 2020. In the condo apartment category, sales rose
by 46 per cent year over year (63 to 92) but dropped by 26 per cent from the previous month. Row/townhouse
sales increased by 75 per cent from January 2020 and 45 per cent from December.
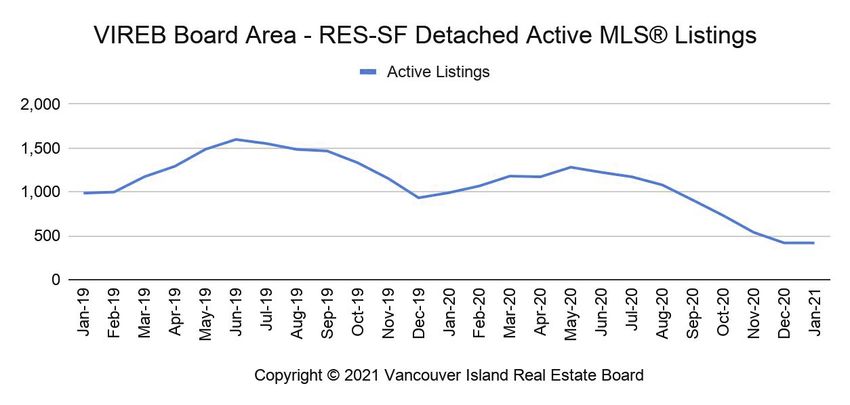
Active listings of single-family detached properties were virtually the same as the previous month (420
compared to 421). There were 212 condo apartments and 95 row/townhouses for sale last month, down nine
and 20 per cent, respectively, from December.
As reported in our previous media releases, low inventory – the lowest on record – continues to plague buyers.
The demand is there, but there are not enough listings to satisfy it.
“A dearth of listings is an ongoing issue throughout our area,” says VIREB president Ian Mackay. “We’re
confident that sales activity would be much higher if we had adequate supply.”
As it is, adds Mackay, REALTORS® are seeing multiple offers around 50 per cent of the time, which means sellers
are receiving more than their asking price in many instances.
“We’d normally say this is a great time to sell, but with so little inventory available, buyers and sellers are in a
Catch-22 situation,” adds Mackay. “It’s hard to part with your home if you have nowhere to move.”
Mackay advises that while obtaining the advice of a REALTOR® can help in any market, it is particularly crucial in
a busy one.
“In a competitive housing market, using a REALTOR® can help streamline the buying and selling process to
ensure the best possible outcome while mitigating associated risks,” adds Mackay.
The British Columbia Real Estate Association (BCREA) does not see the inventory situation improving
until more supply comes online later in the year. BCREA and local real estate boards are advocating with
policymakers at the provincial and regional levels to encourage streamlining the development process so that
municipalities can expand supply more quickly to meet demand.
Naturally, the robust housing market is impacting prices, which are rising throughout the board area. The
benchmark price of a single-family home hit $596,500 in January, a 12 per cent increase from the previous year.
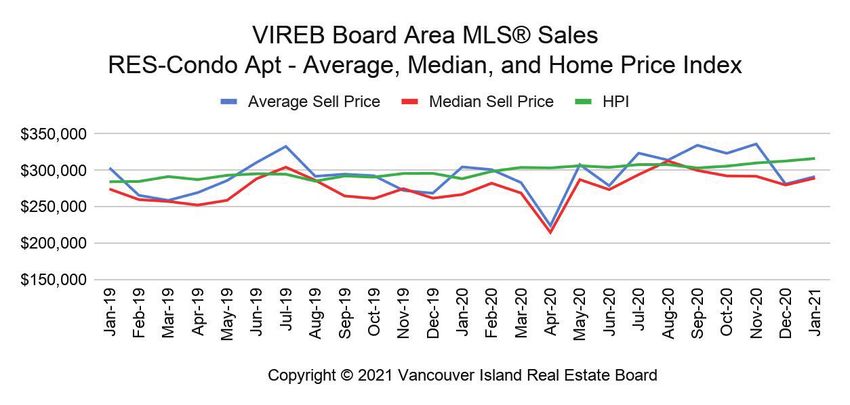
The benchmark price of an apartment reached $316,400, an increase of 10 per cent, while the benchmark price
of a townhouse rose by 12 per cent year over year, climbing to $459,800.
In Campbell River, the benchmark price of a single-family home hit $528,000 in January, an increase of 14 per
cent over last year. In the Comox Valley, the benchmark price was $620,100, up by 11 per cent from one year
ago. Duncan reported a benchmark price of $561,900, an increase of 17 per cent from January 2020. Nanaimo’s
benchmark price rose by 11 per cent, hitting $604,500, while the Parksville-Qualicum area saw its benchmark
price increase by 12 per cent to $686,600. The cost of a benchmark single-family home in Port Alberni reached
$371,200, a seven per cent year-over-year increase. For the North Island, the benchmark price rose to $283,200,
a seven per cent increase over last year.
- 30 -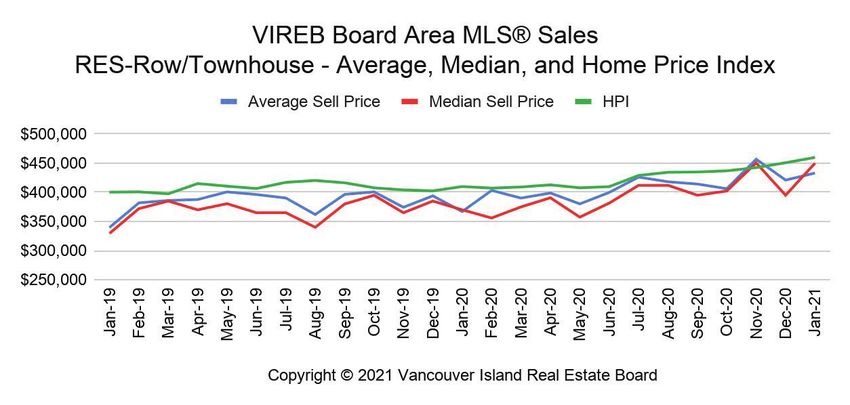
Please note: The Vancouver Island Real Estate Board (VIREB) transitioned to a new MLS® System on July 28 and
now uses a significantly different data model, which has affected our categories and terminology. For the board-
supplied graphs, single-family is now referred to as single-family detached, apartment as condo apartment, and
townhouse as row/townhouse, which now includes patio homes. However, when reporting HPI numbers, VIREB still
refers to single-family, apartment, and townhouse in the media release.

ABOUT VIREB

VIREB represents over 1,000 REALTORS® in nearly 90 member offices on Vancouver Island, from the
Malahat in the south to the northern tip.

VIREB cautions that average price information can be useful in establishing trends over time but does
not indicate the actual prices in centres comprised of widely divergent neighbourhoods or account for
price differential between geographic areas.

Trademarks are owned or controlled by The Canadian Real Estate Association (CREA) and identify real
estate professionals who are members of CREA (REALTOR®) and/or the quality of services they provide
(MLS®).

Visit our website for updated information at www.vireb.com.

HPI Note: Areas with insufficient data do not generate statistics and are not included in the HPI graphs.

CONTACTS

Ian Mackay, President: 250.248.4321
Erica Kavanaugh, President-Elect: 250.248.4321
Kevin Reid, Past President: 250.334.3124
Darrell Paysen, Manager, Member Services: 250.390.4212

For localized commentary, please contact:

Campbell River                                         Directors-at-Large
Ashley Stawski: 250.286.1187                           Janet Scotland: 250.923.2111
Comox Valley                                           David Procter: 250.339.2021
Kevin Reid: 250.334.3124                               Ian Mackay: 250.248.4321
Cowichan Valley
Susan Perrey: 250.245.2252                             MLS® HPI Media Contact
Nanaimo                                                Communications Department
Deana Baumel: 250.751.1223                             Vancouver Island Real Estate Board
Kelly O’Dwyer: 833.817.6506                            communications@vireb.com
Parksville-Qualicum                                    250.390.4212
Erica Kavanaugh: 250.248.4321
Port Alberni-West Coast
Judy Gray: 250.726.2228

6374 Metral Drive | Nanaimo, BC | V9T 2L8 | 250.390.4212 T | 250.390.9565 F | www.vireb.com | www.openhousesvi.com | www.realtor.ca
HOME PRICE INDEX - BACKGROUNDER
ABOUT THE MLS® HOME PRICE INDEX

On November 1, 2012, VIREB adopted the MLS® Home Price Index (MLS® HPI) as a new method of
reporting market price trends. The MLS® HPI determines the value for a typical “benchmark” home,
which is a notional dwelling that shares a specific set of qualitative and quantitative attributes.
Benchmark prices tend to be slightly lower than corresponding medians and averages

The MLS® HPI, based on the information entered into the MLS® System at the time of sale, is the best and
purest way of determining price trends in the housing market. It was pioneered by six founding partners:
the real estate boards of Calgary, Fraser Valley, Montreal, Toronto, and Vancouver, and the Canadian Real
Estate Association. In 2009, the partners contracted with Altus Group to develop the MLS® HPI, which
subsequently launched in January 2012.

WHY AN MLS® HOME PRICE INDEX?

The MLS® HPI captures and analyzes Canadian home prices based on both quantitative and qualitative
housing features.

Quantitative features captured by the index are, for example, number of rooms and bathrooms, living
area above ground, and the age of the home. Qualitative features include finished basement, if the home
is new or resale, and the home’s proximity to shopping, schools, transportation, hospitals, and so on.

The MLS® HPI gauges Vancouver Island prices relative to January 2005, and tracks price trends for
benchmark housing types:

•   Single-family homes
•   One-storey
•   Two-storey
•   Condominium apartments
•   Townhouses

The complete methodology is available at http://homepriceindex.ca/hpi_resources_en.html.

WHY DOES IT MATTER?

Average and median home prices are often misinterpreted, are affected by change in the mix of homes
sold, and can swing dramatically from month to month (based on the types and prices of properties that
sold in a given month). The MLS® HPI overcomes these shortcomings.

Compared to all other Canadian home price measures, the MLS® HPI identifies turning points sooner, is
the most current, and is the most detailed and accurate gauge for Canadian home prices.

HOW TO READ THE TABLES

Benchmark Price: Estimated sale price of a benchmark property. Benchmarks represent a typical
property in each market.

Price Index: Index numbers estimate the percentage change in price on typical and constant quality
properties over time. All figures are based on past sales. In January 2005, all indices are set to 100

Month/Year Change Percentage: Percentage change of index over a period of (x) month(s) year.
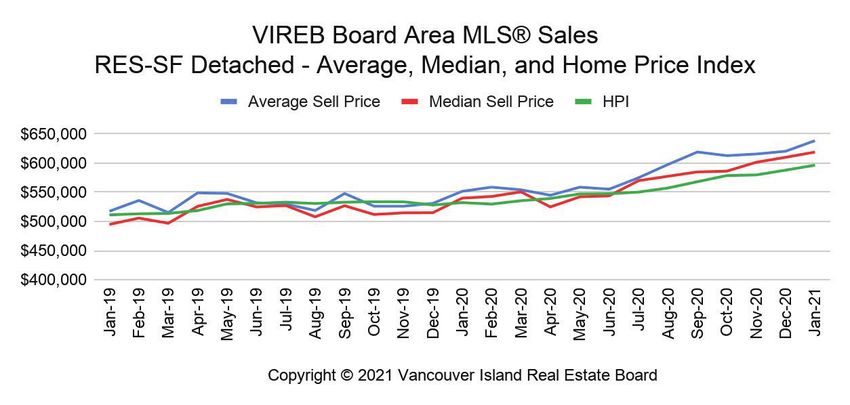
SINGLE-FAMILY BENCHMARK PRICE AND HPI
SINGLE-FAMILY BENCHMARK PRICE AND HPI
APARTMENT BENCHMARK PRICE AND HPI
APARTMENT BENCHMARK PRICE AND HPI
TOWNHOUSE BENCHMARK PRICE AND HPI
TOWNHOUSE BENCHMARK PRICE AND HPI
MLS® SALES SUMMARY - JANUARY 2021
Presented in chart form below are the single-family residential unit sales, average sale prices, and
median price information for all zones within the board area.

Source: Multiple Listing Service® (MLS®) sales data from the Vancouver Island Real Estate Board (VIREB). Please note
that single-family detached figures in this report exclude acreage and waterfront properties. The board totals include
Zone 7 - North Island, Zone 9 - Out-of-Board Properties, and Zone 10 - Islands figures, which are not listed separately
in this table.

VIREB is an association of REALTORS® committed to providing its members with the structure and services to ensure
a high standard of business practice and ethics, and to serve the real estate needs of the community effectively. Find
properties online at REALTOR.ca.

VIREB cautions that average price information can be useful in establishing trends over time but does not indicate
the actual prices in centres comprising widely divergent neighbourhoods or account for price differential between
geographic areas.
AVERAGE, MEDIAN, AND BENCHMARK
    PRICE (HPI) COMPARISONS

Please note that due to VIREB’s transition to a new MLS® System in July 2020, the historical
HPI numbers in the above graphs are significantly different then before we adopted Matrix.
RESIDENTIAL - SINGLE-FAMILY DETACHED
ACTIVE MLS® LISTINGS/LISALESYou can also read