A Big Wave at Pouto, Kaipara Harbour, New Zealand Kevin E. Parnell* - Allen Press
←
→
Page content transcription
If your browser does not render page correctly, please read the page content below
Journal of Coastal Research, Special Issue No. 101, 2020

            A Big Wave at Pouto, Kaipara Harbour, New Zealand

                                         Kevin E. Parnell*

             Department of Cybernetics, Tallinn University of Technology, Estonia

                                            INTRODUCTION
  For most of the time fieldwork is enjoyable. Occasionally it is uncomfortable, sometimes
frustrating. Rarely, it can be terrifying. One such occasion was during an overnight experiment being
undertaken on the northern tidal inlet shore of the Kaipara Harbour, North Island, New Zealand
(Figure 1). The Kaipara Harbour entrance has a massive ebb tidal delta, creating treacherous
conditions for boats trying to cross it. At the time I was an academic at the Geography Department at
the University of Auckland and the research, involving quantifying sediment transport along the tidal
inlet shoreline, was a part of the Kaipara Sand Study (Hume et al., 2003) sponsored by sand
extraction companies and administered by the Auckland Regional Council. This part of the study
was undertaken by Philip Osborne and me, with technical support from Shane Thomson and David
Jenkinson. On 12 February 2001, sensors (ADVs, pressure sensors, OBSs) were deployed across the
intertidal profile. The seaward-most instrument was an InterOcean S4A current meter (sampling at
2Hz) deployed at about low tide level. With the exception of the S4A, sensors were hardwired to
computers and power supplies housed in a trailer located well landward of the swash line and high-
tide berm, in a backshore area with small incipient dunes (Figure 1).

                                          THE BIG WAVE
  Conditions during the experiment were forecast to be moderate. We had checked the predicted
swell on the WAM wave model forecasting website, and there was no indication that swell heights
were likely to increase significantly. The first tidal cycle was uneventful (Figure 2a,b). During the
second (night) high-tide period however, conditions were considerably (and surprisingly) much more
energetic, which was excellent for the experiment objective (Figure 2a,c). At high tide, the trailer
containing the data collection computers was at least 5 m landward of the upper swash line.
Somewhere between 0200 and 0230 (the exact time is uncertain), I was standing at the back of the
trailer talking to Shane Thomson who was sitting at a desk inside the trailer monitoring the
computers. I heard a louder than usual noise and turned to see a wave approaching, which I later
estimated to be 1 m to 1.5 m high at the upper limit of swash up to that time. I held on to the trailer!

  The wave broke into the trailer, pushing it landward by about 10-15 m. I recall seeing Shane
Thomson’s head just above water level in the trailer before the lights went out. The receding wave
dragged out almost all the contents of the trailer. There was no similar wave that night. After
establishing that we were safe (albeit wet and cold), my biggest concern was that we were due to be
replaced by Phil Osborne and David Jenkinson (who had been sleeping at our accommodation in
Pouto village) at about 0300h. Reaching the site by AWD (quad) bike required passing a high
consolidated dune with a very steep eroded face and very narrow dry beach. If a similar wave were
to hit as they passed that location, the result would likely to have been disastrous. There was no
mobile phone coverage so they were not able to be contacted. Fortunately, they arrived safely to help
with the clean-up once it got light, by which time significant wave height was about 0.6 m (Figures
2a and 3a).

DOI: 10.2112/JCR-SI101-053.1
*Corresponding author: kevin.parnell@taltech.ee
©
  Coastal Education and Research Foundation, Inc. 2020

                                                     291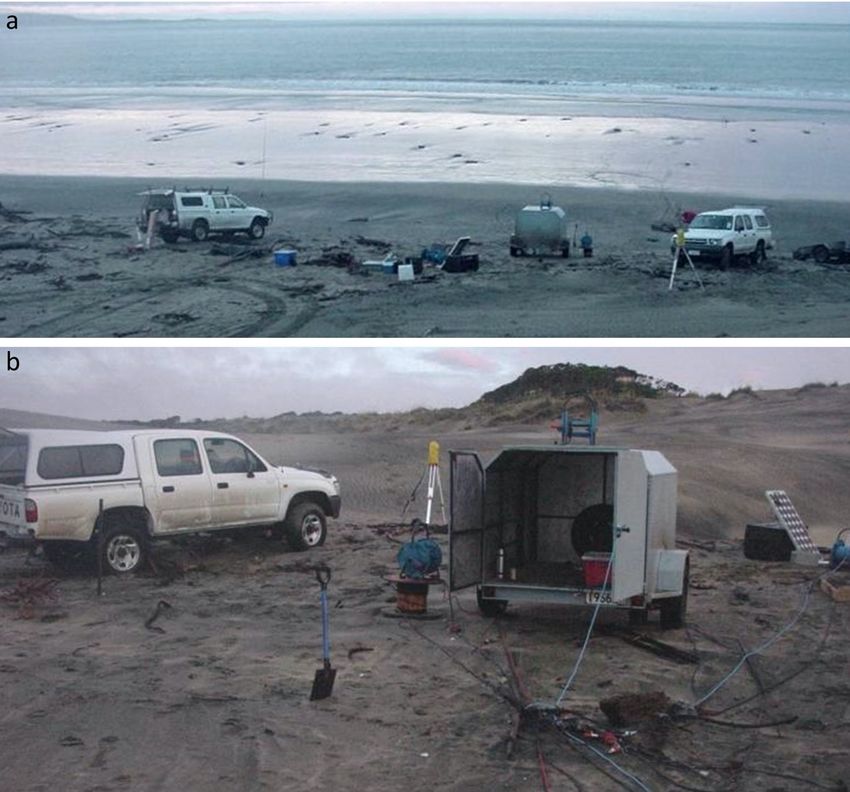
Parnell
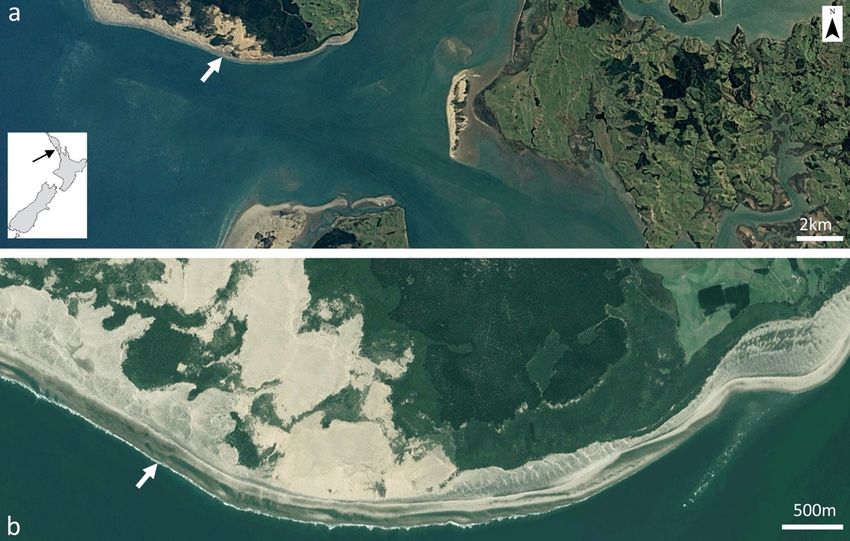
Figure 1. (a) The Kaipara tidal inlet showing the study site location (white arrow). (Source: ©Google Earth 2020,
Landsat/Copernicus; Image: 2013.) (b) Pouto shoreline showing the study site location. (Source: ©Google Earth 2020,
Maxar Technologies and CNES/Airbus; Image: 2012.)
ANALYSIS
Unfortunately, data from the computer disks were not able to be recovered. The only record that
we have is from the S4A. We have searched the data record, but have not found anything out of the
ordinary. As the S4A was recording in burst mode (18 minutes recording in a 20-minute cycle), it is
possible that the event was missed.
Figure 2c shows the data burst 0220h-0238h, with a corresponding spectrogram (and a spectrogram
from the first high tide period for comparison) in Figure 2d. With such a confused sea, and the
possibility of waves moving in a range of directions (including, most likely, shore parallel), the
legitimacy of the analysis is questionable. Clearly there is a lot of infragravity energy (peak >256 s,
unable to be fully resolved), which is also visible as a long wave in the water surface elevation data
(Figure 2c). There is also a lot of energy at a range of other frequencies.
There is substantial evidence that the big wave was highly unusual for that night. It was the only
wave to cross the berm/incipient dune field to reach the dune face. The wave eroded the shoreline
and caused sand dunes to slump. To the west of the profile, there was 1-2 m of dune slumping along
the shoreline. This dune was seen to be intact not long before the wave and was observed again as
soon as we had secured the site after the damage had occurred. To the east, along a section of high
and old consolidated dune, there was considerable slumping at the base. Slumping occurred during
the night, but cannot be attributed solely to the single wave as it was not observed over this period.
Near Pouto village, approximately 6 km to the east of the field site, a low-lying dune flat was
inundated, which had been dry for many days previously. Overnight, large amounts of beach debris
shifted, including some large logs.
292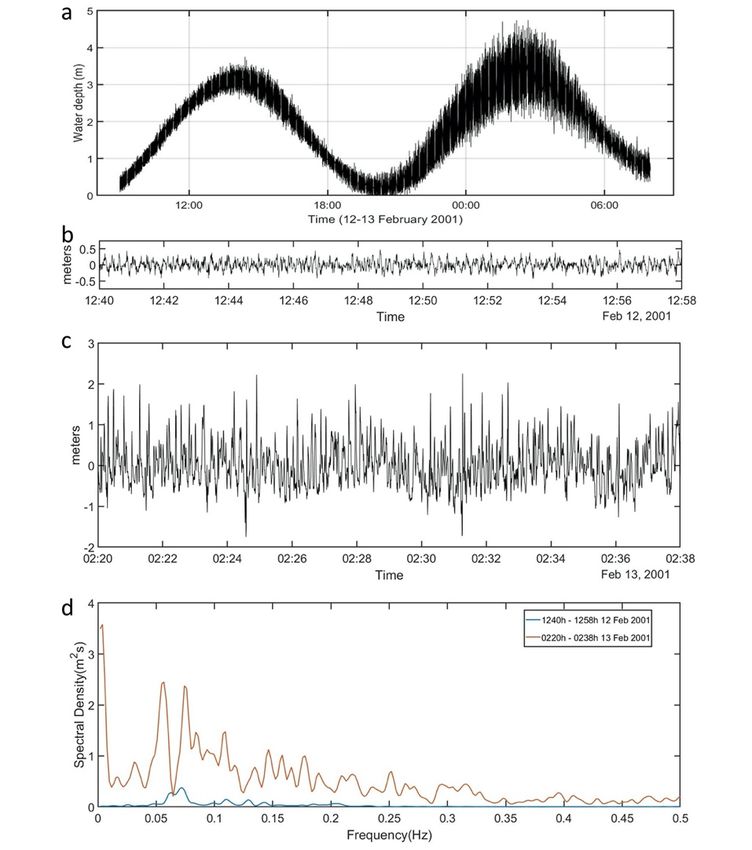
Journal of Coastal Research, Special Issue No. 101, 2020

  The most reasonable simple explanation for the big wave is superposition of a number of waves at
a range of frequencies, even though it was so much bigger than any other wave before or after that
night. The ebb tidal delta of the Kaipara means that maximum wave height within the harbour should
be depth-limited, but wave breaking and reformation would lead to a very confused sea. There is also
the influence of tidal currents and reflection from shorelines to consider. We have searched for and
thought about other explanations, but have none.

Figure 2. (a) Water depth (above the sensor which was ~0.25 m above the bed) recorded by an InterOcean S4A current
meter with a pressure sensor. Sampling was at 2 Hz with burst length 18 minutes on a 20 minute cycle; (b) Detrended
water-surface elevation during the first tidal cycle. Mean water depth = 3.08 m; Hm0 = 0.57 m; Tp = 13.8 s. (c) The same
data around the time of the big wave, plotted at the same scale. Mean water depth = 3.48 m; Hm0 = 2.10 m; Tp > 256 s. (d)
Spectrograms of the data bursts b and c. Pressure attenuation correction has been applied to b, c and d. Data were
processed using OCEANLYZ, a MATLAB toolbox.

  At the time of the study, I was also collecting information for a report on Anecdotal Evidence
(Parnell, 2002), also part of the Kaipara Sand Study. Many stories of big waves, particularly single
waves reaching well above high tide mark (probably 8 or 9 independent events) were told to me. For
example, in 1987 or 1988, a family was picnicking in the vicinity of Midge Rocks (about 5 km to the
east of the field site). One large wave came in, flooding into the dunes. Another example reported to
me related to two local people who were fishing from a boat around the area known as the
Graveyard (west of the field site). It was a fine day and the sea was glassy. All of a sudden one very
big wave came, after which the sea was very rough. People at Pouto noticed the change and knew the

                                                          293
Parnell
fishermen were out there and went out in a boat to look for them. ‘We heard the boat go past, but the
waves were so big they passed without us seeing them.’ A Kaumatua (Maori elder) told me that odd
big waves are the result of the ancestors arguing and that their occurrence can be predicted. A
number of local people believe that such events are related to seismic activity off the west coast of
the North Island, but there is nothing to substantiate these claims.
Figure 3. Cleaning up, the morning after the big wave. (a) The view of the field site along the profile line. (b) The trailer
that had housed computers, power supplies, a desk and chair, and miscellaneous other items. Note the tangle of cables.
(Photos: K.E. Parnell.)
CONCLUSION
Fortunately, most fieldwork is undertaken without incident, and most hazards can be avoided or
mitigated. Occasionally something occurs that even many years of experience can not foresee or
explain adequately. The big wave in the Kaipara Harbour is one such event, but according to the
local community, it is not particularly surprising!
LITERATURE CITED
Hume, T.M.; Parnell, K.E.; Green, M.; Nichol, S.L., and Osborne, P.D., 2003. Kaipara Sand Study:
Final Report. Hamilton, New Zealand: NIWA, Client Report HAM2002-064 (Project
ARC02218), 65p.
Parnell, K.E., 2002. Kaipara Sand Study: Anecdotal Evidence. Auckland, New Zealand: Auckland
UniServices Limited. Project 08167.04 Report, 82p.
294You can also read