Cloud Condensation Nuclei Hygroscopicity Value-Added Product Report - DOE/SC-ARM-TR-272
←
→
Page content transcription
If your browser does not render page correctly, please read the page content below
DOE/SC-ARM-TR-272

Cloud Condensation Nuclei Hygroscopicity
Value-Added Product Report

GR Kulkarni MS Levin
JE Shilling

August 2021
DISCLAIMER

This report was prepared as an account of work sponsored by the U.S.
Government. Neither the United States nor any agency thereof, nor any of
their employees, makes any warranty, express or implied, or assumes any
legal liability or responsibility for the accuracy, completeness, or
usefulness of any information, apparatus, product, or process disclosed, or
represents that its use would not infringe privately owned rights. Reference
herein to any specific commercial product, process, or service by trade
name, trademark, manufacturer, or otherwise, does not necessarily
constitute or imply its endorsement, recommendation, or favoring by the
U.S. Government or any agency thereof. The views and opinions of
authors expressed herein do not necessarily state or reflect those of the
U.S. Government or any agency thereof.
DOE/SC-ARM-TR-272

Cloud Condensation Nuclei Hygroscopicity
Value-Added Product Report

GR Kulkarni
MS Levin
JE Shilling
All at Pacific Northwest National Laboratory

August 2021

Work supported by the U.S. Department of Energy,
Office of Science, Office of Biological and Environmental Research
GR Kulkarni et al., August 2021, DOE/SC-ARM-TR-272

 Acronyms and Abbreviations
ARM Atmospheric Radiation Measurement
CCN cloud condensation nuclei
CCNC cloud condensation nuclei counter
CPC condensation particle counter
NetCDF Network Common Data Form
SMPS scanning mobility particle sizer
SGP Southern Great Plains
SS supersaturation
UTC Coordinated Universal Time
VAP value-added product

 iii
GR Kulkarni et al., August 2021, DOE/SC-ARM-TR-272

 Contents
Acronyms and Abbreviations ...................................................................................................................... iii
1.0 Introduction .......................................................................................................................................... 5
2.0 Algorithm and Methodology ................................................................................................................ 5
3.0 Input Data ............................................................................................................................................. 6
4.0 Output Data .......................................................................................................................................... 8
5.0 Summary............................................................................................................................................. 10
6.0 References .......................................................................................................................................... 10
Appendix A – Quality Checks Applied in aosccn2cola.b1 Datastream.................................................... A.1

 Figures
1 Diagram depicting data flows for the SMPS and CCN instruments. ..................................................... 7
2 Supersaturation versus critical diameter with reference κ constant lines on 2020-06-27. ..................... 9
3 κ versus time on 2020-06-27. ................................................................................................................. 9
4 Frequency distribution of κ on 2020-06-27. ......................................................................................... 10
5 CCN concentrations and quality assessments from aosccn2cola.b1 at the Southern Great Plains
 (SGP) Extended Facility 13 (E13)...................................................................................................... A.1

 Tables
1 Variables retrieved from the aosccn2colaavg.b1 input datastream. ....................................................... 7
2 Variables retrieved from the aossmps.b1 input datastream. ................................................................... 8
3 Variables calculated by the aosccnsmpskappa.c1 VAP. ........................................................................ 9

 iv
GR Kulkarni et al., August 2021, DOE/SC-ARM-TR-272

1.0 Introduction
 The purpose of the Atmospheric Radiation Measurement (ARM) user facility’s cloud condensation nuclei
 hygroscopicity parameter (AOSCCNSMPSKAPPA) value-added product (VAP) is to calculate the
 hygroscopicity parameter, kappa, to quantify the ability of aerosols to activate into cloud water droplets.
 The hygroscopicity parameter is often used to model the cloud condensation nuclei (CCN) activity of
 atmospheric aerosols of different sizes and compositions, providing additional insight on the influence of
 aerosols on climate.

 Laboratory experiments show that the kappa values for highly hygroscopic aerosols, such as salts and
 sulfates, vary from 0.5 to 1.4 (Petters and Kreidenweis 2007). For organic compounds they are observed
 to vary between 0.01 and 0.5. For non-hygroscopic aerosols, such as soot, kappa values are very close to
 zero. Ambient aerosols are complex mixtures of organic and inorganic compounds and previous
 observations indicate that kappa values typically vary from 0.05 to 0.9 (Petters and Kreidenweis 2007).

2.0 Algorithm and Methodology
 To calculate kappa ( ), this VAP draws on collocated aerosol particle size data from the scanning
 mobility particle sizer (SMPS) and aggregated CCN number concentrations from the cloud condensation
 nuclei counter (CCNC) datastreams (CCN2COLAAVG) managed by the ARM facility.

 -Köhler theory (Petters and Kreidenweis 2007) is used to calculate from aerosol particle size and
 supersaturation measurements. In these calculations, the influence of mixing state and individual chemical
 composition of particles are ignored, and the overall κ is calculated based on the particle number size
 distribution from SMPS and CCN concentrations at a defined instrument supersaturation as a function of
 time, assuming particles are internally mixed with bulk chemical composition. The backward stepwise
 integration from the upper size limit of the SMPS measurements is performed until the total particle
 concentration matches with the measured CCN concentrations. The corresponding particle diameter
 where SMPS and CCNC concentrations are equal is assumed to be the critical diameter required for
 activation. The particles greater than this critical diameter are assumed to be those particles that activate
 into the CCN (e.g., Ren et al. 2018). At each value of supersaturation measured by the instrument, this
 critical diameter is then used to calculate the .

 A single parameter representation of the hygroscopicity of aerosol particles (or κ) is described by
 Petters and Kreidenweis (2007). The critical water vapor supersaturation ( ) that a particle must be
 exposed to in order to activate as a CCN is given by Equation (1), which can be also rearranged to
 calculate the (Equation 2).

 (1)

 5
GR Kulkarni et al., August 2021, DOE/SC-ARM-TR-272

 (2)

 Here, κ refers to the particle hygroscopicity (kappa) parameter, Dp is the dry particle diameter, Mw is the
 molar mass of water, ρw is the density of water, and σ is the droplet surface tension at activation.

 In our calculations, we assume the surface tension for all droplets is 0.072 Jm-2. It is important to note that
 our methodology also assumes that all particles have uniform chemical composition and mixing state. As
 previously mentioned, we also assume that particles with larger diameters preferentially activate into
 water droplets over particles with smaller diameters independent of their chemical composition at a given
 value of supersaturation (Dusek et al. 2006). Due to these assumptions, the κ value derived from this VAP
 will depend on instrument supersaturation and critical diameter. In principle, aerosol particles of constant
 chemical composition have identical κ, regardless of the particle diameter and the instrument saturation at
 which measurements are taken. Using this analysis method, a polydisperse size distribution of a
 single-component aerosol particle measured with the CCN instrument would appear to have higher κ at
 lower instrument supersaturation. This method works best when used to calculate the κ of aerosol from
 clean continental regions/sites due to lesser heterogeneity in their chemical composition across the size
 distribution.

3.0 Input Data
 The AOSCCNSMPSKAPPA VAP has two input datastreams: aosccn2colaavg.b1 and aossmps.b1. These
 datastreams are drawn from the SMPS and CCNC ARM instruments as shown in Figure 1. The SMPS
 measures the number size distribution of ambient aerosols in the range of 10-515 nm. The SMPS is
 operated in a scanning mode from a 10-nm diameter stepped upwards to 515 nm for a total of 109
 diameter steps, such that a complete scan was completed in 300 seconds. The CCNC is operated at
 various water vapor supersaturation (SS) values by regulating the temperature gradient between the top
 and bottom wetted column of the counter. The SS values are typically varied from 0.0 to 1.0 % stepping
 upwards at each single SS step: 0, 0.1, 0.2, 0.4, 0.8, and 1% for 10 minutes. A complete CCN scan takes
 60 minutes. Figure 2 depicts the data flow from the SMPS and CCN instruments into the input
 datastreams used by this VAP. Information about the quality checks applied in the aosccn2colaavg.b1
 datastream can be found in the Appendix of this report. For more information about the input data to this
 product, see the SMPS and CCN instrument handbooks (Kuang 2016, Uin 2016).

 6
GR Kulkarni et al., August 2021, DOE/SC-ARM-TR-272

Figure 1. Diagram depicting data flows for the SMPS and CCN instruments. The highlighted box
 shows the VAP product datastream described in this report.

The aosccnsmpskappa.c1 VAP retrieves a selection of variables from the aossmps.b1 and
aosccn2colaavg.b1 datastreams. The variables retrieved from each input datastream are listed below in
Table 1 and Table 2.

 Table 1. Variables retrieved from the aosccn2colaavg.b1 input datastream.

Variable Name Description
 Aerosol particle number concentration derived from
 condensation particle counter (CPC) data. Ambient aerosol
aerosol_number_concentration
 particles are dried before size-distribution measurements are
 performed.
alt Altitude above mean sea level.
droplet_size Size bins for cloud condensation nuclei droplets.
droplet_size_bounds Droplet size bin bounds.
lat North latitude.
lon East longitude.
N_CCN Mean number concentration of ambient aerosol particles in air.
N_CCN_dN Droplet count by bin size.

 7
GR Kulkarni et al., August 2021, DOE/SC-ARM-TR-272

 Variable Name Description
 Quality check results on field: Mean number concentration of
 qc_N_CCN
 N_CCN.
 setpoint Supersaturation set point bins.
 Mean calculated supersaturation values for a fixed
 supersaturation_calculated
 supersaturation set point.

 Table 2. Variables retrieved from the aossmps.b1 input datastream.

 Variable Name Description
 diameter_mobility Midpoint of geometric mean mobility diameter.
 diameter_mobility_bounds Mobility diameter bin boundaries.
 The aerosol number size distribution where the number of
 particles per bin (dN) has been divided by the bin-width in
 dN_dlogDp
 log10 space (dlogDp). This simplifies comparison of size
 distributions from instruments with different bin spacing.
 Quality check results on field: Number size distribution,
 qc_dN_dlogDp
 electrical mobility diameter.

4.0 Output Data
 The AOSCCNSMPSKAPPA VAP produces one output datastream: aosccnsmpskappa.c1. Output files are
 produced daily and named as XXXaosccnsmpskappaYY.c1.YYYYMMDD.HHMMSS.nc, where XXX is
 the site where the VAP is running, YY is the facility designation within the site, YYYYMMDD is the
 date of the first point in the file, and HHMMSS is the time of the first point in the file.

 Each output file contains all the input variables described by the tables in §3 in addition to the following
 calculated variables.

 8
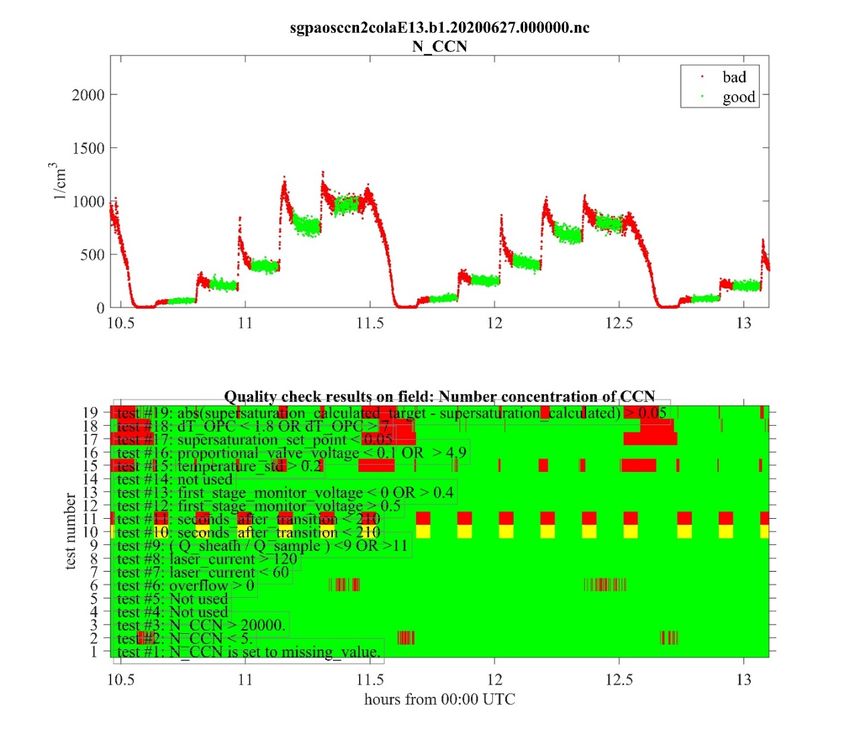
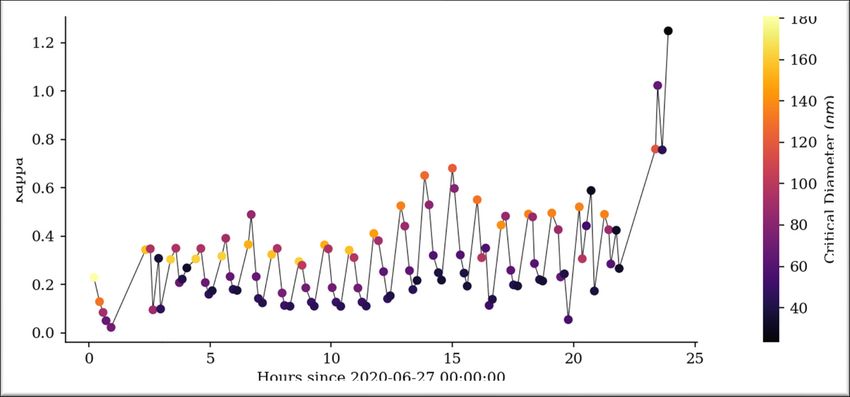
GR Kulkarni et al., August 2021, DOE/SC-ARM-TR-272

 Table 3. Variables calculated by the aosccnsmpskappa.c1 VAP.

Variable Name Description
critical_diameter The critical dry diameter used to calculate κ.
 CCN derived hygroscopicity parameter kappa (κ), calculated
kappa
 using κ -Köhler theory with fixed thermodynamic constants.

This VAP also produces several plots designed to provide a quick overview of the data produced on a
daily basis. A selection of these plots is listed below.

 Figure 2. Supersaturation versus critical diameter with reference κ constant lines on 2020-06-27.

 Figure 3. κ versus time on 2020-06-27.

 9
GR Kulkarni et al., August 2021, DOE/SC-ARM-TR-272

 Figure 4. Frequency distribution of κ on 2020-06-27.

5.0 Summary
 The AOSCCNSMPSKAPPA VAP provides hygroscopicity parameter kappa calculations that can be used
 to characterize aerosol properties at ARM sites and facilities. The VAP produces daily netCDF files, each
 of which spans a 24-hour interval beginning at midnight (UTC). The temporal spacing between data
 points in each file can vary due to the different time-grids used by the CCN and SMPS input datastreams
 but is typically around five minutes. A several-day delay on processing is imposed to allow input data to
 become fully available before the VAP is run.

 This κ product allows us to predict the CCN properties of ambient aerosol from clean continental or
 remote sites. The reported κ - relationship can be used to derive the CCN spectrum from aerosol
 size-distribution to perform aerosol-CCN closure studies to further understand the CCN impacts on warm
 clouds.

6.0 References
 Kuang, C. 2016. Scanning Mobility Particle Spectrometer Instrument Handbook. U.S. Department of
 Energy. DOE/SC-ARM-TR-147.

 Petters, MD, and SM Kreidenweis. 2007. “A Single Parameter Representation of Hygroscopic Growth
 and Cloud Condensation Nucleus Activity.” Atmospheric Chemistry and Physics 7(8): 1961-1971,
 https://doi.org/10.5194/acp-7-1961-2007

 Ren, J, F Zhang, Y Wang, D Collins, X Fan, X Jin, W Xu, Y Sun, M Cribb, and Z Li. 2018. “Using
 different assumptions of aerosol mixing state and chemical composition to predict CCN concentrations
 based on field measurements in urban Beijing.” Atmospheric Chemistry and Physics 18(9): 6907–6921,
 https://doi.org/10.5194/acp-18-6907-2018

 Uin, J. 2016. Cloud Condensation Nuclei Particle Counter Instrument Handbook. U.S. Department of
 Energy. DOE/SC-ARM-TR-168.

 10
GR Kulkarni et al., August 2021, DOE/SC-ARM-TR-272

 Appendix A
 –
 Quality Checks Applied in aosccn2cola.b1 Datastream

Figure 5 shows a plot of the aosccn2cola.b1 cloud condensation nuclei particle counts (N_CCN),
including quality assessments assigned to the data at each timestamp shown. The (N_CCN)
concentrations marked as good are shown in green and are used to develop the AVG and SPECTRA
higher-level data products shown in Figure 1. Figure 5 was generated using the ARM_nc_display Matlab
function (courtesy of Connor Flynn).

Figure 5. CCN concentrations and quality assessments from aosccn2cola.b1 at the Southern Great
 Plains (SGP) Extended Facility 13 (E13).

 A.1
You can also read