Optimal Supply Chain Operating Strategies by Replenishment Stream - Mary Kate Agnes Gorman - MIT CTL
←
→
Page content transcription
If your browser does not render page correctly, please read the page content below

Optimal Supply Chain Operating
 Strategies by Replenishment
            Stream
         Mary Kate Agnes Gorman
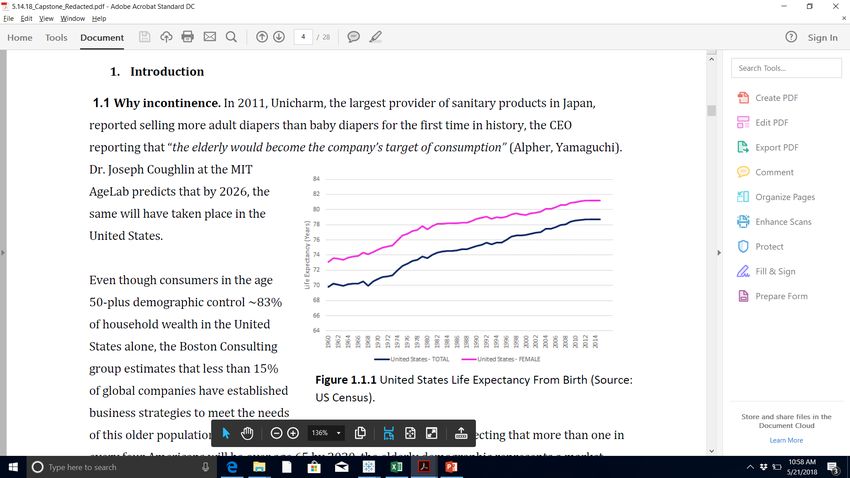
The Aging Population

• In 2011, Unicharm, the largest provider of sanitary
  products in Japan, reported selling more adult
  diapers than baby diapers for the first time in
  history, the CEO reporting that “the elderly would
  become the company’s target of consumption”
  (Alpher, Yamaguchi).

• Dr. Joseph Coughlin at the MIT AgeLab predicts
  that by 2026, the same will have taken place in the
  United States.

• The MIT AgeLab predicts that more than one in
  every four Americans will be over age 65 by 2030.

• The Boston Consulting group estimates that less
  than 15% of global companies have established
  business strategies to meet the needs of this older
  population (Grey Market).
The Aging Population – Is Female

• Retailers must recognize that this age demographic
  is disproportionately female.

• In the United States, for those aged 65 – 69, there
  are 96 men to every 100 women, with this number
  dropping to 60 men to every 100 women for those
  aged 85 and over.

• Women provide a disproportionate share of elder
  care in the United States (66% of the informal
  caregiver market).

• To properly evaluate the purchasing patterns of a
  sensitive product targeted at treating
  incontinence, it is necessary to understand the
  purchasing patterns and consumer behavior of
  those doing the majority of the purchasing:
  Women.
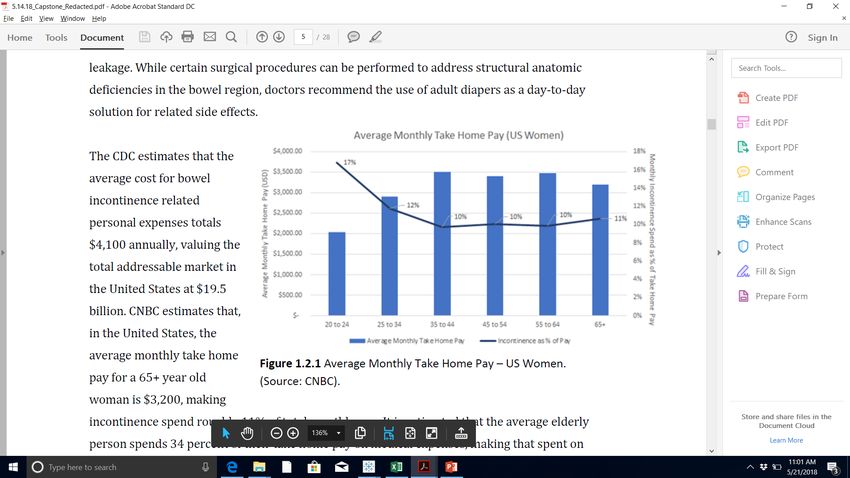
Why Incontinence?

• The CDC recently reported that more than half of
  adults aged 65 and older suffer from the disease of
  incontinence, with nearly 50 percent of women
  and 25 percent of men suffering from bladder
  incontinence (Gorina, 2004).

• The CDC estimates that the average cost for bowel
  incontinence related personal expenses totals
  $4,100 annually, valuing the total addressable
  market in the United States at $19.5 billion.

• CNBC estimates that, in the United States, the
  average monthly take home pay for a 65+ year old
  woman is $3,200, making incontinence spend
  roughly 11% of total monthly pay.

• It is estimated that the average elderly person
  spends 34 percent of their take home pay on
  medical expenses, making that spent on
  incontinence roughly one-third of an elderly
  female’s annual medical budget.
The problem…

A consumer packaged goods company (the “Company”)
manufactures and distributes consumer packaged
goods including products for feminine care and
incontinence.

The Company has identified five unique replenishment
streams:
A Consumer Packaged Goods Company (“CPG”) has identified the following replenishment streams:

1. Base Demand – Everyday movement of
   product, characterized by a very stable
   demand signal (typically ~80% of product
   movement is characterized by this
   profile).

                                              Note: Image does not represent actual company data or trends, for
                                              demonstrative purposes only.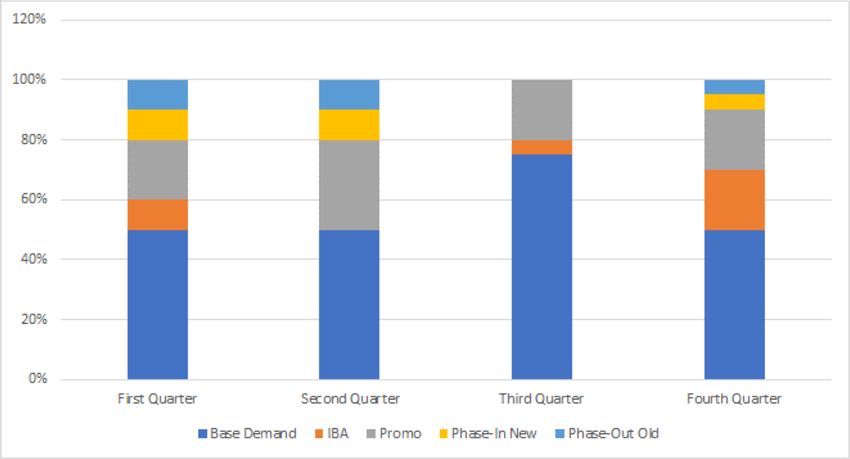
A Consumer Packaged Goods Company (“CPG”) has identified the following replenishment streams:

2. Incremental Business Activities –
Incremental Business Activities (“IBAs”) are
characterized by unplanned demand spikes
and occur with very little notice.

These activities are caused by events in the
broader market and the actions of
competitors.

There is typically no early warning signal for
this replenishment stream; however, the
Company is typically able to respond to this
demand signal within two to four weeks.          Note: Image does not represent actual company data or trends, for
                                                 demonstrative purposes only.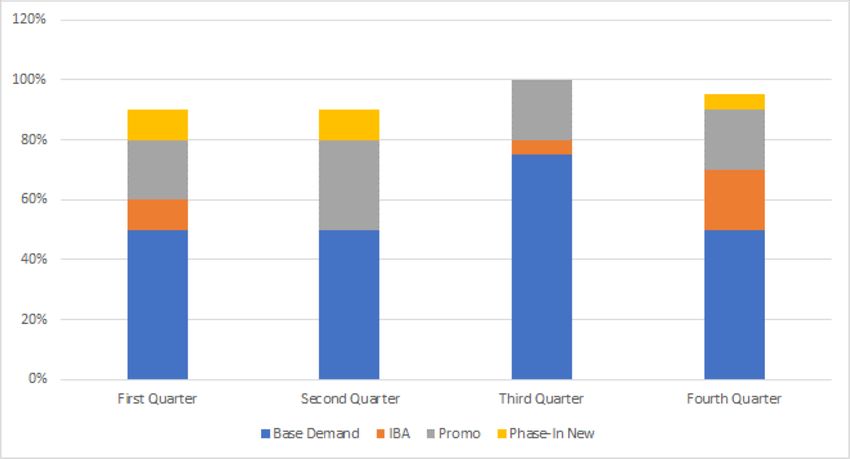
A Consumer Packaged Goods Company (“CPG”) has identified the following replenishment streams:

3. Promotional Activity – Planned promotional
activities, such as advertisements in retail
stores, drive demand spikes in both shipments
and sales.

The Company coordinates with customers to
gather demand planning information four to
six weeks in advance.

                                                Note: Image does not represent actual company data or trends, for
                                                demonstrative purposes only.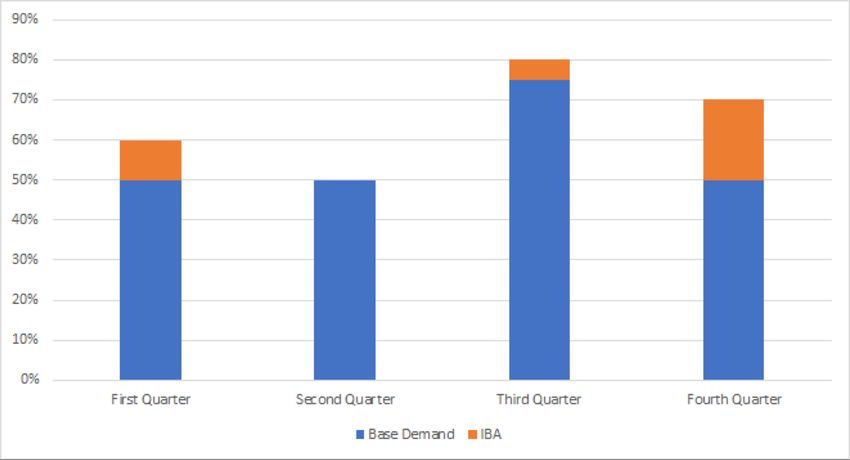
A Consumer Packaged Goods Company (“CPG”) has identified the following replenishment streams:
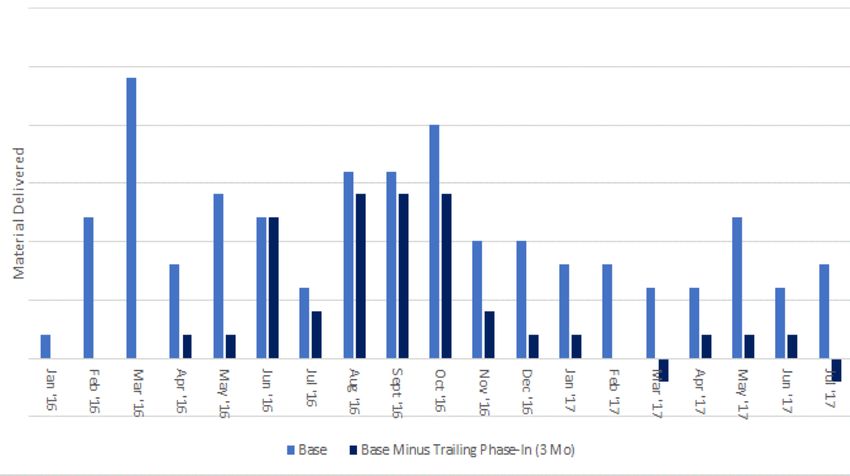
4. New Initiatives – Phase in New – New
stock keeping units (“SKUs”) brought to
market for the first time.
The Company defines a new SKU as either an
entirely new product or as an iteration of an
existing product but with improved features.
There are very specific demand signals (i.e.
the customer launch plan) for this
replenishment stream.
Phase-In of New Initiatives typically last for
three months and then this demand Note: Image does not represent actual company data or trends, for
demonstrative purposes only.
transitions to Base.A Consumer Packaged Goods Company (“CPG”) has identified the following replenishment streams:
5. New Initiatives – Phase out Old – For
Phase-Out Old Initiatives, the Company is
typically working to replace a historic product
(Phase Out demand is characterized by heavy
discounting activity of the product being
phased out).
Phase Out typically occurs two months prior
to the end of scheduled ship date in the
calendar.
Note: Image does not represent actual company data or trends, for
demonstrative purposes only.The problem… For each of these replenishment streams, the Company wishes to confirm whether or not there is an operational and/or financial benefit to differentiate the supply chain by the five replenishment streams identified or by some hybrid. For this project, the rationale to analyze feminine care data to inform demand patterns for incontinence products is to understand and analyze the buying patterns of the female consumer (i.e. frequency of purchase and purchase channel preference) the anticipated purchaser.
Literature Review
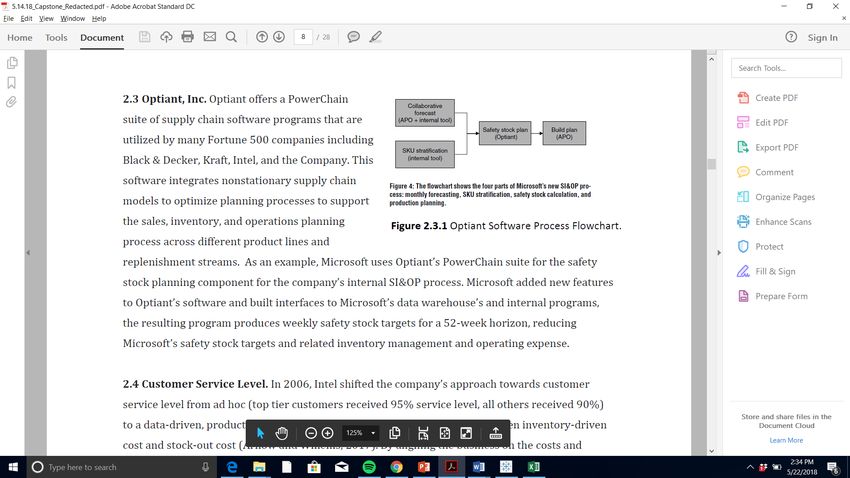
• Several Fortune 500 companies have identified
similar demand replenishment streams and
have leveraged Optiant PowerChain Software
to improve planning processes across these
demand profiles.
• Base Demand, Phase In/Out, and Promotional
replenishment streams are similar in nature
whilst IBAs are often the result of unrelated,
competitive events.
• It may not be a cost-effective solution to offer Optiant PowerChain software is a tool used by many Fortune 500
companies for demand planning purposes across different
each customer and product the same level of
replenishment streams.
service.
• SKU and product segmentation are powerful
tools that can be leveraged to determine
which customers and products should receive
which levels of service as a means to increase
cash flow and reduce operating costs.Data and Methodology: Data - The Company provided four million records of data for years 2016 and 2017 for the North American market (United States and Canada). This data is broken up by SKU by customer, shipment date, ship from location, amount ordered, and amount shipped. Data Manipulation. The customer demand data file contained orders and shipments broken out by SKU, customer, replenishment stream, and day for 2016 and 2017. At the Company, all relevant inventory and planning analysis at the execution level is done using internal metrics for ease of comparison across business units. By having a standardized unit of comparison across business units, the Company can compare metrics like profitability across seemingly dissimilar product categories. Customer Service level. The Company monitors case fill rate, or CFR, as a measure of end customer satisfaction. The Company is targeting CFR levels close to 1 for all SKUs for the top customers. In the customer data file, a new column on CFR was added by dividing shipments by orders. A CFR ratio of less than 1 represents situations where the Company shipped less than what the customer ordered. Data Analysis & Visualization. To analyze trends and patterns in data, this project leveraged Tableau and Excel to visualize data and present findings in elegant, articulate graphics. Primary Research. To better inform research, interviews with both industry and Company experts were conducted to better understand how both the Company and similar companies have approached the question of whether or not replenishment streams should be treated differently based on their demand characteristics.
Inventory Strategy – Pareto Analysis

• Adult incontinence is the Company’s fastest growing
  product segment.

• The Company offers incontinence products under
  three main categories: Segment A, Segment B, and
  Segment C.

• This segmentation identified which SKUs contributed
  the most (Power SKUs) and least (Bottom SKUs) to
  overall incontinence product volume, serving as a
  roadmap for further analysis.

• From this analysis, three SKUS drive ~70% of sales
  volume across all incontinence product lines
  (Segment A, Segment B, and Segment C) in both
  2016 and 2017.                                          Fig 1. Three SKUs drive ~70% of sales volume across all
                                                          incontinence product lines. These SKUs represent Segment A
• Product sizes in incontinence are trending towards      sold to top accounts.
  bigger sizes and longer pads given the high incidence
  of obesity in the US (46 – 67% of obese women are
  incontinent).
Planning Strategy – IBA & Phase In • Incontinence has a higher incidence of IBAs than traditional feminine care. • IBAs present a challenge from a demand forecasting perspective given that there is very little lead time (typically only 2-4 weeks) for this type of business activity. • Unexpected shipments, the result of an IBA, cause supply chain disruptions that result in CFR values
Distribution Strategy
• The Company recently adopted a mixing center
strategy to give customers more flexibility when
placing orders (i.e. instead of placing orders for a single
product type by the truckload that would ship directly
from the manufacturing plant, customers now place
orders that mix and match commodities to their needs
and ship from a centralized mixing center).
• Feminine care and incontinence are typically last on
truck for mixed loads because they are the lightest
products and, as a result, also the first thing to come
off the truck.
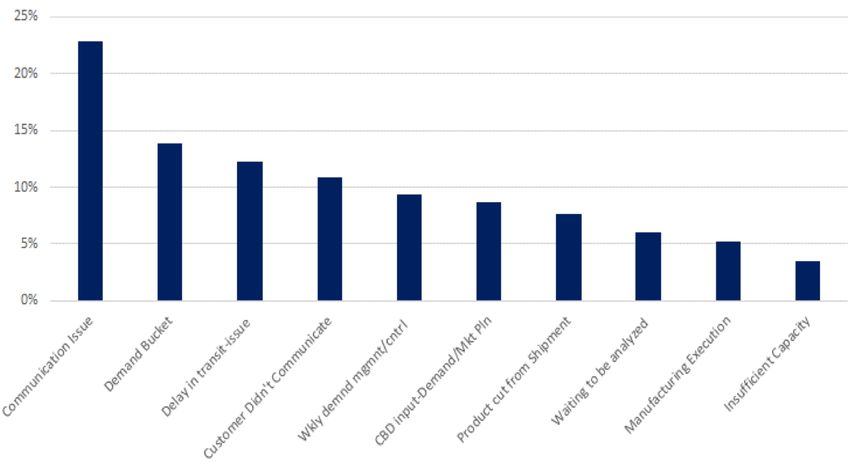
• The Company tracks and diagnoses root causes for low
CFR on a month-to-month basis. Fig 3. Root cause analysis for low CFR for the months July 2017
through October 2017.
• Highest cause of low CFR is either communication or
distribution related.Conclusions & Recommendations Key Insights • Segmenting inventory by both product category and SKU into high, medium, and low volume categories is more practical from a strategic inventory management perspective than segmenting by replenishment stream. • Initiative Phase-In activity must be executed in a consistent, organized manner to ensure that this demand is properly incorporated into the forward- looking Base Demand forecast after the product launch phase expires. • Simple events, such as product being left off the truck in a cube or weigh out event, can disproportionately impact end customer service level for lighter weight CPGs overtime.
Questions

References.
Centers for Disease Control & Prevention, 2014.

Neale and Willems: Managing Inventory in Supply Chains with
Nonstationary Demand Interfaces 39(5), pp. 388–399, ©2009
INFORMS

“The Grey Market”, The Economist, April 9, 2016.
You can also read