Understanding FFT Windows
←
→
Page content transcription
If your browser does not render page correctly, please read the page content below
APPLICATION NOTE
AN014
                                                                                      Understanding
                                                                                       FFT Windows
Introduction                                                        The Fast Fourier Transform (FFT) is the Fourier
FFT based measurements are subject to errors from                   Transform of a block of time data points. It repre-
an effect known as leakage. This effect occurs when                 sents the frequency composition of the time signal.
the FFT is computed from of a block of data which is                Figure 2 shows a 10 Hz sine waveform (top) and the
not periodic. To correct this problem appropriate win-              FFT of the sine waveform (bottom). A sine wave is
dowing functions must be applied. The user must                     composed of one pure tone indicated by the single dis-
choose the appropriate window function for the specif-              crete peak in the FFT with height of 1.0 at 10 Hz.
ic application. When windowing is not applied correct-
ly, then errors may be introduced in the FFT ampli-
tude, frequency or overall shape of the spectrum. This
application note describes the phenomenon of leak-
age, the various windowing functions and their
strengths and weaknesses, and examples are given
for various applications.

FFT Background
Most dynamic signal analyzers (Figure 1) compute
time and frequency measurements. Time measure-
ments include capturing time traces of measured sig-

Figure 1. Dactron FocusTM (left) and the Dactron PhotonTM (right)
Dynamic Signal Analyzers
                                                                    Figure 2. Time waveform of sine function (top) and FFT (bottom).

nals, including filtering and statistical measures.
Frequency measurements that are computed by most
DSAs include Fast Fourier Transform, Power Spectral                 Leakage
Density, Frequency Response Functions, Coherence                    The FFT computation assumes that a signal is periodic in
and many more. These signals are computed in the                    each data block, that is, it repeats over and over again
DSP from the digitized time data. Time data is digi-                and it is identical every time. Note this was the case in
tized and sampled into the DSP block by block. A block              Figure 2 because there are an interger number of cycles
is a fixed number of data points in the digital time                of the sine wave in the data record. Another type of sig-
record. Most frequency functions are computed from                  nal that satisfies the periodic requirement is a transient
one block of data at a time. A block of data is also                signal that starts at zero at the beginning of the time win-
called a time record or time window.                                dow and then rises to some maximum and decays again
                                                                    to zero before the end of the time window.
When the FFT of a non-periodic signal is computed                  When a Hanning window is applied (top-right), then the
then the resulting frequency spectrum suffers from                 leakage is reduced in the FFT (bottom-right). The result-
leakage. Leakage results in the signal energy smear-               ing spectrum is a sharp narrow peak with amplitude of
ing out over a wide frequency range in the FFT when it             1.0. Notice that it does not have exactly the same shape
should be in a narrow frequency range. Figure 3 illus-             as the FFT of the original periodic sine wave in Figure 3,
trates the effect of leakage. The left-top graph shows             but the amplitude and frequency errors resulting from
a 10 Hz sine wave with amplitude 1.0 that is periodic              leakage are corrected. A Windowing function minimizes
in the time frame. The resulting FFT (bottom-left)                 the effect of leakage to better represent the frequency
shows a narrow peak at 10 Hz in the frequency axis                 spectrum of the data.
with a height of 1.0 as expected. Note the dB scale
is used to highlight the shape of the FFT at low levels.
The right-top graph shows a sine wave that is not peri-
odic in the time frame resulting in leakage in the FFT
(bottom-right). The amplitude is less than the expect-
ed 1.0 value and the signal energy is more dispersed.
The dispersed shape of the FFT makes it more difficult
to identify the frequency content of the measured sig-
nal.

                                                                   Figure 4. Comparison of non periodic sine wave and FFT with
                                                                   leakage (left) to windowed sine wave and FFT showing no leakage
                                                                   (right).

                                                                   Windowing functions are most easily understood in the
                                                                   time domain; however, they are often implemented in the
                                                                   frequency domain instead. Mathematically there is no
                                                                   difference when the windowing is implemented in the fre-
                                                                   quency or time domains, though the mathematical proce-
                                                                   dure is somewhat different. When the window is imple-
Figure 3. Comparison of periodic sine wave (left) and FFT to non
                                                                   mented in the frequency domain, the FFT of the window
periodic (right) with leakage in the FFT.
                                                                   function is computed one time and saved in memory and
                                                                   then it is applied to every FFT frequency value correcting
Windowing Reduces Leakage                                          the leakage in the FFT. This gives rise to one measure
                                                                   of the window's characteristics, known as the side lobe.
In a signal analyzer the time record length is adjustable
                                                                   The FFT of a window has a peak at the applied frequency
but it must be selected from a set of predefined val-
                                                                   and other peaks, called side lobes, on either side of the
ues. Since most signals are not periodic in the prede-
                                                                   applied frequency. The height of the side lobes indicates
fined data block time periods, a window must be
                                                                   what affect the windowing function will have on frequen-
applied to correct for leakage. A window is shaped so
                                                                   cies around the applied frequency. In general, lower side
that it is exactly zero at the beginning and end of the
                                                                   lobes reduce the leakage in the measured FFT but
data block and has some special shape in between.
                                                                   increase the bandwidth of the major lobe.
This function is then multiplied with the time data block
forcing the signal to be periodic. A special weighting
factor must also be applied so that the correct FFT
signal amplitude level is recovered after the window-
ing. Figure 4 shows the effect of applying a Hanning
window to a pure sine tone. The left-top plot shows a
sine tone that is not periodic in the time window with-
out the windowing function resulting in leakage in the
FFT (left-bottom).

 2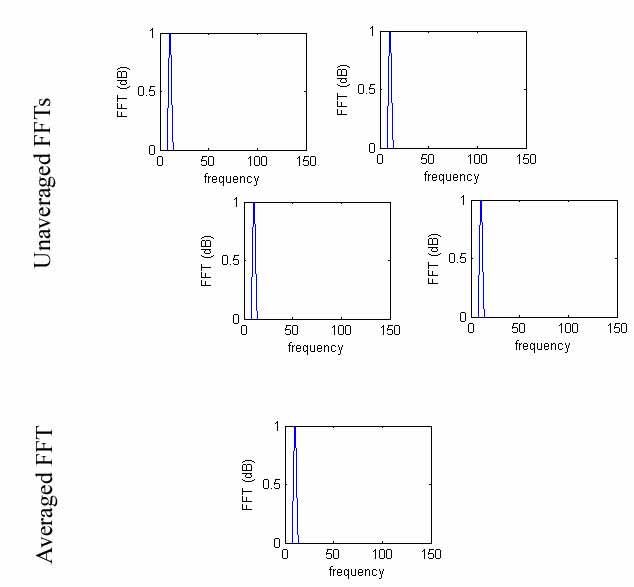
Figure 5 shows the Hanning windowing function and              Figure 8 shows a frequency response function of a beam
its FFT. The highest side lobe is -32 dB. Compare              measured with an impact hammer and accelerometer
this with the Flat Top windowing function in Figure 6.         with and without a window. In this case, leakage drasti-
The highest side lobe is much lower (-74), but the             cally affects the overall shape of the spectrum. The
main lobe bandwidth is significantly wider.                    unwindowed spectrum totally obscures the first anti-res-
                                                               onance and it also caused some aplitude errors in the
                                                               spectrum peaks that correspond to the structure’s res-
                                                               onances.

Figure 5. Hanning window (left) and FFT (right).

                                                               Figure 8. Frequency response function of a beam with and with-
                                                               out window.

                                                               Choosing a Windowing Function
                                                               FFT windows reduce the effects of leakage but can not
                                                               eliminate leakage entirely. In effect, they only change the
                                                               shape of the leakage. In addition, each type of window
                                                               affects the spectrum in a slightly different way. Many dif-
                                                               ferent windows have been proposed over time, each with
Figure 6. Flat Top window (left) and FFT (right).              its own advantage and disadvantage relative to the oth-
                                                               ers. Some are more effective for specific types of signal
A comparison of an FFT of a non-periodic sine wave             types such as random or sinusoidal. Some improve the
with Hanning and Flat Top windows is shown in Figure           frequency resolution, that is, they make it easier to
7.                                                             detect the exact frequency of a peak in the spectrum.
                                                               Some improve the amplitude accuracy, that is, they
                                                               most accurately indicate the level of the peak. The best
                                                               type of window should be chosen for each specific appli-
                                                               cation.

Figure 7. Comparison of Hanning and Flat Top windowing func-
tions with a non-periodic sine wave.

                                                                                                                            3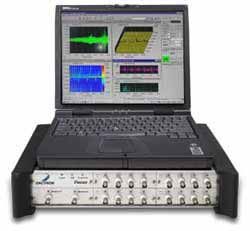
The most common windows and their features are given below. This table can be used to
choose the best windowing function for each application.
Window Best for these Frequency Spectral Amplitude
Signal Types Resolution Leakage Accuracy
Barlett Random Good Fair Fair
Blackman Random or Poor Best Good
mixed
Flat top Sinusoids Poor Good Best
Hanning Random Good Good Fair
Hamming Random Good Fair Fair
Kaiser-Bessel Random Fair Good Good
None (boxcar) Transient & Best Poor Poor
Synchronous
Sampling
Tukey Random Good Poor Poor
Welch Random Good Good Fair
Time Domain Window Shapes
Bartlett Highest Side lobe: -26dB Hanning Highest side lobe: -32 dB
Blackman Highest side lobe: -74 dB Kaiser-Bessel Highest side lobe:-70 dB
Flat Top Highest side lobe: -93dB Tukey Highest side lobe: -13 dB
Hamming Highest side lobe-42dB Welch-Highest side lobe: -21dB
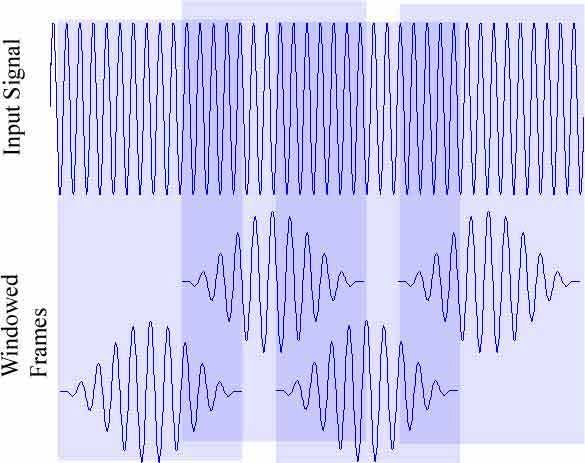
4Overlap Processing Windowing for Impact Measurements
One of the disadvantages of windowing functions is that Another type of windowing, developed especially for modal
the beginning and end of the signal is attenuated in the analysis using an impact hammer, is the exponential win-
calculation of the spectrum. This means that more aver- dow. This window function, shown in Figure 10, has two
ages must be taken to get a good statistical representa- parts, the pre-window at the beginning of the time frame,
tion of the spectrum, increasing the time to complete the and the exponential window. The pre-window includes a
measurement. Overlap processing is a feature that is hold-off period that eliminates any noise before the
available in most signal analyzers that can recover the impact. The length of this hold-off period can be specified
lost data and reduce the measurement time. This pro- by the user to coincide with the pre-trigger time reducing
cessing reduces the total measurement time by recover- the effects of noise. The exponential window applies an
ing a portion of each previous frame that otherwise is lost exponential decay that forces the response data to zero
due to the effect of the windowing function as shown in by the end of the frame resulting in a guaranteed period-
Figure 9. The top pane shows the original continuous ic signal. It should be noted that this will result in an over
input signal. Below the Input Signal are shown the over- estimate of the damping of the structure because the
lapping windowed frames. Next are the unaveraged FFTs windowing function artificially damps the signal in a short-
from each frame, and finally at the bottom is the average er time.
of the FFTs. Overlap processing is particularly effective at
reducing the measurement time for low frequency tests
(generally under 50 Hz) for which the frame acquisition
times are very long.
Figure 10. Force/exponential widow function is used for modal
analysis with impact hammer excitation.
Older signal analyzer hardware was limited in memory
and computational resources, limiting the data record to
as few as 256 points. This limitation made exponential
windowing necessary. Modern signal analyzers contain
more memory and computational resources. When pos-
sible, it is always preferable to use no window by increas-
ing the record length to capture the entire waveform in
one time record.
Figure 9. Overlap processing shortens the acquisition time by
recovering a portion of each previous frame that otherwise is lost
due to the effect of the FFT window
5Examples Case 3. A measurement is performed on a lightly
The following examples describe three applications and damped structure using an impact hammer. A few test
the outline the typical decision making process on select- impacts show that the structure continues to vibrate
ing the appropriate windowing function. after the impact for a time of approximately 1.1 seconds.
The time record on the signal analyzer is set to 800 mil-
Case 1. A structure is excited with a mechanical shaker liseconds and therefore an exponential window is used.
using broadband random noise and an accelerometer is Figure 13 shows the time response of the structure with-
placed on the structure to identify the resonant frequen- out the window in the top frame. Note that the vibration
cies as accurately as possible. According to Table 1, has not died out at the end of the time record. The bot-
Hanning, Hamming, Tukey and Welch produce good fre- tom frame shows the results with the window applied.
quency resolution. Hanning is the most commonly used The vibrations are forced to zero at the end of the time
window function for random signals because it provides record by the exponential window.
good frequency resolution and leakage protection with
fair amplitude accuracy. Figure 11 shows a comparison
of the spectrum with and without a window. The window
reduces the leakage and provides more accurate ampli-
tude measurements for the resonant frequencies.
Figure 11. Spectrum with and without window.
Case 2. The same structure in Case 1 is next subjected
to a pure sine tone at the first resonance frequency to
accurately measure the amplitude ratio between the exci-
tation and the structural response level. According to
Table 1, a Flat Top window function gives the best ampli-
tude accuracy for sinusoidal signals. Figure 12 shows
the frequency response function with the Flat Top win- Figure 13. Time response of lightly damped structure without
dow. Note that the Flat Top window changes the shape exponential window (top) and with window (bottom).
of the peak from a sharp peak to a flat peak, as suggest-
ed by the name.
The plots in figure 13 show the disadvantages of using
an exponential window. Estimates of damping extracted
from the resulting frequency response measurements
will be affected. This effect results from the exponential
window adds artificial damping to the measurements.
Figure 12. Frequency response function using Flat Top window.
6Conclusions
All FFT based measurements assume that the signal is
periodic in the time frame. When the measured signal is
not periodic then leakage occurs. Leakage results in mis-
leading information about the spectral amplitude and fre-
quency. An FFT window can be applied to reduce the
effects of leakage. There are many windows to choose
from, each with advantages for specific applications. You
must understand the effects of leakage and know the
tradeoffs and advantages of the various windowing func-
tions to accurately interpret frequency domain measure-
ments.
References
Hartmann, William M., "Signals, Sound, and Sensation,"
American Institute of Physics, New York, 1997.
Ramirez, Robert W., "The FFT, Fundamentals and
Concepts," Prentice-Hall, New Jersey, 1985.
Ziemer, Rodger E., et. al., "Signals & Systems," Prentice
Hall, New Jersey, 1998.
Copyright © 2003 LDS AN014 1203
Focus and Photon are trademarks of LDS.
UK LDS Ltd. Tel: +44 (0) 1763 242424
USA LDS Inc. Tel: +1 203 265 7966 Send all E-mail inquiries to:
FRANCE LDS SARL Tel: +33 (0) 1 69 11 21 30 sales@lds-group.com
GERMANY LDS GmbH Tel: +49 (0) 89 969 89 180
www.lds-group.comYou can also read