The Meteo-Climatological Observatory in Antarctica: an Overview, as Browseable on the Web.
←
→
Page content transcription
If your browser does not render page correctly, please read the page content below
X workshop Porano 2003

The Meteo-Climatological Observatory in Antarctica:
     an Overview, as Browseable on the Web.
               L. De Silvestri1, U. Gentili1, P. Grigioni1, A. Pellegrini2
                              1
                                  ENEA – CLIM-OSS (Rome, Italy)
                                  2
                                    ENEA – ANTAR (Rome, Italy)

Summary

The Meteo-Climatological Observatory in Antarctica, is a research project funded by the
P.N.R.A. It started an observing programme in 1987: now, it consits of a network of 15
Automatic Weather Stations, a Radiosounding Station and several ancillary instruments; in
addition, the Observatory manages all the meteorological instruments used for operational
meteorological assistance. Data are acquired according to the WMO/ICAO standards, they are
stored, processed, verified, and distributed through appropriate communication means.

A Web site http://meteo.pnra.it was developed in order to give information about the role and
activities of the Observatory, and to give public access to the data.

Introduction

The scientific context of the meteorological observatories deals with the detection and
characterization of global changes in Antarctica. Antarctic environment is thought to be
particularly sensible to climatic changes: the mechanisms by which Antarctica might have a
considerable importance for global changes include, e.g., the ice-albedo feedback and the
modification of the mass balance of the Antarctic ice cap.
Numerical climatological models do not simulate correctly these phenomena, it is therefore
essential to monitor the effects of climatic variations in Antarctica, by means (??) of time
scales varying from a few years to several decades. This is necessary due to the considerable
lack of measurement sites on the mainland and surrounding oceans, while satellite-based
measurement need to be calibrated through surface observations. Amongst climatic variables
to be monitored, surface temperature, cloud cover and precipitation amount are key
parameters.
Generally speaking, the main goal that the meteorological observatory would like to reach, is
the continuity and the accuracy of the measures, in order to produce a data set that might be
used for meteo-climatological and atmospheric studies, to the local weather forecasting and
for scientific activities using meteorological data as support.
Therefore, during Antarctic expeditions, the main job is to carry out the maintenance of the
automatic data survey stations and the recovery of the data collected locally by solid state
memories (ground data), the execution of the atmospheric soundings (in order to collect data
from upper atmospheric layers), and the maintenance of equipment used in the Terra Nova
Bay meteorological office.
Recently, stations located in the antarctic Plateau were equipped with sensors for the
measurement of snow accumulation/ablation.
On 1987, an atmospheric radiosounding station was installed, at the meteorological laboratory
of the Italian base: the system includes a meteorological station for data collection at ground
level, a receiving ground station (VAISALA Marwin 12), which receives data transmitted via
radio by the sonde and stores them in a computer with a dedicated software which shows, in
real time, the trend of the measured parameters. The data received are stored in ASCII files,
and then coded in the standard meteorological format "TEMP" to send them to the Global
Communicatio System of the World Meteorological Organization (WMO-GTS).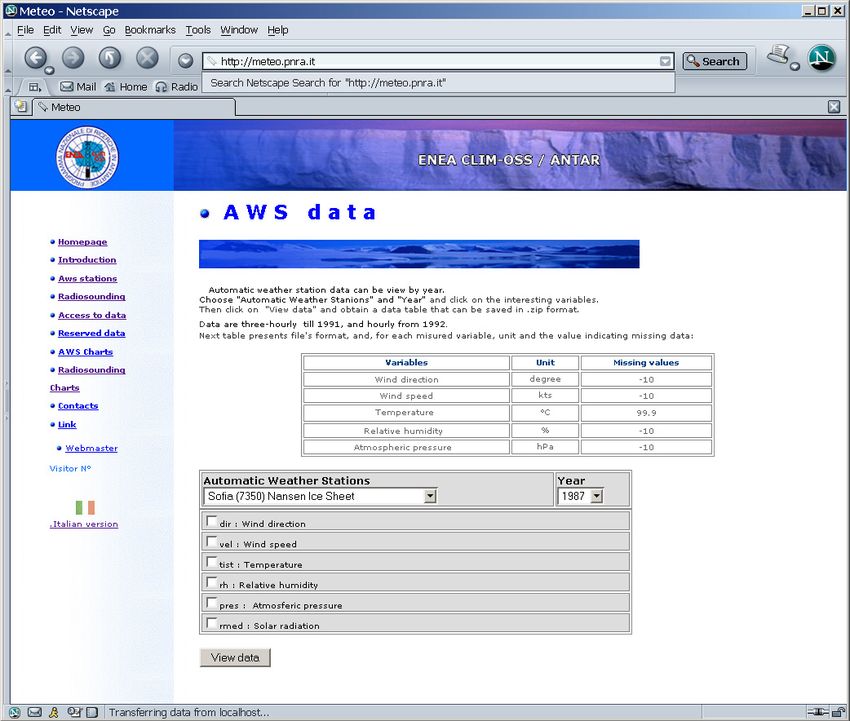
During the presence of the expedition in Antarctica, two balloons are launched every day at
00:00 and 12:00 UTC to measure temperature, pressure relative humidity and wind.

The Web site was born in order to store climatological data from Aws and Radiosounding, and
permit to researcher to use them obtaining real time charts; then, whith use, were added all
data produced daily in Terra Nova Bay : TAF, METAR, SYNOP, Meteo bulletins, Satellite
images, ecc..
User can view data, download them, obtain charts.

In figure 1 it is shown the homepage of the Web site

                                            Figure 1

AWS stations

From “AWS Stations” you can have a look about the Automatic Weather Stations. They were
installed in Antarctica during expeditions, starting from 1987. The years of operation and data
logging for each of them starting from the first activation, are reported in red in the table of
Figure 2.

Itase did not work continuosly but only in those years when antarctic plateau was crossed by
the corresponding "International Trans-Antarctic Scientific Expedition".
Italica is activated for two months on the tender (??) during navigation.
Penguin collects data in Edmonson point remote camp only during base opening.
Alfa & Bravo collect wind data along C130 runway when intercontinental flights from New
Zealand to Antarctica are operated (October-December); data are sent directly to the
Operation Room and are not stored.
Minni collects wind data along Twinotter runway in Browning pass; it is mounted in november
and disassembled at the end of the season (February); these data too are sent directly to the
Operation Room and are not stored.
Sofia was moved on november 2002 ; since the name is bound to the site, it was re-named
Sofia-B; argos code is the same.

ID is the Argos CLS identification number of the station through which the station transmits
data collected to Europe. Stations not having it, record data only on the local memory (Flash
card or Eprom).
Figure 3,4,5 show where AWS are located: it is a quadrilateral, one side of which is the coast
of Ross Sea, and the other is 700 km towards the Antarctic Plateau
Aws stations are located on the most meaningful place for Terra Nova Bay Station.

                 Figure 2                                        Figure 3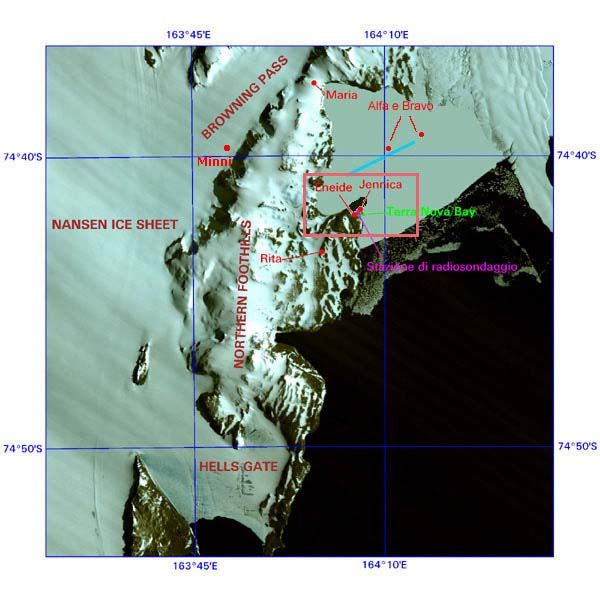
Figure 4                                        Figure 5

Radiosounding

An atmospheric radiosounding station was installed, on 1987 at the meteorological laboratory
of the Italian base: the system includes a meteorological station for data collection at ground
level, a receiving ground station (VAISALA Marwin 12), which receives data transmitted via
radio by the sonde, and stores them in a computer with a dedicated software which shows, in
real time, the trend of the measured parameters. The data received are stored in ASCII files,
and coded in the standard meteorological format "TEMP" to send them to the WMO-GTS. The
two daily files are obtained through the lauch of two balloons at 00:00 and 12:00 GMT, if the
weather allows to do it, which contain, for each standard level, geopotential height,
temperature, humidity and wind.
In Figure 6 the ballon and sonde: it raises and reaches altitudes between 25 and 30 Km,
according to meteorological conditions.

                             Figure 6

With data collected from radiosounding it is possible with the function "Radiosounding charts"
to obtain charts, examples of which are shown in Figure 7.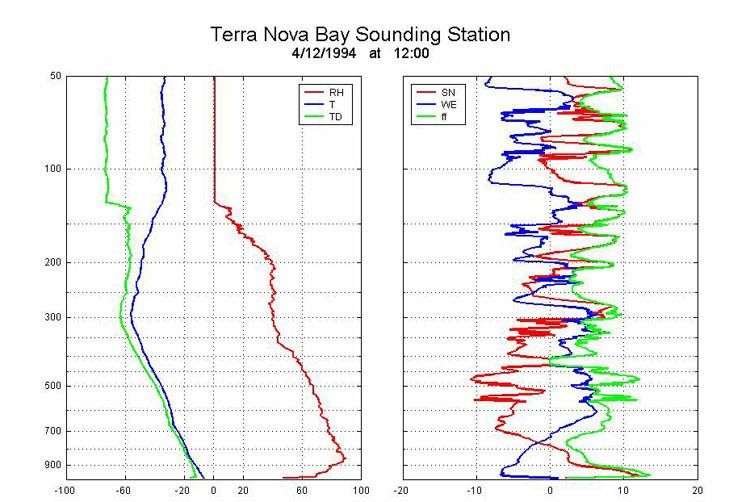
Figure 7
Access to data
Stored data are incomplete and not homogeneous for all expeditions both because not all of
them were collected starting from the firts expeditions, and because they were collected and
stored in different ways due to frequent changes of needs and personnel.
In recent years we tried to standardize all data. The table which follows (Figure 8) reports
all existing data divided by type.
"x" indicates that data exist for subject expedition.
Figure 8
In Figure 9 the procedure to obtain data (in the example "Temp" data). It is possible to view
data or download them; to view data choose the expedition and then month and day: they are
presented in their own format. To download data choose the expedition, and a file in zip
format, containing all data for the expedition, is saved on the computer.
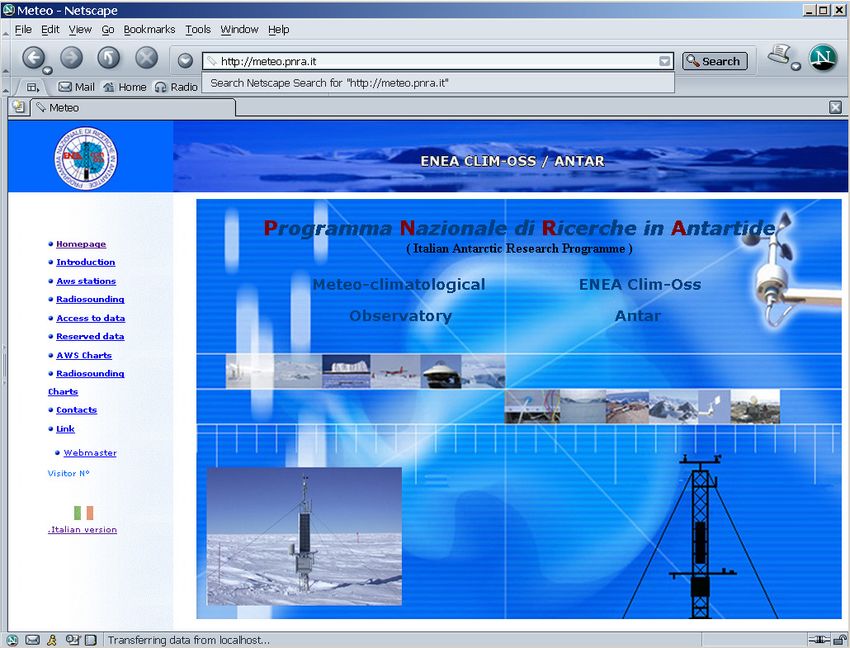
Automatic weather station data can be view by year.
Choose "Automatic Weather Stanions" and "Year" and click on the interesting variables.
Then click on "View data" and obtain a data table that can be saved in .zip format.
Data are three-hourly till 1991, and hourly from 1992. (Figure 10)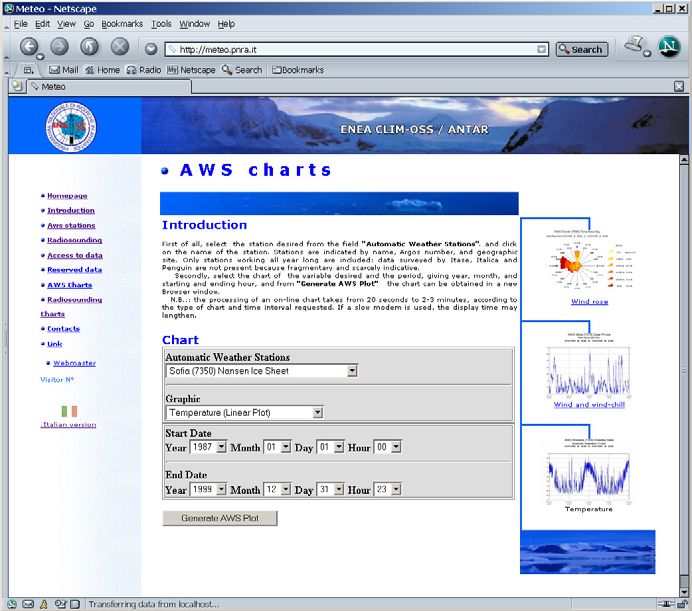
Figure 9

Figure 10
Aws charts

First of all, select the station desired from the field "Automatic Weather Stations". and
click on the name of the station. Stations are indicated by name, Argos number, and
geographic site. Only stations working all year long are included: data surveyed by Itase,
Italica and Penguin are not present because fragmentary and scarcely indicative.
    Secondly, select the chart of the variable desired and the period, giving year, month, and
starting and ending hour, and from "Generate AWS Plot" the chart can be obtained in a
new Browser window.
   N.B..: the processing of an on-line chart takes from 20 seconds to 2-3 minutes, according to
the type of chart and time interval requested. If a slow modem is used, the display time may
lengthen. (Figure 11)
In another windows is shown the chart. We report here two examples of charts (Figure 12 and
13).

                           Figure 11

Not all AWS are included, but only the twelve stations for whom data are significant. Charts
obtainable are:

Temperature (Linear Plot)
Relative Humidity (Linear Plot)
Atmospheric Pressure (Linear Plot)
Wind Speed (Linear plot)
Wind Direction (Linear Plot)
Wind (Wind Rose)
Wind (Mean Distribution)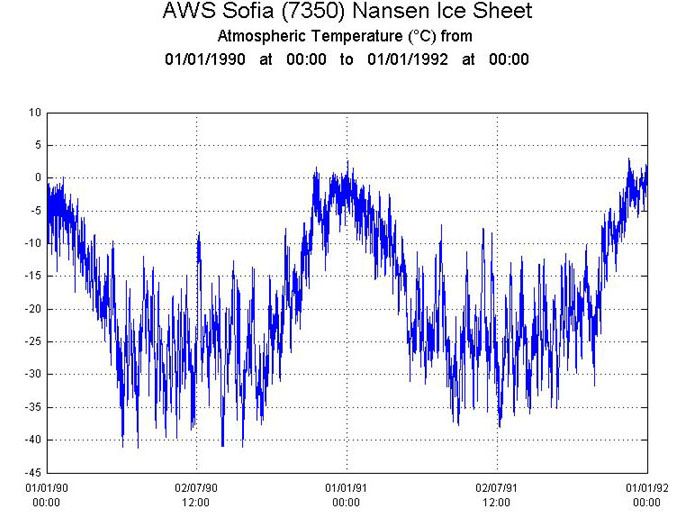
Figure 12 Figure 13
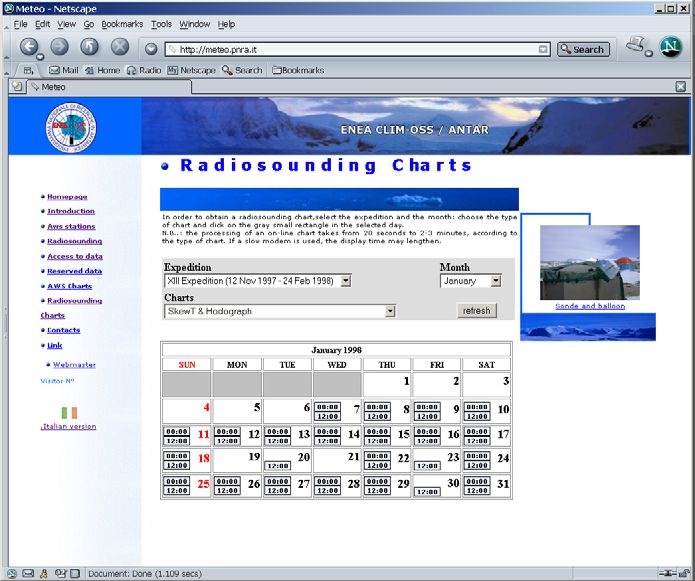
Radiosounding charts
In order to obtain a radiosounding chart,select the expedition and the month: choose the type
of chart and click on the gray small rectangle in the selected day (Figure 14). If the rectangle
is not presented, that day the Radiosoundig was not made, generally for the bad weather
conditions.
N.B..: the processing of an on-line chart takes from 20 seconds to 2-3 minutes, according to
the type of chart. If a slow modem is used, the display time may lengthen.
Figure 14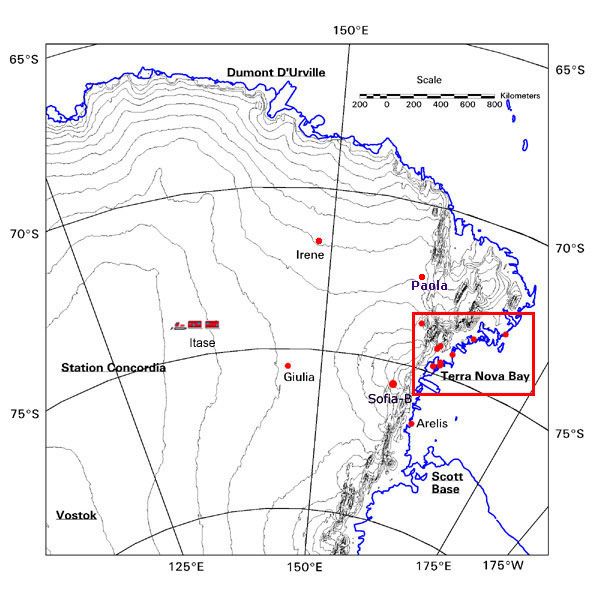
Charts obtainable are:

T, RH, TD, Wind Speed & Components (vertical plot)
Rel. Hum. (contour ±2days & vertical plot)
Temperature (contour ±2days & vertical plot)
Dew Point (contour ±2days & vertical plot)
Mixing Ratio (contour ±2days & vertical plot)
Wind Speed (contour ±2days & vertical plot)
Wind Direction (contour ±2days & vertical plot)
Wind SN Components (contour ±2days & vertical plot)
Wind WE Components (contour ±2days & vertical plot)

We report here two examples of charts (Figure 15 and 16).

                  Figure 15                                        Figure 16

Reserved data

Access in this page is allowed only to that people that has a userid and a password. For
obtanai a userid, please contact

Dr.Andrea Pellegrini
PNRA /C.R. Casaccia
Sacco postale N° 123
S.P. Anguillarese, 301
00060 S.Maria di Galeria (RM)
andrea.pellegrini@casaccia.enea.it
Tel: 06-30484165
Fax: 06-30484893

In this page is possible find the complete real time data transmitted through Argos CLS.
They are stored every hour in text format files such as:
20010501.txt (2001: year, 05: month, 01: day) and contains data collected by weather
stations, oneonce every six hours (sometime some data are missing).
    Data are presented in the of tables, as shown below, and contain, besides station Argos
number, the following data:

1)-   Date-hour in the form:    Year-month-day-hour
2)-   d(deg):                   Wind direction (degree)
3)-   f(kt):                    Wind speed (knots)
4)-   fx(kt):                   Max wind speed (knots)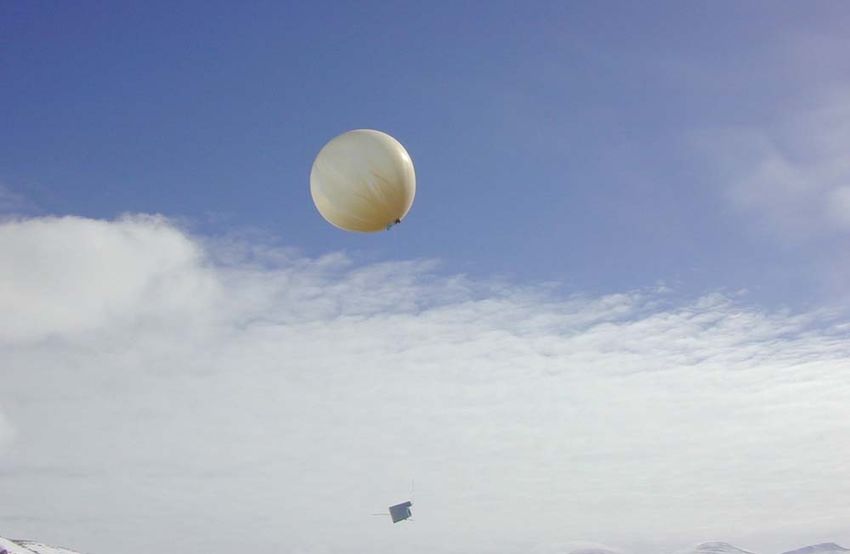
5)-    T(C):      Temperature (degrees)
6)-    Tx(C):     Max temperature (degrees)
7)-    Tn(C):     Min temperature (degrees)
8)-    UR(%):     Relative humidity (percentage)
9)-    P(hPa) :   Pressure (ettopascal)
10)-   (W/m2):    Solar radiation (Watts)
11)-   bat(V):    Bactery voltage (Volts)
You can also read