OECD.Stat Web Browser User Guide - June 2021 - OECD Statistics
←
→
Page content transcription
If your browser does not render page correctly, please read the page content below
OECD.Stat Web Browser                      User Guide 2021

                   OECD.Stat Web Browser
                        User Guide

                           June 2021

                                                        1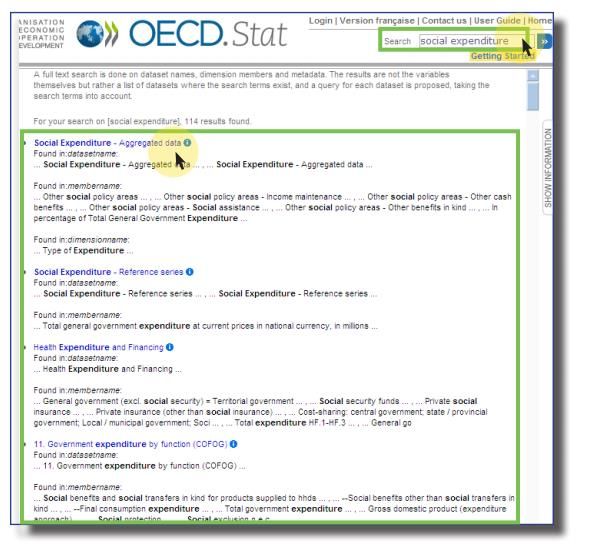
OECD.Stat Web Browser                            User Guide 2021

                        https://stats.oecd.org

                                                              2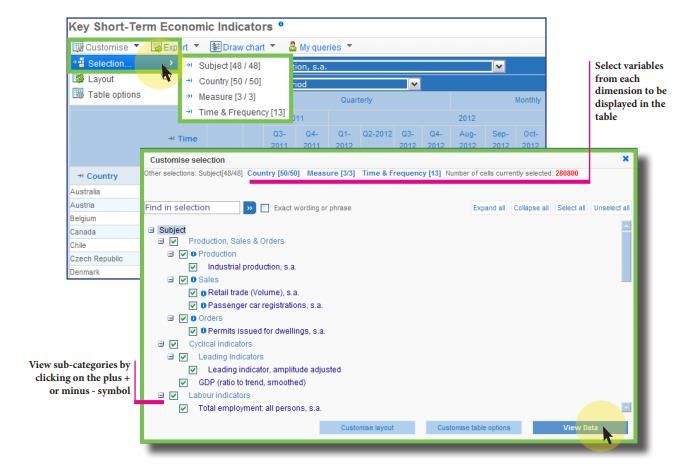
OECD.Stat Web Browser                                                                                                         User Guide 2021

Table of contents
INTRODUCTION .................................................................................................... 4
  OECD.Stat Concepts .......................................................................................... 4
  Data Organisation ............................................................................................. 4
     Datasets ........................................................................................................ 4
     Dimensions.................................................................................................... 4
     Variables........................................................................................................ 4
     Metadata....................................................................................................... 4
     Flags .............................................................................................................. 4
     Query............................................................................................................. 5
     Reference Series ............................................ Error! Bookmark not defined.
USER GUIDE .......................................................................................................... 5
  Getting Started Page ......................................................................................... 5
  Language Selection ........................................................................................... 6
  Locating Data through the OECD.Stat Search ................................................... 7
  Locating Data by Browsing Themes .................................................................. 8
  Locating a Dataset or a Query in the Theme List .............................................. 9
  Using the Table Features ................................................................................ 10
  Selecting Dimensions and their Variables....................................................... 11
  Customise Selection: Colour Coding ............................................................... 12
  Changing the Time/Period and Frequency ..................................................... 13
     Time Range Selection .................................................................................. 13
     Time Period Selection ................................................................................. 14
  Adjusting the Dataset View by Moving Dimensions ....................................... 15
  Formatting Options ......................................................................................... 17
  Showing Codes Instead of Names................................................................... 18
  Hiding Empty Rows or Columns ...................................................................... 19
  Exporting to Excel ........................................................................................... 20
  Exporting to a CSV file..................................................................................... 21
  Downloading related files and large data selections ...................................... 22
  Exporting to PC-Axis Table .............................................................................. 23
  Exporting to SDMX .......................................................................................... 24
  Exporting via Developer API ........................................................................... 25
  Viewing Metadata........................................................................................... 26
  Other Related Metadata ................................................................................. 26
  Flags ................................................................................................................ 27
  Working with Queries ..................................................................................... 28
     Saving a Query ............................................................................................ 28
  Viewing Frequently Requested and Saved Queries ........................................ 29
  Providing Feedback ......................................................................................... 31

                                                                                                                                           3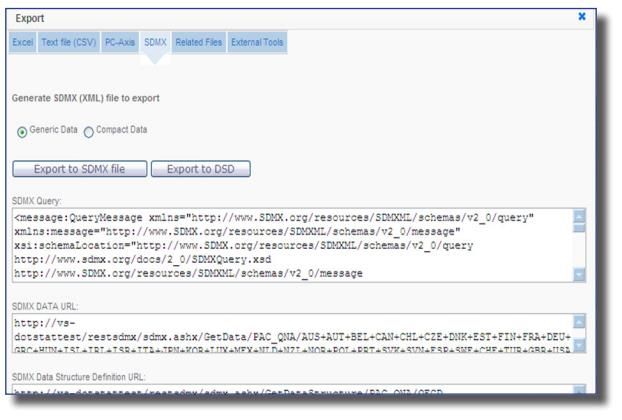
OECD.Stat Web Browser User Guide 2021
Introduction
OECD.Stat is the statistical online platform of the OECD where users can search and access OECD’s statistical
databases. Working within individual datasets, you will be able to:
Build tables by selecting variables and customising the table layout
Extract and download large volumes of data (up to 100,000 cells in Excel, and 1,000,000 in CSV
format)View detailed metadata on methodology and sources
OECD.Stat Concepts
OECD.Stat is structured around these main concepts:
Information catalogued by themes, datasets, dimensions, variables and reference series
Storage of metadata ranging from the dataset to the cell level
Storage of numeric data figures, as well as cell-level flags
A data warehouse search engine
Data Organisation
Datasets
Within OECD.Stat, statistical data are organised into datasets. A dataset is a collection of numerical values with
associated textual information. All values share a common set of dimensions.
Dimensions
The dimensions of a dataset are the axes on which the data are labelled. Country and year are two common
examples of dimensions. Dimensions can be presented as either a flat list or as a hierarchy with dimension
subsets.
Variables
Every dimension contains a pre-defined list of variables. In the country dimension for example, the variables
are the individual countries.
Metadata
Metadata is the qualitative data that describes the empirical data in OECD.Stat. Metadata can be viewed for
datasets, dimensions and variables alongside the table.
Flags
A flag is a letter that appears alongside the numerical data in any table cell where it applies. It is a qualitative
note that recurs in a dataset for many individual data figures. A legend appears beneath the table, explaining
the meaning of each flag present in the table. Flags frequently indicate general data properties such as
“confidential”, “provisional” and “estimated”.
4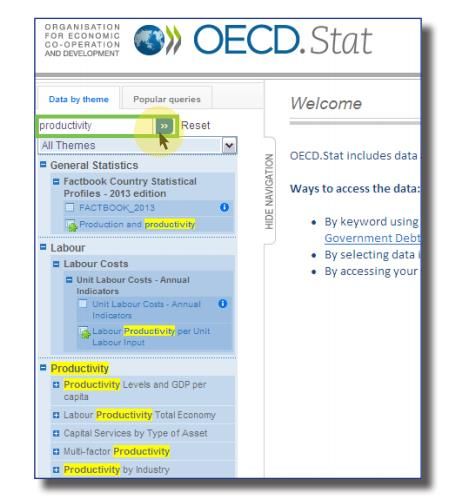
OECD.Stat Web Browser User Guide 2021
Query
A query is a pre-defined set of data within a dataset to highlight a certain topical content of the overall
dataset. Queries appear alongside of datasets.
User Guide
This user guide walks you through basic and more advanced features of OECD.Stat.
Getting Started Page
The browser is best used in full-screen view at 1024x768 pixel screen resolution or higher.
From the Welcome page, you may find data in the following ways:
Search OECD.Stat by Keyword
Browse Themes
Search Themes by Keyword
FIGURE 1: OECD.STAT BROWSER WELCOME PAGE
5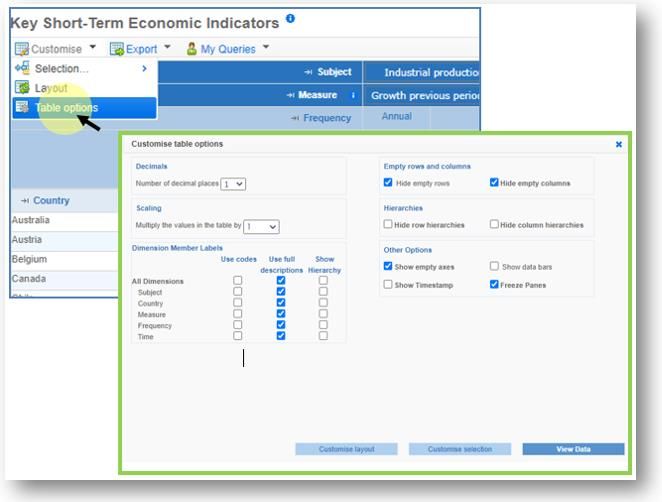
OECD.Stat Web Browser                                                                       User Guide 2021

Language Selection
You can view the interface and data in English or French. To change the language, click on the language option
located in the top right-hand corner of the screen.

                                FIGURE 2: CHANGING THE LANGUAGE OF THE BROWSER

                                                                                                             6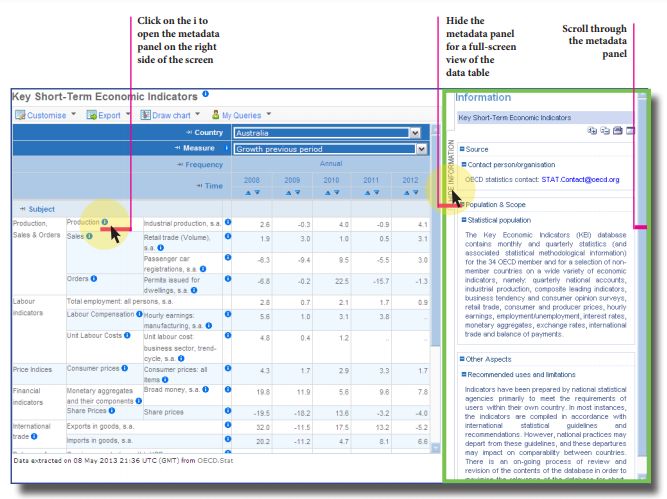
OECD.Stat Web Browser                                                                         User Guide 2021

Locating Data through the OECD.Stat Search
Enter keywords in the OECD.Stat Search box in the top right-hand corner of the screen. OECD.Stat will search
through dataset names, dimension names, variable names, and metadata for the keywords you entered.

You will get a list of search results, which includes a link to the dataset where the keywords were found, and
details of where the keywords appear in the dataset. To open a dataset, click on the link.

NOTE: Once you click on a link, you are not be able to navigate back to the search results. Run the search again
if you want to click on another link.

The most relevant links are shown first, based on how often the keyword appears in each dataset. A keyword
in the name of a dataset is considered more relevant than a keyword found only in one of the variables of a
dimension in the dataset or in the metadata.

                         FIGURE 3: RESULTS FROM THE SEARCH RANKED IN ORDER OF RELEVANCE

                                                                                                                 7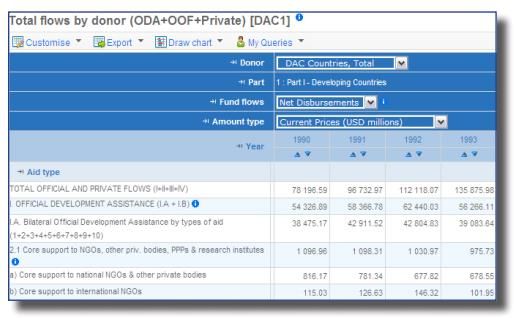
OECD.Stat Web Browser                                                                     User Guide 2021

Locating Data by Browsing Themes
Browse the Data by Theme panel by clicking on a theme title, then on a sub-theme title and so forth
until you can select a dataset.

Datasets are marked by the table icon in front of their name. When you click on a dataset, a default
table view opens. This view can be customised (see next section).

                               FIGURE 4: BROWSING THROUGH THEMES TO VIEW DATA

                                                                                                       8
OECD.Stat Web Browser                                                                           User Guide 2021

Locating a Dataset or a Query in the Theme List
Search across themes and datasets by entering a keyword in the text box at the top of the Data by Theme panel.

All themes and dataset titles that contain the keyword are listed and the keyword is highlighted in yellow.

To start over, simply click Reset to the right of the text entry box and enter a new keyword in the text entry box.

                                 FIGURE 5: FINDING A THEME OR DATASET BY KEYWORD

This method also allows a quick look up for well-known OECD data sets by their acronym, e.g. MEI, STAN,
ITCS, etc.

                                                                                                                 9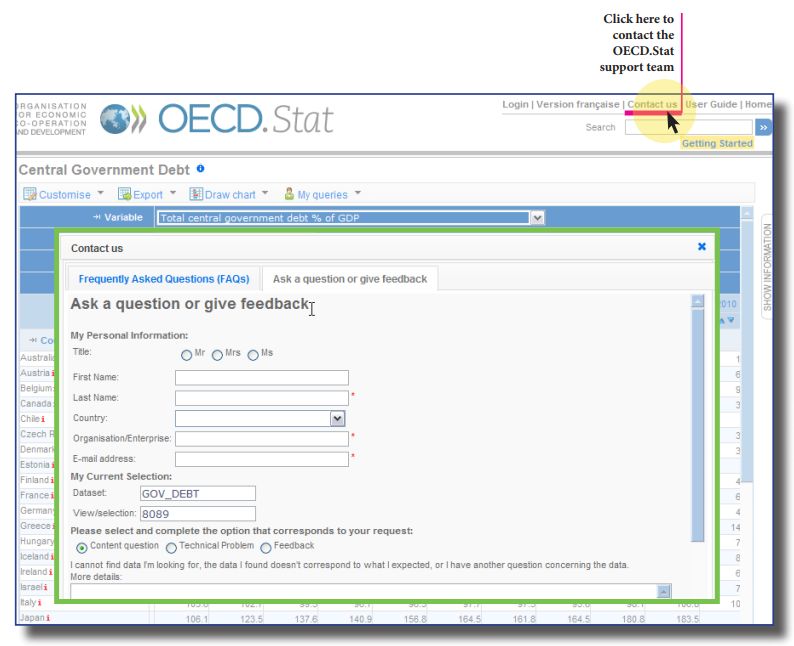
OECD.Stat Web Browser User Guide 2021
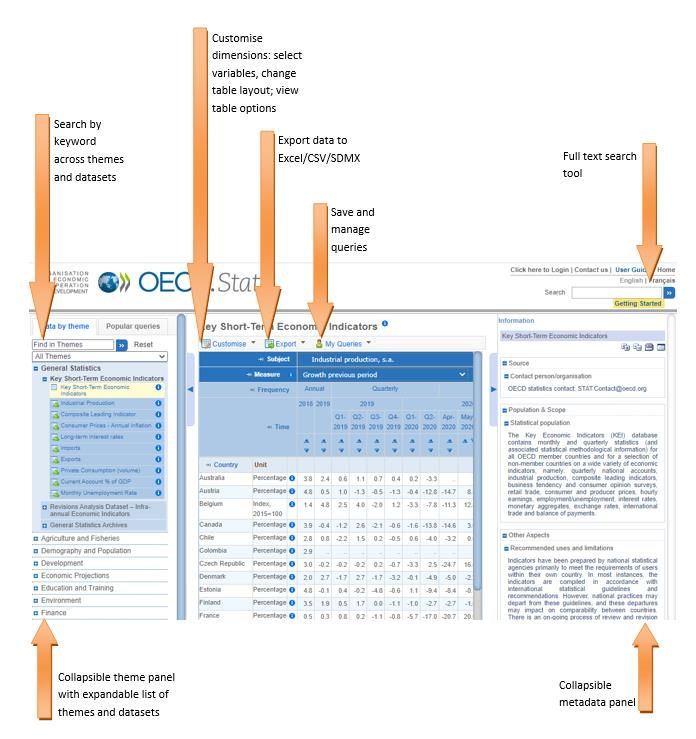
Using the Table Features
When you first open a dataset, you see the default table view. Use the options at the top of the table to modify
the default data selection.
FIGURE 6: DEFAULT DATASET VIEW AND CURRENT SELECTION VALUES
Click on:
Customise - to select variables for each dimension and change the table layout and display options.
Export - to download and save your selection as a MS Excel, CSV, PC-Axis, or SDMX file.
My Queries - to save the current table view as a personal query for further work. You need to log in first
to take full advantage of all query features.
10OECD.Stat Web Browser User Guide 2021
Selecting Dimensions and their Variables
Select variables in each dimension by clicking on the Customise option at the top of the table and then the
Selection option from the drop-down menu.
FIGURE 7: CUSTOMISE THE SELECTION OF VARIABLES FOR EACH DIMENSION
To select or unselect a variable, click the check box to the left of the variable.
A plus (+) or minus (-) symbol appears next to the variable name if the variable has a sub-category. Click on this
symbol to show or hide the variables of the sub-category.
Click View Data to apply your selection of variables for the current dimension and to see a table corresponding
to this new selection.
Alternatively, after selecting variables for one dimension, continue modifying the other dimensions shown
across the top of the pop-up screen before viewing the new table.
You may also search for variables in the Customise Selection pop-up by typing a keyword in the search box for
a given dimension.
11OECD.Stat Web Browser User Guide 2021
All variables containing the keyword will be displayed.
FIGURE 8: SEARCH VARIABLES BY KEYWORD WHEN CUSTOMISING DIMENSIONS
Customise Selection: Colour Coding
Colour coding helps you see if data exist for a particular variable. This way, you will not waste time searching
for data that does not exist.
When modifying dimensions in the Customise Selection window, you see that variable names are different
colours. The colours indicate whether data exist or not for a given variable.
Based on the current selection for all other variables…
‒ Dark Blue: Data exist for this variable.
‒ Blue: No data exist for this variable, but may exist for sub-categories of this variable.
‒ Gray: No data exist at any level for this variable.
Remember: The colour coding takes into account the current selection for all other variables. In other words,
the colours indicate the existence of data for the countries, years, etc. currently selected.
12OECD.Stat Web Browser User Guide 2021
Changing the Time/Period and Frequency
There are two ways to select the time/period and frequency variables:
Select the time range
Select the time period
Time Range Selection
All frequencies available for the selected dataset are shown on the screen. For example, if only annual data are
available, the option to select quarters and months will not appear.
First check the boxes next to the frequencies to be included in the selection. Then choose either a specific range
of dates (from 1980 to 2000, for example) by clicking Select Date Range, or indicate that you wish to have the
most recent data available (last 5 years, for example) by clicking Select Latest Data.
When selecting a date range, it is possible to select a start year, quarter, month, etc. and automatically include
all available data from that date onward by checking the box next to Latest Available Data.
FIGURE 9: TIME RANGE SELECTION
13OECD.Stat Web Browser User Guide 2021
Time Period Selection
It is also possible to select individual years, quarters, months, etc. by checking the box next to each item. This is
necessary if the selection of dates you wish to include is not a continuous series and contains breaks or time
periods outside the main date range.
FIGURE 10: TIME PERIOD SELECTION
Note: It is advisable to first select a general range of dates using the Select Time Range option, and then include
or exclude individual time periods using the Select Time Period option.
Similarly, you may lose selected individual time periods if you make changes in the Select Time Period option
before using the Select Time Range option.
The Select Time Range option only manages continuous, non-broken series of dates.
14OECD.Stat Web Browser User Guide 2021
Adjusting the Dataset View by Moving Dimensions
The different dimensions of a dataset can be displayed on either the horizontal or vertical axis of a table, or in
the filter area at the top of the table. To move a dimension from one place to another, click on the Customise
option at the top of the table and then the Layout option from the drop-down menu. A dialog box pops up that
allows you to visually drag and drop a dimension in the desired location.
FIGURE 11: MOVING A DIMENSION TO CHANGE THE DATA TABLE LAYOUT
15OECD.Stat Web Browser User Guide 2021
If there is more than one variable selected for a dimension located in the filter area at the top of the table, click
on the variable to open a drop-down menu displaying all variables.
To change the filter that is applied to the data, select the desired variable from the drop-down menu.
If the dimension in the filter area does not have a drop-down menu, then only one variable has been selected.
To include other variables, click on the dimension name to the left of the selected variable and check other
desired variables in the pop-up box.
FIGURE 12: CHANGING THE VIEW USING COUNTRY DROP-DOWN LIST
16OECD.Stat Web Browser User Guide 2021
Formatting Options
To format the view of the displayed table, click on Customise above the table and then select Table options from
the drop-down menu.
From there you can customise table options:
Decimals: Select the number of decimal points displayed for the data points.
Scaling: Multiply the data points by unit value, hundreds, thousands, hundredths, thousandths, etc.
Dimension Member Labels: View dimension names as codes, descriptive titles or both.
Empty rows and columns: Hide or show rows and columns that contain no data.
Hierarchies: Hide row hierarchies and/or column hierarchies.
Other Options: Show empty axes, show timestamps of when the data was uploaded and/or show data
bars to more easily visualize the data trends within each cell, and freeze panes to navigate in the table
with the header always visible at the top (this option is not available with Internet Explorer).
FIGURE 13: CUSTOMISING TABLE OPTIONS
17OECD.Stat Web Browser User Guide 2021
Showing Codes Instead of Names
All datasets, dimensions and variables have short codes as well as names.
To display codes instead of names in the table, click on Customise above the table, select Table options from
the drop-down menu and then select the option Use codes instead of Use full descriptions.
To show both codes and full descriptions, select both Use codes and Use full descriptions.
FIGURE 14: TABLE SHOWING CODES INSTEAD OF NAMES
18OECD.Stat Web Browser User Guide 2021
Hiding Empty Rows or Columns
If a table has many rows or columns containing no data, it can be useful to hide these rows or columns in order
to condense the table and improve readability.
To hide empty rows or columns, click on Customise above the table, select Table options from the dropdown
menu and then select the option Hide empty rows, Hide empty columns, or both.
FIGURE 15A: BEFORE USING THE HIDE EMPTY ROWS AND COLUMNS OPTIONS
FIGURE 15B: DATASET VIEW WITH EMPTY ROWS AND COLUMNS HIDDEN
19OECD.Stat Web Browser User Guide 2021
Exporting to Excel
Click on the Export option above the table and then select Excel to export your data selection to a MS Excel
file. You are prompted to either save the MS Excel file to disk or open it directly. As your computer settings
may not allow for the file to be directly opened, it is recommended that you save the file to your desktop and
then open it from there. The maximum size of the file is limited to 100,000 data points.
FIGURE 16: USING THE EXPORT TO EXCEL OPTION TO SAVE DATA IN EXCEL FORMAT
20OECD.Stat Web Browser User Guide 2021
Exporting to a CSV file
Larger tables can be saved to a CSV file.
Click on the Export option above the table and then select Text file (CSV). The maximum size of the file is limited
to 1,000,000 data points.
Select a Dimension / Unit / Flag format and the Text File format. The Dimension / Unit / Flag format determines
what information is included in your file for each variable. The column separator determines which character is
used to separate columns in the file.
FIGURE 17: USING THE EXPORT TO CSV OPTION TO SAVE DATA AS A CSV FILE
21OECD.Stat Web Browser User Guide 2021
Downloading related files and large data selections
Documents related to a particular dataset are available for download under the Export option above the table.
The list of files may contain large prepared selections of data or related documents in any format, which is
indicated in the File type column.
Click on the name of a file to download it.
FIGURE 18: FINDING AND DOWNLOADING FILES RELATED TO A DATASET
22OECD.Stat Web Browser User Guide 2021
Exporting to PC-Axis Table
Click on the Export option above the table and then select PC-Axis to export your data selection to a PC-Axis
table file.
As your computer setting may not allow you to open the file directly, first save the file to your desktop and then
open it.
FIGURE 19: EXPORTING TO PC-AXIS TABLE
23OECD.Stat Web Browser User Guide 2021
Exporting to SDMX
Click on the Export option above the table and then select SDMX to export your data selection to a XML file. The
data is available in compact or generic SDMX XML data format. The structure of the dataset, including the
variable codes and labels is available to export via the Data Structure Definition (DSD) file.
You are prompted to either save the XML file to disk or open it directly. As your computer settings may not allow
for the file to be directly opened, it is recommended that you save the file to your desktop and then open it from
there.
Refer to www.sdmx.org for more information.
Note for developers: There is a prototype web service which uses the standard SDMX REST API for queries. The
technical specification of the RESTful query syntax can be found in the SDMX 2.1 Technical Specification (Section
7 – Web Services Guidelines). You may copy and paste the query in from the SDMX Data URL into your own
software program.
FIGURE 20: EXPORTING TO SDMX
24OECD.Stat Web Browser User Guide 2021
Exporting via Developer API
Click on the Export option above the table and then select Developer API to access the API query builder. Fill
the fields in the top part of the form and click on Generate API query.
Please refer to the API documentation linked at the top right of the pop up window.
FIGURE 21: EXPORTING VIA DEVELOPER API
25OECD.Stat Web Browser User Guide 2021
Viewing Metadata
Metadata can be viewed at all levels: from the dataset-level, down to cell-level footnotes. The presence of
metadata is flagged by a small blue circle with a white “i”. Clicking on the “i” reveals an information panel on
the right-hand side of the screen.
When you export a table to an Excel file, the metadata link “i” is still active in the Excel file.
FIGURE 22: DATASET AND CELL-LEVEL METADATA
Other Related Metadata
The metadata panel may contain links to metadata for related datasets as well as contact information.
26OECD.Stat Web Browser User Guide 2021
Flags
Flags represent metadata that recurs frequently within a dataset. Flags appear as letters in parentheses in the
cell alongside the data figures to which they correspond. Any table that contains flags displays a legend below
the table that explains the meaning of each letter.
FIGURE 23: VIEWING THE DATA FLAG LEGEND
27OECD.Stat Web Browser User Guide 2021
Working with Queries
Saving a Query
Before working with queries, log in by clicking on the Login link in the top right-hand corner of the screen.
Once logged in, your name appears in the top right-hand corner of the screen.
Your data selection, or query, can be saved at any time by clicking on the My queries option above the table
and then selecting Save. In the pop-up box, type the name of the query, and then click the Save as new Query
button. On subsequent visits to the browser, this saved query can be opened to view the latest data available
within the selection.
FIGURE 24: SAVING A QUERY WITH OPTIONAL RENAMING
28OECD.Stat Web Browser User Guide 2021
Viewing Frequently Requested and Saved Queries
Open the Popular Queries panel to access a set of frequently requested pre-defined queries.
If you are logged in, you may access and manage your saved queries under:
My Queries in the Popular Queries panel
OR
Manage under My Queries above the table.
FIGURE 25: USING THE POPULAR QUERIES PANEL TO SELECT A FREQUENTLY REQUESTED TABLE OR A SAVED TABLE
29OECD.Stat Web Browser User Guide 2021
Use the Query Manager to sort and save the list of queries, as well as to open or delete any query.
FIGURE 26: VIEWING SAVED AND RECENT QUERIES
Click the Share button next to a saved query to display the reference URL.
Copy and paste the URL to share your saved query with colleagues, e.g. send via email.
NOTE: Bear in mind that the viewer may need subscription access to a particular dataset in order to view it.
FIGURE 27: SHARING SAVED QUERIES
30OECD.Stat Web Browser User Guide 2021
Providing Feedback
Contact the OECD.Stat Project Team via e-mail using the Contact Us link located in the top right-hand corner of
the screen.
Please fill out the contact form using as much detail as possible to describe your technical or content question.
The e-mail addresses that receive queries from the Contact Us link are
OECDdotStat@oecd.org for technical problems
OECDdotContent@oecd.org for content questions
FIGURE 28: CREATING AN E-MAIL TO THE OECD.STAT PROJECT TEAM
31You can also read