Formación online sobre la Web of Science - Módulo C dirigido a los bibliotecarios y personal administrativo
←
→
Page content transcription
If your browser does not render page correctly, please read the page content below
Formación online sobre la Web of Science
Módulo C dirigido a los bibliotecarios y personal administrativo
Curso C3 – Encontrar las publicaciones más citadas y ver los indicadores de influencia

20 de abril del 2020
Formadora: Anne Delgado
Agenda     • El alcance y cobertura de Essential Science Indicators (ESI)
Curso C3
           • Entender las métricas de desempeño
           • ¿Qué es un Highly Cited Paper?
           • ¿Qué es un Hot Paper?
           • ¿Qué es un Research Front?
           • ¿Qué significa ser un Highly Cited Researcher?
           • Los informes globales de ISI
¿Por qué el
Essential Science
Indicators (ESI)?

                    Essential Science Indicators (ESI) is an analytical tool that helps you identify top-
                    performing research in Web of Science Core Collection. ESI surveys more than 11,000
                    journals from around the world to rank authors, institutions, countries, and journals in
                    22 broad fields based on publication and citation performance.

                                                                                                               4
• Source: Science Citation Index-Expanded (SCIE) and the Social Sciences Citation
Los datos de ESI     Index (SSCI) in Web of Science Core Collection.

                   • Document Types: ESI analyzes articles and reviews from SCIE and SSCI journals to
                     determine how well a paper, organization, etc. is performing.

                   • Depth of Data: ESI data consists of a 10-year rolling file, which increases with each
                     bimonthly update.

                   • Fields: ESI uses 22 broad disciplines to rank entities and identify top-performing
                     papers. Each journal is assigned to only one field, and the research published in that
                     journal will take on that field assignment (In the case of Multidisciplinary journals,
                     reclassification is done at the paper level, based on an analysis of the cited
                     references. This means that papers published in journals
                     like Science and Nature could belong to fields that are more specific
                     than Multidisciplinary)

                   • Citation Counts: Only citations from indexed journals in the Science Citation Index
                     Expanded, Social Science Citation Index and Arts & Humanities Citation Index, are
                     taken into account for ESI purposes.
                                                                                                              5
Recomendación – Registrarse en JCR/ESI con las mismas credenciales

                                                         Nuevo enlaces

      https://www.recursoscientificos.fecyt.es/servicios/informacion     6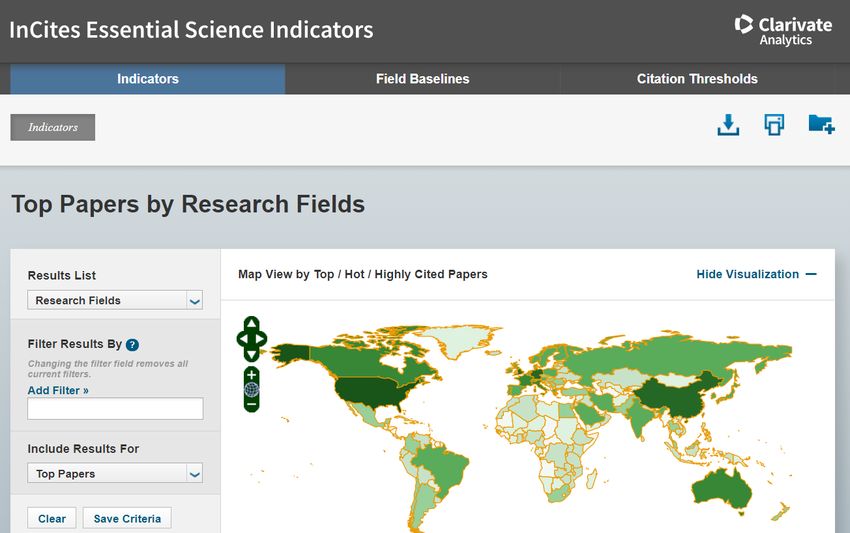
Acceder en remoto (sin Shibboleth)

  Enlaces directos (sólo se puede acceder con una cuenta personalizada)

     • Web of Science: https://webofknowledge.com
     • Journal Citation Reports: https://jcr.clarivate.com
     • Essential Science Indicators: https://esi.clarivate.com

                                                                          7
Agenda     • El alcance y cobertura de Essential Science Indicators (ESI)
Curso C3
           • Entender las métricas de desempeño
           • ¿Qué es un Highly Cited Paper?
           • ¿Qué es un Hot Paper?
           • ¿Qué es un Research Front?
           • ¿Qué significa ser un Highly Cited Researcher?
           • Los informes globales de ISI
Context is everything

       ¿El total de citas acumuladas por esta publicación es alto o es bajo?

                                        25                   1000

               20                  20

                                             Good                Bad
                                                        20

           good or bad?                 0                    0

      Depende del campo de investigación y del año de publicación

                                                                               9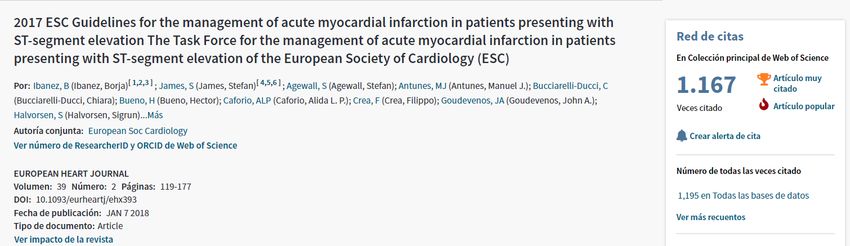
Citation Rates per year and field, allow the comparison of the number of citations for
ESI Field Baselines         specific papers published the same year and indexed in the same field

           Context is everything:
           - Research Fields
           - Publication Year

                                                                                                                     10
Los umbrales de Inclusion in ESI is dependent upon meeting certain citation thresholds. Only the most
highly cited individuals, institutions, journals, countries and papers are included in ESI.
citas en ESI This chart shows the citation thresholds that must be met in order to appear in ESI.
Entity Percentile Data Years
Researchers 1% 10
Institutions 1% 10
Countries 50% 10
Journals 50% 10
Highly Cited Papers 1% 10
Hot Papers 0.1% 2
How to Read This Table: This table shows you the citation performance threshold that an
entity's research needs to meet in order for it to qualify as Highly Cited in a field. Data Years
refers to the years examined - 10 means that the full ESI data file is considered. Percentiles are
inverted, so 1% means that an entity is performing in the top 1% when compared to peers.
11Citation Thresholds
A citation threshold is the minimum
number of citations obtained by
ranking papers in a research field in
descending order by citation count
and then selecting the top fraction
or percentage of papers.
The ESI Threshold reveals the
number of citations received by the
top 1% of authors and institutions
and the top 50% of countries and
journals in a 10-year period.
12Agenda • El alcance y cobertura de Essential Science Indicators (ESI)
Curso C3
• Entender las métricas de desempeño
• ¿Qué es un Highly Cited Paper?
• ¿Qué es un Hot Paper?
• ¿Qué es un Research Front?
• ¿Qué significa ser un Highly Cited Researcher?
• Los informes globales de ISILos umbrales de Inclusion in ESI is dependent upon meeting certain citation thresholds. Only the most
highly cited individuals, institutions, journals, countries and papers are included in ESI.
citas en ESI This chart shows the citation thresholds that must be met in order to appear in ESI.
Entity Percentile Data Years
Researchers 1% 10
Institutions 1% 10
Countries 50% 10
Journals 50% 10
Highly Cited Papers 1% 10
Hot Papers 0.1% 2
How to Read This Table: This table shows you the citation performance threshold that an
entity's research needs to meet in order for it to qualify as Highly Cited in a field. Data Years
refers to the years examined - 10 means that the full ESI data file is considered. Percentiles are
inverted, so 1% means that an entity is performing in the top 1% when compared to peers.
14Algunos ejemplos • Highly Cited Papers are papers that have received enough citations to place them in
the top 1% when compared to all other papers published in the same year in the
de reconocimento same field, i.e. 2008 Physics papers are only compared to other 2008 Physics papers
to determine whether they have been cited enough to rank in the top 1%.
• For Hot Papers, only papers published in the last 2 years are considered. Hot Papers
are receiving citations quickly after publication. These papers have been cited enough
times in the most recent bimonthly period to place them in the top 0.1% when
compared to peer papers. Peer papers are papers that were added to WoS Core
Collection during the same bimonthly update and belong to the same field.
15¿Qué es un artículo muy citado o un artículo candente?
16Highly Cited Thresholds
A citation threshold is the minimum
number of citations obtained by
ranking papers in a research field in
descending order by citation count
and then selecting the top fraction
or percentage of papers.
The Highly Cited Threshold reveals
the minimum number of citations
received by the top 1% of papers
from each of 10 database years.
17Hot Paper Thresholds
A citation threshold is the minimum
number of citations obtained by
ranking papers in a research field in
descending order by citation count
and then selecting the top fraction
or percentage of papers.
The Hot Papers Threshold reveals
the minimum number of citations
received during the most recent
two-month period by the top 0.1%
of papers from the past two years.
18Entrar en Essential Science Indicators
19Los indicadores Ejemplo 1
de ESI
Top Papers = Highly Cited Papers + Hot Papers
20Los indicadores Ejemplo 2
de ESI
Filtro = Spain
21Exportar: PDF, CSV or Excel
22Exportar listas de Highly Cited/Hot Papers
23Guardar informes
24Agenda • El alcance y cobertura de Essential Science Indicators (ESI)
Curso C3
• Entender las métricas de desempeño
• ¿Qué es un Highly Cited Paper?
• ¿Qué es un Hot Paper?
• ¿Qué es un Research Front?
• ¿Qué significa ser un Highly Cited Researcher?
• Los informes globales de ISI¿Qué es un Research Front?
Research Fronts are formed when clusters of highly cited papers are frequently cited together, reflecting a
specific commonality in the research – sometimes experimental data, a method, a concept or a hypothesis.
The ability to identify these Research Fronts and to track emerging specialty areas of research provides a
distinct advantage for governments, policy makers, publishers, research administrators and others who
monitor, support and advance the conduct of research, often in the face of finite resources.
Clarivate Analytics and the Chinese Academy of Sciences released a annual joint report to identify the
hottest and emerging specialty areas in scientific research
Find the report “Research Fronts 2019” here
https://clarivate.com/webofsciencegroup/news/clarivate-analytics-and-the-chinese-academy-of-sciences-release-annual-
joint-report-to-identify-137-research-fronts/
https://discover.clarivate.com/ResearchFronts2019_EN
26¿Qué es un Research Front?
A research front is a cluster of highly
cited papers over a five-year period -
referred to as "core papers“ - in a
specialized topic defined by a cluster
analysis.
Identifying research fronts involves
manipulating the co-cited papers in
order to group together those that are
strongly related.
27¿Qué es un Research Front?
• Research front analysis will not identify all research • Field Classification: Research fronts are assigned to the
areas or all the papers in an area. However, it can 22 broad fields based on the field of the most
assist in identifying areas where important work is frequently occurring journal in the front.
being done and where the scientific community is
focusing its attention.
• A measure of association between highly cited papers
is used to form the clusters. That measure is the
number of times pairs of papers have been co-cited,
that is, the number of later papers that have cited
both of them. Clusters are formed by selecting all
papers that can be linked together by a specified co-
citation threshold.
• The clusters are named using a semi-automatic
process based on frequently occurring title words and
phrases.
28Los Research Fronts en ESI
29Agenda • El alcance y cobertura de Essential Science Indicators (ESI)
Curso C3
• Entender las métricas de desempeño
• ¿Qué es un Highly Cited Paper?
• ¿Qué es un Hot Paper?
• ¿Qué es un Research Front?
• ¿Qué significa ser un Highly Cited Researcher?
• Los informes globales de ISI¿Qué significa ser un “Highly Cited Researcher”?
https://recognition.webofsciencegroup.com/awards/highly-cited/2019/
31¿Qué significa ser un “Highly Cited Researcher”?
Total de Highly Cited Papers en los 10 últimos años
Contexto = Los 21 campos de investigación de ESI
32La ultima edición (Noviembre 2019)
33La ultima edición (Noviembre 2019)
Las distinciones aparecen automáticamente
en el perfil Publons de cada investigador.
34Agenda • El alcance y cobertura de Essential Science Indicators (ESI)
Curso C3
• Entender las métricas de desempeño
• ¿Qué es un Highly Cited Paper?
• ¿Qué es un Hot Paper?
• ¿Qué es un Research Front?
• ¿Qué significa ser un Highly Cited Researcher?
• Los informes globales de ISIAbout the Global Research Reports from ISI
A reminder
• A new publication series to discuss and demonstrate the application of data about
the research process to management issues in research assessment, research
policy and the development of the global research base
• As the ‘university’ of the Web of Science Group, ISI maintains the knowledge
corpus upon which Web of Science and related information and analytical content,
products and services are built; it disseminates that knowledge internally through
reports and recommendations and externally through events, conferences and
papers; and it carries out research to sustain, extend and improve the knowledge
base
• They demonstrate the quality of our unique data and our ability to analyze and
interpret our data
36Global Research
Reports 2019
A new publication
series to discuss and
demonstrate the
application of data
about the research
process to
management issues in
research assessment,
research policy and the
development of the
global research base.
https://clarivate.com/webofsciencegroup/solutions/isi-reports/
37Global Research Reports 2019
Beyond single-point metrics
In this report, we draw attention to the information that is
lost when data about researchers and their institutions are
squeezed into a simplified metric or league table.
We look at four familiar types of analysis that can obscure
real research performance when misused and we describe
four alternative visualizations that unpack the richer
information that lies beneath each headline indicator and
that support sound, responsible research management.
38Global Research Reports 2019
Implications for the scholarly publishing landscape
This report, the second in the Global Research series from
the Institute for Scientific Information, examines recent
patterns of publications funded by Plan S supporters,
exploring potential impacts on funders, subjects, countries,
publishers, and journals.
Based on journal data taken from Web of Science Core
Collection, the report looks to provide an unbiased and data-
driven background analysis to inform the debate around a
potentially transformative change in research policy. ‘The
Plan S Footprint’ raises several questions for consideration by
funders, publishers and institutions when exploring possible
ways to implement Plan S.
39Global Research Reports 2019
The Web of Science indexes a growing number of research
articles with 1,000 or more unique authors or author
addresses across more than 100 different countries. The
combination of many authors/many countries creates a
complex authorship pattern that differs from more typical
academic papers and drives elevated citation rates.
Multi-authorship and research analytics examines the effects
of complex and hyper-authorship by author, country, and
discipline.
The report explores two patterns linking complex authorship
with effects that increase citation rates: a general increase
associated with multi-authorship (more than 10 authors and
more than five countries); and more perturbing outcomes of
hyper-authorship (more than 100 authors spread across more
than 30 countries).
40Muchas gracias
WoSG.support@clarivate.com
Nuevo email para el soporte al usuario
© 2019 Clarivate Analytics. All rights reserved. Republication or redistribution of Clarivate Analytics content, including by framing or similar means, is prohibited without the prior
written consent of Clarivate Analytics. Web of Science Group and its logo, as well as all other trademarks used herein are trademarks of their respective owners and used under license.You can also read