Methodology for calculating Lives Improved - Philips
←
→
Page content transcription
If your browser does not render page correctly, please read the page content below
Methodology for calculating
Lives Improved
At Philips, we strive to make the world
healthier and more sustainable through                    2018

innovation. Our goal is to improve the lives
of 3 billion people a year by 2025.

To guide our efforts and measure our
progress, we take a two-dimensional
approach – social and ecological – to
improving people’s lives.

2018

Figure 1: Lives improved dimensions

Solutions from our portfolio that directly support the
curative (‘care’) or preventive (‘well-being’) side of    1) Double-counts between various Philips Green-, Care- and Well-being
people’s health determine the contribution to the         solutions that touch the same person are eliminated .
social dimension. This is also our contribution to the
UN Sustainable Development Goal 3 (“to ensure
healthy lives and promote well-being for all at all
                                                           Methodology
ages”). As healthy ecosystems are also needed for          To calculate how many lives we are improving, market
people to live a healthy life, the contribution to the     intelligence and statistical data on the number of
ecological dimension is determined by means of our         people touched by the products contributing to the
steadily growing Green solutions portfolio, such as our    social or ecological dimension over the lifetime of a
energy efficient products in Personal Health. This is
                                                           product are multiplied by the number of those
our contribution to Sustainable Development Goal 12
                                                           products delivered in a year. After elimination of
(“to ensure sustainable consumption and production
                                                           double counts – multiple different product touches
patterns”).
                                                           per individual are only counted once – the number of
We started the development of this methodology for         lives improved by our innovative solutions is
calculating the number of lives improved with our          calculated. It is assumed that product contacts are
contribution to the ‘Care’ side in the social dimension    statistically uncorrelated, i.e. using a Philips Senseo
in 2010. With the renewal of our company vision in         does not significantly influence the likelihood also
2012, we have extended that approach with our ‘Well-       using a Philips Sleep & Respiratory device.
being solutions’ and our ‘Green solutions’.
                                                           Through Philips products and solutions that support
This document describes the methodology and                people’s health and well-being (i.e. excluding brand
metrics used to calculate the number of lives              licensee Signify) we improved the lives of 1.43 billion
improved by Philips, as well as the different data          people in 2018 (2017: 1.37 billion), driven by Diagnosis
sources used. The ‘Lives Improved‘ metric is part of       & Treatment businesses (+9%) and Personal Health
the assurance assignment of EY. EY’s assurance report      businesses (+5%). Our Green Products and Solutions
can be found here: chapter 11.3.5 of the Annual Report     (excluding Signify) that support a healthy ecosystem
2018.                                                      contributed 995 million lives. After the elimination of
                                                           double counts – people touched multiple times – we
                                                           arrived at 1.54 billion lives. This is an increase of
                                                           around 45 million compared to 2017, driven by all
                                                           segments, mainly in China, the ASEAN countries, the
                                                           Middle East & Turkey, and Central & Eastern Europe.
                                                           Including Signify, we improved the lives of 2.24 billion
                                                           people in 2018.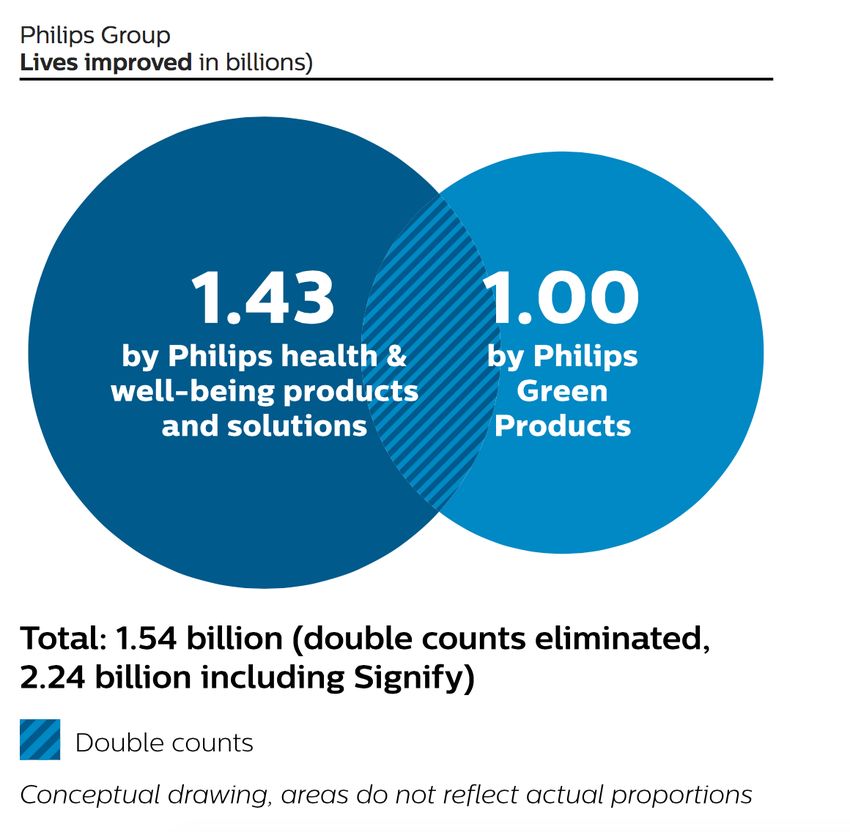
equipment). As a result, for example, 1,000
                                                            procedures using our CT equipment touch only 326
                                                            individual lives, and the adjustment factor is
                                                            326/1000. This detailed calculation is performed for
                                                            all modalities.
                                                            For fetal monitoring, only the mother is included in
                                                            the calculations, not the baby. To arrive at the total
                                                            lives improved for the ‘Care’ category, the installed
                                                            base is multiplied by the number of patients per day,
                                                            the average occupancy rate (days/year), and the
                                                            adjustment factor. For Patient Monitoring, the result is
                                                            divided by the average length of stay (ALOS) to arrive
                                                            at the total number of lives touched by our monitoring
                                                            systems. An estimated return-rate is included to avoid
                                                            any potential double-counts from returning patients.
                                                            The results of these calculations are verified by
                                                            marketing intelligence officers, product marketeers
                                                            and clinical scientists in the different businesses.

                                                            Metrics and data sources for the
In line with the discontinued operations presentation
in the Group financial statements regarding the
                                                            ‘Care’ category
Lumileds and Automotive business, we have excluded          The metrics and data sources we are tracking to
this data from the consolidated Sustainability data if      complete the Lives Improved calculations are:
relevant.
                                                            • Installed base – calculated based on data from
Our baseline of 1.7 billion people a year, established in     financial systems and market share information.
2012, has been adjusted to 1.6 billion to reflect the          From our financial systems, only equipment that is
impact of the exclusion of the Automotive and                 known to be operational is included. This is
Lumileds businesses.                                          equipment connected to our Remote Service
                                                              Network, or for which there has been service activity
‘Care’ solutions                                              in the past year.
                                                            • Adjustment factors – methodology explained
The starting point is the installed base of Philips           above. To eliminate double counts within Imaging
Healthcare equipment from the following three                 Systems and between Imaging Systems and Patient
businesses:                                                   Monitoring, a model has been set up that calculates
                                                              the number of individuals that are affected by a
                                                              number of imaging procedures (see above), based
                                                              on the professional judgment of healthcare
                                                              specialists. It is assumed that only ‘lives improved’
                                                              of in-patients need to be corrected for double
                                                              counts, as out- patients are assumed not to be
                                                              treated by Patient Monitoring. To eliminate double
                                                              counts, it is assumed that in-patients are always
                                                              touched by Patient Monitoring equipment, whether
                                                              at admission or during their stay. Philips’ global
                                                              market share is then used to eliminate the double
                                                              counts. Lastly, an estimate is made per clinical area
                                                              of how many scans or touch-points are part of a
                                                              typical treatment in this area. This is then used to
                                                              further eliminate double counts within a modality.
                                                            • In-patient (hospitalized) versus out-patient
Next, an adjustment factor is determined per modality         treatments – based on expert opinion and on data
in Imaging Systems. For example, Computed                     from i_Supply for Magnetic Resonance.
Tomography (CT) usage is first broken down into the
                                                            • For some parameters (e.g. distribution over clinical
following clinical segments: Oncology, Orthopedics,           segments) the professional judgment of healthcare
Vascular and Cardiac care. For each clinical segment,         specialists is used.
the number of touch-points per patient is determined
to obtain a typical treatment in that segment.              • Patients per day – data from Espicom and
                                                              Netforum is used.
Furthermore, a distinction is made between
‘inpatients’ (hospitalized) and ‘out-patients’ (not         • Occupancy rate – data from Worldwide Medical
hospitalized) to eliminate overlap between Imaging            Market Factbook 2015 is used.
Systems and Patient Monitoring (assuming that in-           • Average length of stay - ALOS in a hospital plays a
patients are always touched by Patient Monitoring             role in some parts of the Lives Improved model. The
data used is based on Worldwide Medical Market            ‘Green’ solutions
  Factbook 2015. A global weighted average is
  calculated based on Worldwide Medical Market              The methodology used to calculate lives improved for
  Factbook 2015 data and number of hospital                 ‘Well-being’ products is also used for Green Products.
  admissions per country.                                   Green Products are developed and produced by all
                                                            businesses in the sectors Healthcare, Lighting and
Well-being’ solutions                                       Consumer Lifestyle. Green Products are developed
                                                            with reference to the Philips Green Focal Areas:
In the table below some example well being solutions        Energy efficiency, Packaging, Hazardous substances,
categories are given:                                       Weight, Recycling and disposal, and Lifetime
                                                            reliability.

                                                            Green solutions criteria
                                                            Green solutions need to prove leadership in at least
                                                            one Green Focal Area compared to the industry
                                                            standard, which is defined by a sector-specific peer
                                                            group. This is done either by outperforming reference
                                                            products (which can be a competitor or predecessor
                                                            product in the particular product family) by at least
                                                            10%, outperforming product-specific eco-
                                                            requirements, or by being awarded a recognized eco-
                                                            performance label.
                                                            Because of their different product portfolios, sectors
                                                            have specified additional criteria for Green solutions,
                                                            including product specific minimum requirements
                                                            where relevant.

 The starting point here is the sales in units of           Products from acquisitions are only included as of the
designated well-being products. These are all               year after the acquisition and subject to the
consumer products and services that enable people           acquisition agenda. Professional Lighting Solutions is
to live healthier lives by providing them with the tools    an exception to this rule as it was not possible to
to make healthier choices:                                  exclude the products sold from this business.

• to prepare food
                                                            Metrics and data sources (for the ‘Well-
• to care for their physical and mental health
• to create a healthy home environment                      being’ and ‘Green’ solutions)
Products are only included during the estimated             The metrics and data sources we are tracking to
lifetime of that product. So, a product sold in 2015,       complete the Lives Improved calculations are:
with a lifetime of three years, will be included in 2015,   • Sales in quantities from financial systems (to
2016 and 2017. Next, the Lives Improved per product           provide more insightful information we changed the
are calculated using an estimate of lives touched per         sales data from “country of sales” to “country of
product. For example, an electric toothbrush only             designation” resulting in changes in reported data
enables the improvement of one life, whereas a                per market)
HomeCooker enables improvement of the lives of an
                                                            • Public sources, where available, to determine, for
average family size. Next, in order to avoid double
                                                              example, number of people in a market and Gross
counts (a person owning a Sonicare toothbrush could
                                                              Domestic Product (e.g. CIA world fact book, IMF,
also own a HomeCooker, but should only be counted
                                                              OECD reports, The World Bank)
once), a statistical elimination is performed (refer to
the Appendix). First, the statistical elimination is        • Product lifetime and lives improved per product
performed within the ‘Well-being’ and ‘Green’                 estimates from Philips Innovation & Development
categories, and then also across the three categories         and marketing intelligence specialists
that contribute to ‘Lives Improved’ by Philips.             • Market share information from Philips marketing
Products from acquisitions are only included as of the        intelligence specialists
year after the acquisition and subject to the               • Statistical elimination of cross-product category
acquisition agenda.                                           double counts based on Set Theory (refer to the
                                                              Appendix)
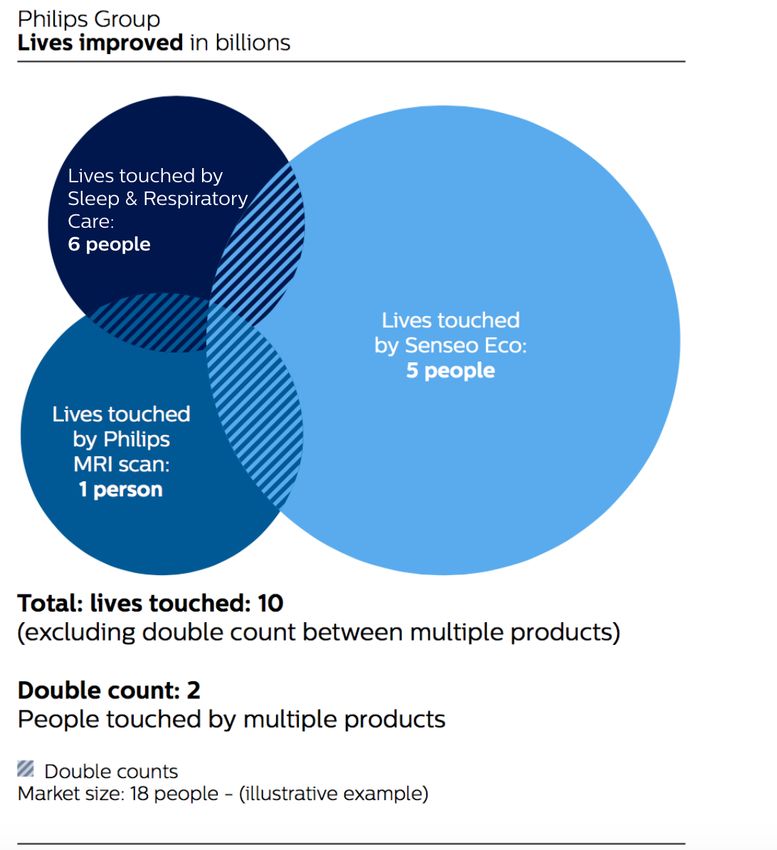
Scope                                                     Appendix
Solutions that are out of scope are:                      In the Lives Improved model, product categories can
Care solutions                                            be represented by a number of ‘bubbles’ that cover
• IntelliVue telemetry devices and HeartStart (AED)       the population in a given market. In the graphic
  devices & PPACS systems and central processing          representation to the left we have assumed a market
  servers                                                 size of 18 people, of whom six have a Philips Sleep &
Well-being solutions                                      Respiratory (SRC) device, five have a Philips Senseo
• All solutions that do not fulfill the ‘Well-being’       Viva Café Eco, and one person has had an MRI scan
  criteria                                                in a Philips MRI machine.

Green solutions
• All Philips solutions that do not fulfill the ‘Green’
  criteria

Next steps
We used opinions from Philips experts and estimates
for some parts of the Lives Improved calculations.
There is therefore an inherent uncertainty in our
calculations. The figures reported are Philips’ best
possible estimate. The Lives Improved model will be
used in the Philips organization to manage our
progress towards the target of 3 billion lives improved
in 2025. Therefore, we expect further refinements over
the coming period. As we gain new insights, we may
enhance the methodology in the future.

                                                          As the figure illustrates, there is a chance that not all
                                                          lives touched by Philips products are unique lives;
                                                          one person can have a Philips Patient Monitor and a
                                                          Philips Senseo Viva Café Eco. Therefore the total Lives
                                                          Improved in the example above is given by the union
                                                          of the three bubbles, or:

                                                          Lives Improved
                                                          = SRC ∪ Senseo ∪ MRI
                                                          = Total market - (SRC ∪ Senseo ∪ MRI)C

                                                          By assuming the product overlaps are statistically
                                                          uncorrelated, i.e. using a Philips Senseo Viva Café Eco
                                                          does not significantly influence the likelihood of also
                                                          using Philips wellbeing SRC, we can use the following:

                                                          (A ∪ B )C = AC ∩ BC (De Morgan’s laws) and, P(A ∩ B )=
                                                          P(A) * P(B) (Probability theory)

                                                          This gives us:
                                                          Lives Improved
                                                          = Total market * [1-(P(SRCC ) * P(SenseoC ) *
                                                          P(MRIC ))] = Total market * [1-([1-P(SRC)] * [1-
                                                          P(Senseo)] * [1- P(MRI)])]
                                                          = 18 * [1-([1-6⁄18] * [1-5⁄18] * [1-1⁄18])]
                                                          = 18 * [1-(0.667 * 0,722 * 0,944)]
                                                          = 18 * [1-0.455]
                                                          = 9.81
You can also read