Targeted Training Activity (TTA) 2017- Monsoons in a Changing Climate - Indico
←
→
Page content transcription
If your browser does not render page correctly, please read the page content below
Targeted Training Activity (TTA) 2017-
Monsoons in a Changing Climate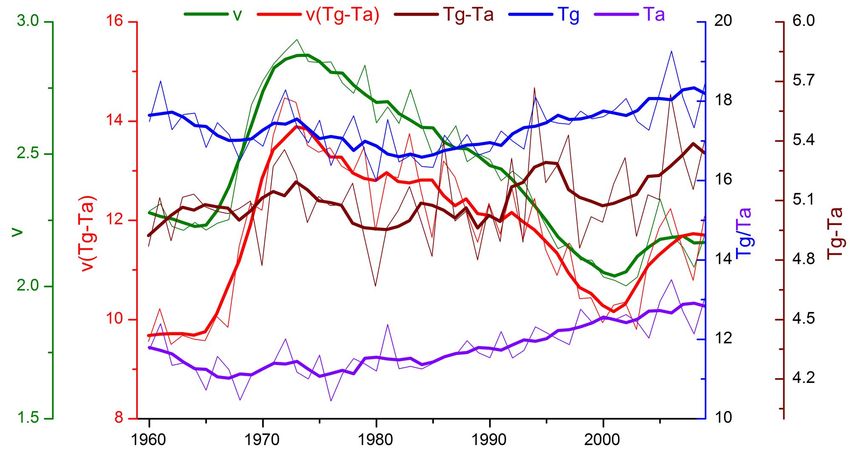
Outline

1   Variability of the ASM

    Dynamics of ASM onset
2   亚洲夏季风爆发动力学
    Evolution of the ASM onset
3   亚洲夏季风爆发过程

    ENSO and ASM Onset
4   ENSO和亚洲夏季风爆发

5   Summary 结论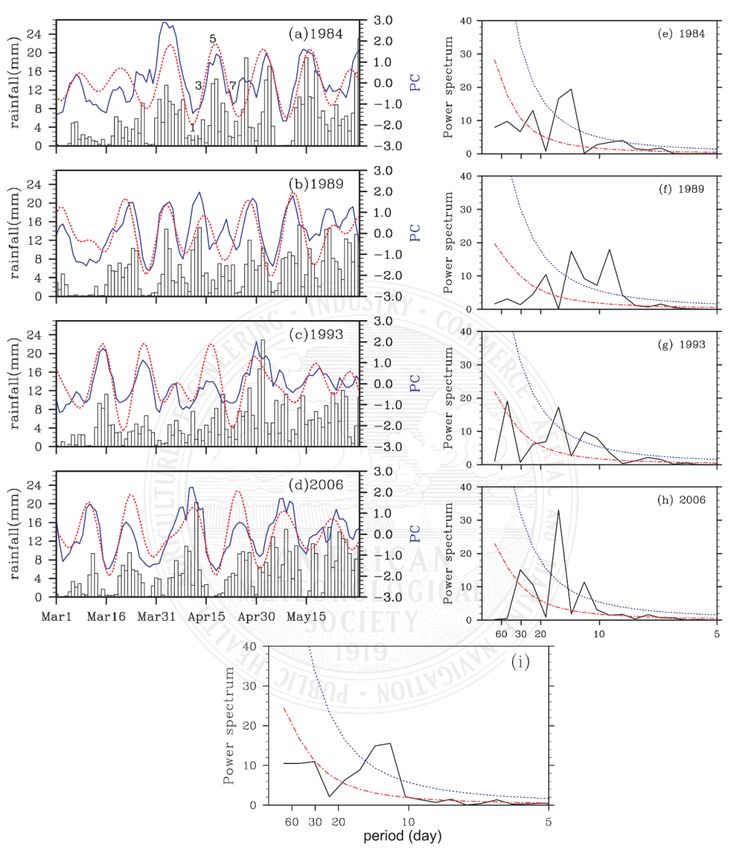
110°-130°E averaged precipitation
                      SCSR

                                   LinHo等(2008)
降水年际变率大,致使旱涝灾害频繁
春季连阴雨天气是华南地区常见的一种灾害性天气
季节内振荡是全球大气多时间尺度振荡现象的重要组成部分,是联系天气与气候的直接纽带,对阶
段性、持续性极端事件的发生具有重要影响

p 理解季节内振荡如何影响华南春季气候
p 提高华南春季延伸期以及月季降水趋势预测能力                           3
(a)                                   (b)

Figure 1. (a) Spatial distribution of the climatological spring (March–May)
precipitation (mm) over Southern China for the period 1980–2008. (b) Spatial
pattern of the first EOF mode (EOF1) for daily spring precipitation anomalies
                                                                            4
over Southern China.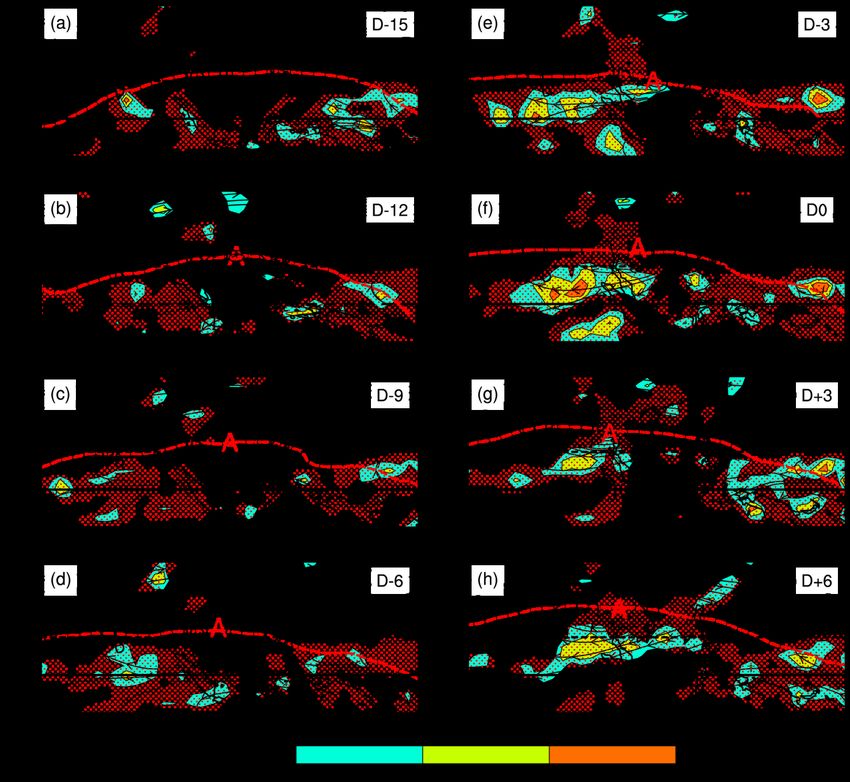
FIG. 2. Time series of daily rainfall (histogram; mm day21) averaged over southern China (18–32N, 105o–120oE), the
corresponding unfiltered PC1 (blue solid curve), and the 10–20-day filtered PC1 (red dotted curve) for the typical years of
(a) 1984, (b) 1989, (c) 1993, and (d) 2006. (e)–(h) The corresponding power spectrum of the unfiltered PC1 (black curve),
together with the Markov red noise spectrum (red dot-dashed curve) and a posterior 95% confidence level (blue dotted curve)
for the selected years and (i) the 29-yr average from 1980 to 2008. The numbers 1, 3, 5, and 7 in (a) indicate the phase of the
Phase definition for the ISO/SCSR

                                                 Wet phase

位相合成分析方法                                 5
                                    4        6
Lanczos滤波提取10–20天周期分量
作为降水ISO 指数                      3                7
                            2                        8
Ø 挑选标准 强ISO个例。          1                                9
Ø 10-20天周期:46个                          Dry
Ø 20-30天周期:38个                          phase
                        ISO振荡位相示意图

                                                             6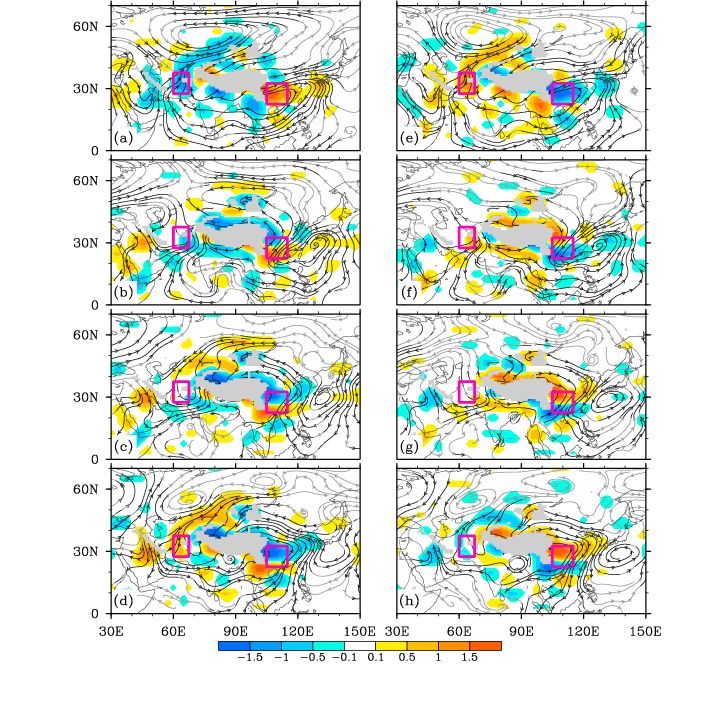
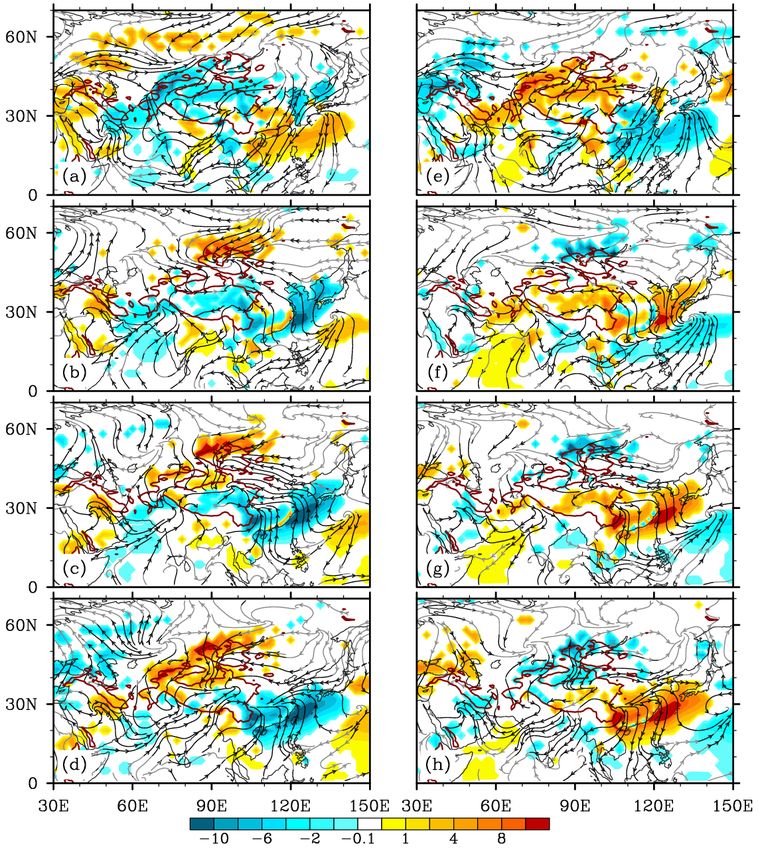
850hPa- divergence and streamfield

                                   Dry                                                                                                 Wet
                                                                             A                                     C
                              Phase 1                                                                                                Phase 5

                                                                         C                                    A
                                                                                 A                                     C
                              Phase 2                                                                                              Phase 6

                                                                          C                                    A
                                                                                     A                                     C

                               Phase 3                                                                                             Phase 7

                                                                          C          A                         A               C

                              Phase 4                                                                                               Phase 8
Figure 3. Composite evolution of the 10–20-day filtered 850 hPa streamline (dark streamline indicates where at least one wind component is
statistically significant at the 95% confidence level) and divergence (shading, unit is 10–6 s–1; only shown if statistically significant at the 95%
confidence level) during an ISO cycle. Phases 1–8 are shown from (a) to (h). The Tibetan Plateau with terrain above 1500 m is shaded grey.
Western rectangle area (60°–67.5°E, 27.5°–37.5°N) to the west of the TP and eastern rectangle area (105°–115°E, 22.5°–32.5°N) to the east of the
TP indicate the locations of the two divergence poles of the Spring Dipole Mode Index (SDMI). “A” and “C” denote, respectively, the anticyclone   7
and cyclone centers, and arrows denote the propagation routes of the anticyclone and cyclone.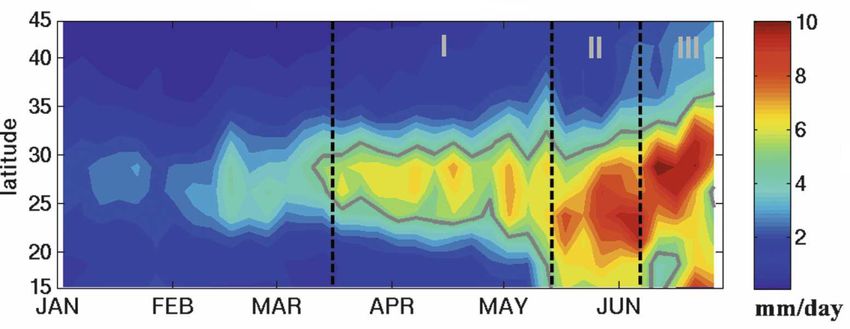
10-m streamfield and surface sensible heat flux

                Dry                                                                  Wet

Figure 4. Same as Fig. 3, but for the 10–20-day filtered 10 m wind (vectors, m s–1,) and surface
sensible heating flux (W m–2, with shading denoting statistical significance at the 95% confidence
                                                                                              8
level). The Tibetan Plateau with terrain above 1500 m is outlined by a solid curve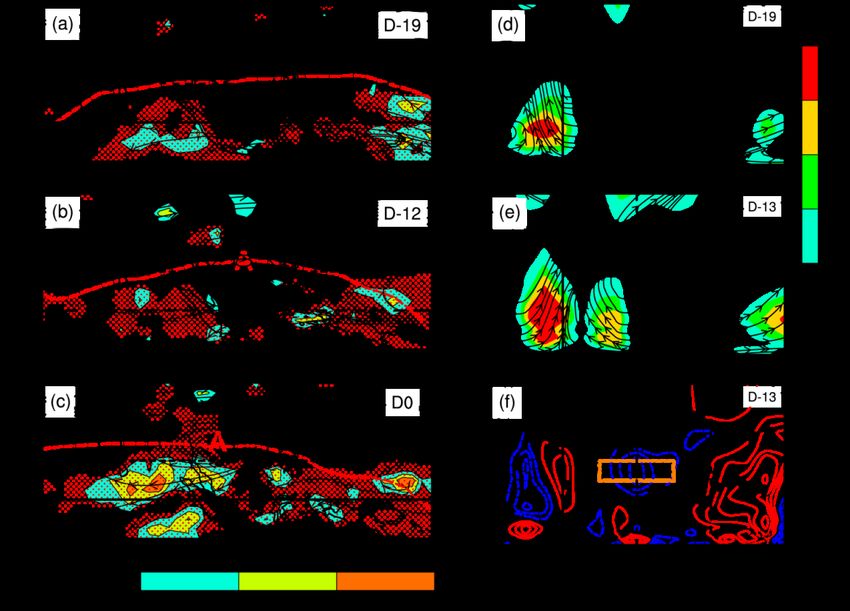
ISV: TP heating and the three – stage ASM onset

                                Ind. onset
                    SCS onset
                                                 A
                                                                        B
        BOB onset                                                   D
                                                                        F   E

                                                                                     A
                                                                    C

                                                 A             BF                E
                                             A

    E

D                                            B

C

                                                     (Wu and Zhang, MWR, 1998)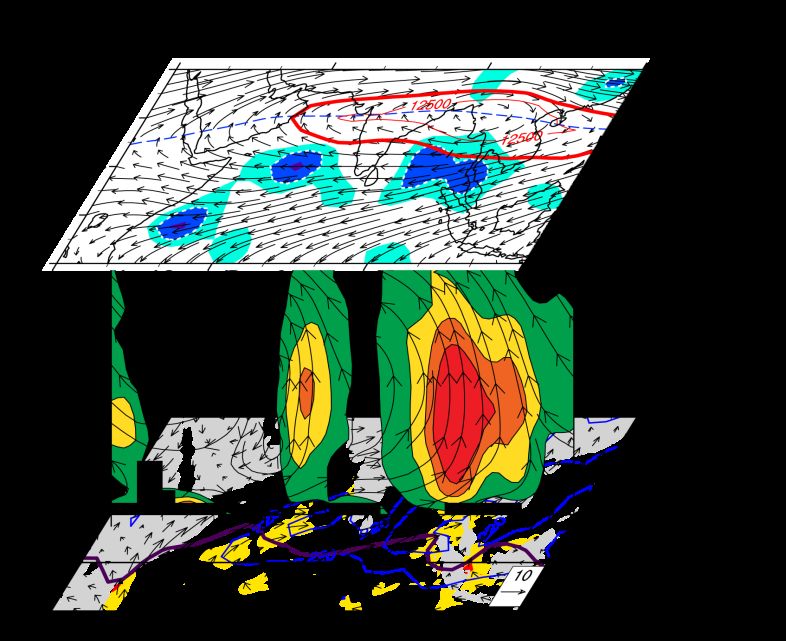
夏季高原天气影响:南亚高压准双周振荡
      W- mode                  E- mode

     More                           More
     Rain                           Rain

陶诗言和朱福康, 1964

加热弱:南亚高压稳定;加热强:不稳定
Due to PV asymmetric instability   Liu等, 2007
ISV: TP summer heating and SAH oscillation
夏季青藏高原强加热能够产生准双周振荡
高PV
A 纬向风u=0
低PV 南亚高压
(Liu, Hoskins, Blackman, 2007 JMSJ)W-E seesaw a
b
Fig. 10 Decadal changes in JJA mean
climate between the periods (1991–2000)
and (1981–1990) of (a) precipitation
based on the PREC/L dataset (unit:
mmd-1), (b) 200-hPa geopotential height c
(unit: gpm) and (c) the 200–400hPa
mass-weighted temperature (unit: K)
based on ERA40 reanalysis. The solid
and dashed curves in (b) and (c) denote,
respectively, the 1981–1990 and 1991–
2000 means.β v ≈ ( f + ζ )θ z−1( ∂Q / ∂z ) θ z ≠ 0 ·∇z→0 z=-
⎧ ∂ 2T ∂ ∂ 2Q H·lnp,
⎪ 2 ≈γ ( 2)
⎪⎪ ∂ x ∂x ∂z
⎨
⎪γ = f ( f + ζ )H /( Rβθ ), θ ≠ 0
z z
⎪
⎪⎩
Longitude location of the SAH and UTTM
! πz
# Q = Q(x) cos( )
# HQ
#
# πz
"T = T (x) cos( )
# HQ
#
#T (x) = T0 cos( π x )
#
$ L
!
⎧⎪T (x ) ≈ γL2 H Q−2 ∂Q( x ) / ∂x = λ∂Q( x ) / ∂x , V ⋅ ∇ζ → 0;
⎨
⎪⎩λ = γL2 H Q− 2
Wu et al, Climate Dynamics, 2015∂v R ⎛ ∂T ⎞
=− ⎜ ⎟
∂ ln p f ⎝ ∂x ⎠
Fig. 5 Schematic diagram of the T-QZ mechanism contributing to the longitudinal location of the upper-troposphere
temperature maximum (UTTM): Strong monsoon convective latent heating along the subtropics (blue upward arrow)
results in the local development of a vertical northerly shear (black arrow), and induces an eastward decreasing
Longitude location of the SAH and UTTM
temperature gradient over the heated layer in the upper troposphere, forming the UTTM and the aloft SAH to the west of
the heating. The vertical southerly shear over the western Eurasian subtropics, which is due to strong surface sensible
heating and longwave radiation cooling (red downward arrow) in the upper troposphere, contributes to the occurrence of
the UTTM and SAH on the eastern end of the cooling. The induced Coriolis force (fv, orange arrow) is in geostrophic
balance with the pressure gradient force. Refer to text for details.2. 1979-1989年7月平均200-400hPa高度上的非 加 分布(阴影,Kd-1),以及温度 向平均的偏差
(a)及 (180-360o)平均的偏差(b)的分布( ,K)。粗 副高 (Wu et al., 2015)
The UTTM location is determined by large-
scale dynamics rather than local convection!SEN-CON
a
W-E seesaw
+3K
b
28o-32oN zonal mean T anomaly
c
Fig. 6 Distributions of the JJA mean of (a) differences between the forcing experiment SEN and control experiment CON of
rainfall (shading, unit: mm day-1) and winds at 200 hPa (arrow); (b) 200–400 hPa mass-weighted temperature in the SEN run
(dashed) and CON run (solid); and the differences between SEN and CON of (c) 28o–32oN zonal mean circulation
(streamlines, vertical motion has been amplified by a factor of 500) and temperature (shading, unit: K); The box in (a)16and (b)
indicates where the extra convective heating with a maximum of 3 K day-1 at 500 hPa is imposed in the SEN experiment.W-E seesaw a
b
Fig. 7 Distributions in the PER
experiment of wavelet power (a, c) and
significance (b, d) for the 200-hPa
geopotential height in the forcing c
source region S (90o–120oE, 28o–
32oN) (a, b) and in the response region
R (70o–90oE, 28o–32oN) (c, d);
abscissa is for integration day and
coordinate is for period (unit: day).
dFig. 8 Evolutions in the PER experiment of the normalized 200–500hPa mass-weighted mean heating in the forcing source region S (black solid), and the geopotential height at 200 hPa (green dashed-dotted), the 200–400 hPa mass-weighted temperature (red dashed), and pressure vertical motion at 300 hPa (blue dotted) in the response region R (a); and the corresponding time-lag correlations between the forcing in region S and those in the response region R (b). A 20-day running mean has been used on the original data to filter out high-frequency noise.
a

Fig. 10 Decadal changes in JJA mean
climate between the periods (1991–2000)
and (1981–1990) of (a) precipitation
based on the PREC/L dataset (unit:
mmd-1), (b) 200-hPa geopotential height
(unit: gpm) and (c) the 200–400hPa
                                           b
mass-weighted temperature (unit: K)
based on ERA40 reanalysis. The solid
and dashed curves in (b) and (c) denote,
respectively, the 1981–1990 and 1991–
2000 means.

                                           c
Fig. 11 Evolution from 1984 to 2000 of the JJA mean based on the ERA40 reanalysis of (a) surface sensible heat flux on the Tibetan Plateau region (80o–100oE, 26o– 36oN unit: Wm-2), (b) precipitation in the forcing source region S* (Pr_east: 90 o –120 o E, 24 o –28 o N, u n i t : m m d-1) , ( c ) 2 0 0 h P a geopotential height in the response region R1 (hgt_200: 70o–90oE, 24o– 28oN unit: dgpm), (d) 200–400 hPa mass-weighted temperature in R1 ( U p _ T, u n i t : K ) , 2 0 0 h P a meridional wind (e) in the response region R2 (v_200 West: 50o–80oE, 24o–28oN) and (f) in S* (v_200 East, unit: ms-1), and 700 hPa meridional wind (g) in R2 (v_700 West) and (h) in S* (v_700 East, unit: ms-1).
(1) A weakening trend in the TP forcing in spring and summer
from station data                                              1975-2009

                                                74 sta-ons

   Mean over the TP,       JJA                      ΔSH ΔV Δ(Tg −T a) ΔV
                                                        =   +         ≈
   Liu et al. Cli. Dyn 2012                          SH   V   Tg −T a   V
N-S seesaw
Correlation of SH averaged over TP
and Pre_Land, 11-year running mean
SH=(Tg-Ta)V
Correlation: weaker TP heating corresponds to more rain
(green) in Southern China and less rain (brown) in
Northern China
Fig. 7N-S seesaw
Response
Less rain in north
More rain in South
Fig. 5中国未来极端降水事件?
50年代
50’s 60年代
60’s 70年代
70’s 80年代
80’s 90年代
90’s 2000-
2000-06
2006年
?
最高频次 最高频次 最高频次 最高频次 最高频次 最高频次
90% 80% 60% 60% 70% 80%
Inter-decadal variation of summertime rainfall anomaly over E China
From Dong et al. 2009虚线:原始数据 实线:5点滑
20 动平均后
18
16
14
12
10
1960 1970 1980 1990 2000 2009
绿色: Tg 蓝色: Ta 红色: (Tg-Ta)V50年代 60年代 70年代 80年代 90年代 2000-
STAGE1: STAGE2: 2006年 STAGE3:
1967-1972 1973-2003 2004-2011
?
最高频次 最高频次 最高频次 最高频次 最高频次 最高频次
90% 80% 60% 60% 70% 80%
PSH=V(Tg-Ta)Summary- III
Weakening of sensible heating over the TP results
in weakening of near-surface cyclonic circulation.
Consequently, the convergence of water vapor
transport is confined to South China, contributes
to “wet in south and dry in north.”
Liu et al., Cli Dyn 2012Outline
1 Variability of the ASM
Dynamics of ASM onset
2 亚洲夏季风爆发动力学
Evolution of the ASM onset
3 亚洲夏季风爆发过程
ENSO and ASM Onset
4 ENSO和亚洲夏季风爆发
5 Summary 结论36
33
31
36
33 28
31 25
36 25
36
31 28
33 33
28 25
36
31 28
2 28
1
3 31
25
28
33
25
36
Fig. 4 Climate-mean Pentad-isochrones indicating the evolution of the Asian summer
monsoon onset, Unit: pentad
Wu and Zhang, MWR, 1998Upper-lower troposphere coupling
Upper
troposphereFig. 8 Streamline and divergent field (shaded, units: 10-6 s-1) at 150hPa, and the diabatic heating averaged from 500hPa to 200hPa (red stipple denotes greater than 1.5K day-1) during the BOB summer monsoon onset period on (a): D-19, (b): D-12, c: (D0); the Pressure–latitude cross section (averaged over 120°–130°E) of Q1 (shading, units: K day–1) and meridional circulation on (d) D–19 and (e) D–13; and (f) vorticity source S on D–13 (interval is 0.5 × 10⁻¹¹ s–2, values greater than –0.5 are stippled). “A” and the red dash line in (a) to (c) denote, respectively the anticyclone center and the ridgeline. The orange boxes in (f) denotes the area of maximum S over Philippines. (reproduced from Liu et al., 2012)
Schematic diagram presenting the mechanism responsible for the SAH (marked by “A”)
formation: persistent convective diabatic heating in spring over the south Philippines produces a
sustained negative vorticity source over the Philippines, and the South Asian High is generated as
a Gill-type atmospheric response to the negative forcing source. The marked area over the
equatorial west Pacific denotes the diabatic heating which is isolated from the one over the south
Philippines.
Fig. 1 Daily evolution of 150hPa streamline and divergent field (shaded, units: 10-6 s-1) , and the diabatic
heating averaged from 500hPa to 200hPa (red stipple denotes greater than 1.5K day-1) during the BOB
summer monsoon onset period (a: D-15, b: D-12, c: D-9, d: D-6, e: D-3, f: D0, g: D+3, h: D+6). “A” denotes
the anticyclone center, the ridgeline is plotted by the red dash line.
Upper-lower troposphere coupling

 Lower troposphere
  ØBOB monsoon onset
  ØIndian monsoon onset
Barotropic
                    (a)

                                                                                                                                            Instability

                    (b)

                    (c)

                                 Lower troposphere flow       Surface wind              Water vapor flux           Surface ocean current
                     COLD
                                                              Sea surface temperature     -Onset vertex    - cyclone
                                 Surface sensible heat flux                                                                 - anticyclone

Fig. 7 Schematic diagram showing the formation of the BOB monsoon onset vortex as a consequence of in situ air–sea interaction modulated by
               the land–sea thermal contrast in South Asia and Tibetan Plateau forcing in spring. (adopted from Wu et al., 2012a)

  7 春季在青藏高原               迫和南 海             力      比共同作用下(a) ,孟加拉湾暖池形成(b)和季                                爆           旋激     (c)的示意          ,    正文。引自
                                                            Wu等(2012a)
Outline
1 Introduction 引言
Dynamics of ASM onset
2 亚洲夏季风爆发动力学
Evolution of the ASM onset
3 亚洲夏季风爆发过程
ENSO and ASM Onset
4 ENSO和亚洲夏季风爆发
5 Summary 结论360K 355K 330K
a e i
5 P1
日 P2
b f j
6 P1 P2
日 P1 L
c g k
7 P2 L
日 P1 P1
d h l
8 P1 P1
日
8 6月在360K(a-d)、 355K(e-h)、和 330 K (i-l) 等 面上PV (阴影, 位:PVU)、
( 位:m/s)和200hPa高度 ( , 位:gpm)的水平分布。第1-4行依序分 5-
8日。垂直虚箭矢表示 流 高 旋系 P1, P2和 流 中 低 系 L的水平
移 方向;水平粉 色 虚 指示低 系 垂直向的 相斜 展。Without friction: k=0, but N-S pressure gradient not uniform
∂ ∂φ
( )≠0
∂x ∂y
D 2v 2
∂u g 2
∂u g
2
+λ v = f(u ), λ = f ( f − )
Dt ∂x ∂y
1 ∂u g ∂u g 1 ∂u g −2 ∂ ∂φ
v1 = ( +u )≈ ⋅u = −λ u ( )
∂u g ∂t ∂x ∂u g ∂x ∂x ∂y
f− f−
∂y ∂y
Dv
Mechanism = − fu + fug − Kv = f ( u g − u )
Dt
φ -1
ug = u ug > u u
φ +1图5印度夏季风爆发过程中925hPa 等压面上位势高度(单位:dgpm)的演变特征。 Evolution of geopotential height at 925hPa during the ISM onset (interval is 10 gpm)
*      2 ∂ ∂ϕ
                                             v ≈ −λ ⋅ u ( )
                                              1
                                                       ∂x ∂y

                                                   强迫作用

图6            925hPa    (m/s); ;   : 925hPa v1* (m/s);   :
d(v1*)/dy (10-6 s-1);    :           ;       :
Previous review II: Onset process of Indian summer monsoon
Upper-level: westward
extension of SAH and its
pattern variation
(background)
Indian summer BOB monsoon
monsoon onset
convection
1 ⎛⎜ ∂ ⎞⎟⎛⎜ ∂φ ⎞⎟
*
v ≈ − 2 ⎜u ⎟⎟⎜ ⎟⎟
1
λ ⎜⎝ ∂x ⎟⎠⎜⎝ ∂ y ⎟⎠
Lower-level: Inertial instability
and forced convection (trigger)
-Wu and Liu, 2014, Sci China Earth Sci
-Zhang et al., 2014, Sci China Earth SciOutline
1 Introduction 引言
Dynamics of ASM onset
2 亚洲夏季风爆发动力学
Evolution of the ASM onset
3 亚洲夏季风爆发过程
ENSO and ASM Onset
4 ENSO和亚洲夏季风爆发
5 Summary 结论ENSO: one of the major factors influencing the interannual variability of
SASM onset date
Possible impact processes of ENSO on ASM:
1. Anomalous Walker circulation and
Atmospheric bridge;
2. Philippian sea anticyclone anomaly;
3. SAH formation and variation;
4. Land surface situation in previous winter
and spring.
Scientific questions
l How does ENSO influence the interannual
variability of ASM onset dates via the
vertical coupling between upper- and
lower-level circulation?
Onset dates of (a) BOB and (b) Indian summer
monsoon; (c) lead-lag correlation of Niño3.4 SST with l Is the ENSO-impact process distinct
onset dates of BOB and Indian summer monsoon, among the different phase of ASM onset?
respectively
u Red bars: warm ENSO occurred previously
u Blue bars: cold ENSO occurred previouslyComposite analysis: Anomalous large-scale atmospheric
circulation in different phases of ENSO
Warm ENSO
SSTA(K)&sea surface wind(m s-1)
Warm ENSO
200-hPa velocity potential
(10-6 s-1)& divergent wind (m s-1)
Cold ENSO
SSTA(K)& Sea surface wind(m s-1)
Cold ENSO
200-hPa velocity potential (10-6 s-1)
& divergent wind(m s-1)
!
April: Zonal SSTA gradient May: Meridional SSTA gradient
in tropical Indo-Pacific Ocean in Arabian SeaReason for the Indian Ocean SSTA in May: local meridional asymmetric
distribution of thermocline
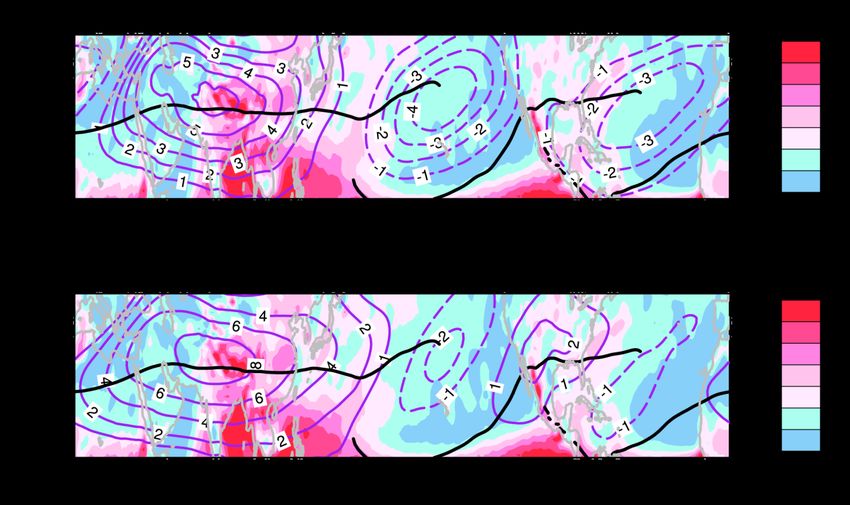
50o-70oE averaged depth-latitudinal crossing section of subsurface temperature anomalies (K); Purple
lines: climate-mean position of thermocline (D20)
!
Cold ENSO-Warm ENSOApril: ENSO influences on the upper- and lower-level circulation during the BOB
summer monsoon onset
200-hPa Streamline& 500-hPa Q1 925-hPa moisture transport
Cold ENSO-Warm ENSOApril: ENSO influences on the upper- and lower-level circulation during the BOB
summer monsoon onset
Lower-level: Barotropical instability Upper-level: SAH is to the north of its
is strengthened over southern BOB climate-mean position, enhancing the
following cold ENSO divergence-pumping over northern BOB
Zonal wind
anomalies OLR
Ø150-hPa
divergence;
ØSAH ridgelines;
∂2
[ M ] = − 2 [u]+ β Ø400-hPa ascent;
∂y Ø850-hPa relative
vorticity
Vertical coupling:
anomalous ascent is
Relative
vorticity in the upper Ascent&divergence
troposphere
! !
Cold ENSO-Warm ENSOMay: ENSO influences on the upper- and lower- level circulation during the Indian
summer monsoon onset
150-hPa streamline&500-hPa Q1 925-hPa moisture transport
!
Cold ENSO-Warm ENSOMay: ENSO impact on the lower-level inertial instability and forced convection
over Arabian Sea during Indian summer monsoon onset
Cross-equatorial SSTA gradient in Arabian Sea->
Meridional gradient of anomalous SLP
Forced convection development
Inertial instability
6
5
4
3
2
1
!
1 ⎛⎜ ∂ ⎞⎟⎛⎜ ∂φ ⎞⎟
v1* ≈ − 2⎜
u ⎟⎟⎜ ⎟⎟
λ ⎝ ∂x ⎟⎠⎜⎝ ∂ y ⎟⎠
⎜
Cold ENSO-Warm ENSOMay: ENSO effect on the vertical coupling between upper- and lower-level
atmospheric circulation of Indian summer monsoon onset
Upper: SAH is located to
Divergence the northwest of its
(shading) & climate-mean position,
omega (contour) leading to the stronger
divergence-pumping over
Arabian Sea.
Vertical coupling:
anomalous ascent settles Lower: Stronger inertial
in the lower troposphere instability and forced
convection development
results in the enhanced
lower-level convergence
over the southwestern
Indian Peninsula.
Cold ENSO-Warm ENSOOutline
1 Introduction 引言
Dynamics of ASM onset
2 亚洲夏季风爆发动力学
Evolution of the ASM onset
3 亚洲夏季风爆发过程
ENSO and ASM Onset
4 ENSO和亚洲夏季风爆发
5 Summary 结论Summary and discussion 1. ENSO can alter the onset dates of SASM via changing the vertical coupling between upper- and lower-level circulation over SASM region. 2. In the interannual timescale, the SAH response to ENSO in the upper troposphere is important for the anomalous SASM onset. 3. The change in the near equatorial E-W SSTA gradient in the Indo- Pacific Ocean is responsible for the anomalous BOB summer monsoon onset. 4. The change in the cross- equatorial (N-S) SSTA gradient in the western Arabian Sea can result in the changes of inertial instability and forced convection development in the lower troposphere , causing anomalous Indian summer monsoon onset.
1.通过改变热带印度-太平洋的海表温度梯度,ENSO显著
的影响着亚洲季风区大气环流高低空的耦合,从而影响着亚
洲季风的爆发;
2.冷/暖ENSO年高层南亚高压发展早/迟,对亚洲夏季风爆发
的年际变化有重要的影响;
3.冷/暖ENSO年印度洋-太平洋近赤道异常的东西向SST梯
度是导致孟加拉湾夏季风提前/推迟爆发的原因;
4.冷/暖ENSO年西阿拉伯海跨赤道异常的南北向SST梯度是
导致异常的惯性不稳定和强迫对流发展,从而引起印度夏季
风提前/推迟爆发的原因。
Thank You!
You can also read