Report on heat production during preliminary tests on the Rossi "Ni-H" reactor.
←
→
Page content transcription
If your browser does not render page correctly, please read the page content below
Report on heat production during preliminary tests on the
                             Rossi “Ni-H” reactor.

                                 Dr. Giuseppe Levi

In this first and preliminary document are reported the heat production measures done
during two short tests done on December 16 2010 [Test 1] and January 14 2011
[Test 2].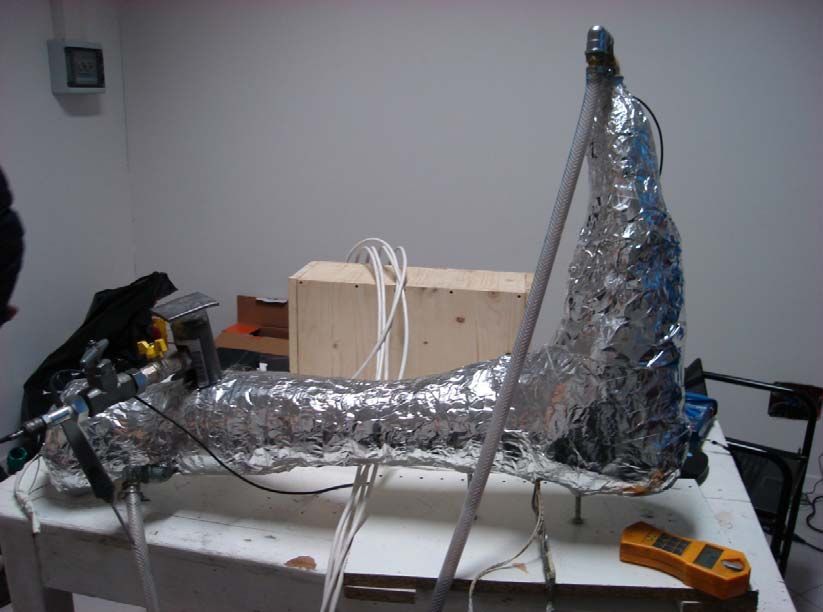
On December, 16 2010 I had the opportunity to test, for the first time, a prototype of
the Rossi “Ni-H” reactor. A photograph of the apparatus used in both tests is shown
in fig.1 and a scheme is shown in fig. 2.

                                         Fig.1

                                         Fig.2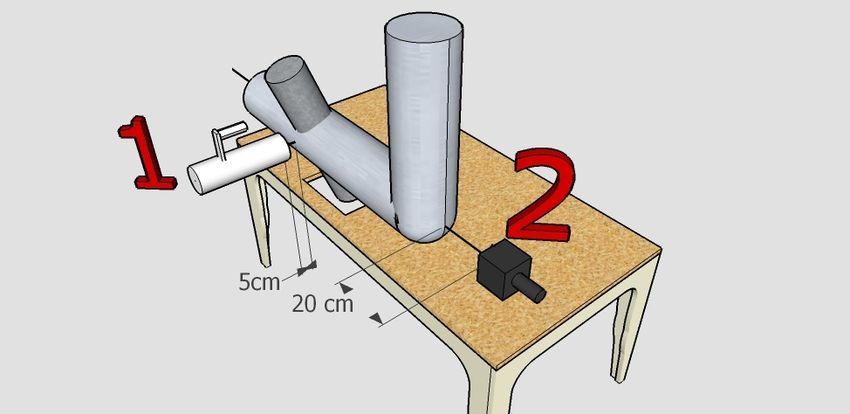
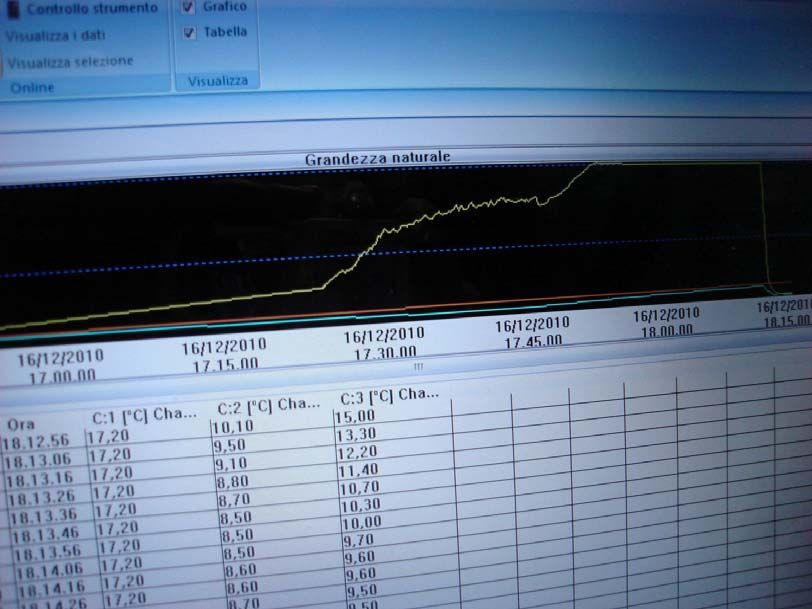
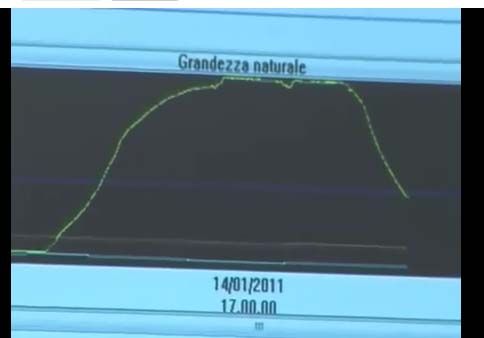
The Rossi Reactor prototype has a main horizontal cylindrical body ending with a
vertical pipe. The H2 inlet was connected to a Hydrogen bottle through no return
valves. There was no H2 outlet apart from a small purge valve that was closed.
Cables where connected to a control box with 5 digital plc that where “controlling the
power sent to the resistors inside the reactor”. Prudentially I have lifted the control
box in search for any other eventually hidden cable and found none. The weight of
the control box was of few Kg. Two water pipes where connected to the system.
Temperature was measured and logged by two NTC sensors. Another sensor, in the
logger, was measuring the ambient temperature. Power from the 220V line was
monitor and logged by a “WATTUP?” Pro Es power meter.

Before igniting the reactor the water flux was set and measured by collecting, , and
then weighting, an amount of water in a container in a given time.

The measured flux was of 168 +/- 2 g in 45 +/- 0.1 s.

Then the power was turned on an temperatures started to rise. In Fig 3 is show a plot
of the temperatures as appeared on the monitor during the test taken from the start to
just after the end of the test.
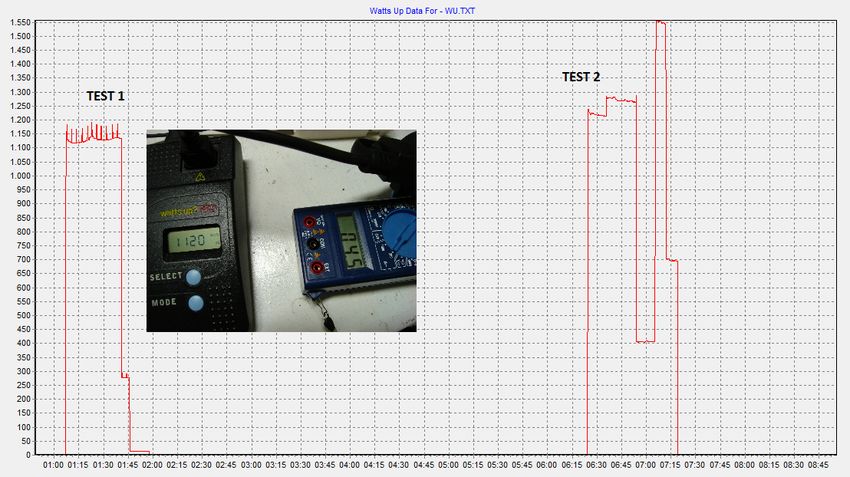
The three lines refers:

(B) blue line: T1 water input temperature

(Y) yellow line: T2 water (steam) output temperature

(R) red line : ambient temperature

As it can be seen the system was turned on just around 16.55. After approx 30
minutes a kink can be observed in the (Y). Because input power ( 1120W also
checked via and clamp amperometer ) was not modified (see fig.5 later) this change
of slope testify that the reactor was ignited. After a startup period approx 20 minutes
long a second where the reactor power was almost constant taking the water to ≈75
°C a second kink is found when the reactor fully ignites rising the measured
temperature at 101.6 +/-0.1 °C and transforming the water in to steam.

At this point we can try a simple calculus in order to evaluate the power produced. In
order to raise the temperature of 168 g of water by 1 °C , ≈ 168*4.185 = 703 J are
needed. The water inlet temperature was 15 °C so the ∆T was 85 °C. We have
703*85=59755 J. At this energy one must add the evaporation heat ≈2272 J/g *
168=381696 J. Total energy in 45 sec is 59755+381696=441451 J, and power is
441451/45=9810 W.

Statistical experimental errors in power estimation, due mainly to flux measurements,
can be conservatively estimated in about 1.5%. In this case we have +/- 150 W.

This result is only a lower limit of the energy produced because the system was not
completely isolated and we have not taken into account any heat loss. From the
calculation of the “produced power” when the water was at 75 °C which give a result
that is less than the electrical input power is easy to understand that this systematic
under estimation surely exceeds the statistical errors .

Before ending [Test1] all the power was reduced and then switched off from the
resistors and also the hydrogen supply was closed. No pressure decrease was noted in
the H2 bottle. Even in this conditions the system kept running self sustaining, for
about 15 minutes until it was decided to manually stop the reaction by cooling the
reactor using a large water flux (note the decrease of the water input temperature).

The main origin of possible errors in [Test1] measure was that the steam was not
checked to be completely dry. During [Test2 ] this measure was done by Dr.
Galantini a senior chemist who has used an “air quality monitor” instrument
HD37AB1347 from Delta Ohm with a HP474AC probe . Also in [Test2] a high
precision scale (0.1g) was used to weight the Hydrogen bottle (13 Kg) before 13666.7
+/- 0.1 g and after 13668.3 +/- 0.1 g the experiment. The cause of this unexpected
rise was traced to be the remnant of piece of adhesive tape used to fix the bottle
during the experiment. After careful examination of the tape the weight loss was
evaluated to be
Fig. 5 - Power adsorbed during tests in W. The time abscissa has 15min tics from
counted from the first record. Spikes in [Test 1] are due to line voltage spikes. The
anomalous behavior in [Test 2] is clear.

The average power adsorbed during [Test 2] is ≈1022W.

Conclusions

The amount of power and energy produced during both tests is indeed impressive
and, together with the self sustaining state reached during [Test 1] could be an
indication that the system is working as a new type of energy source. The short
duration of the tests suggests that is important to make more long and complete
experiments. An appropriate scientific program will be draw.
Dott. Bianchini David
  Physics Department - University of Bologna
  Viale Berti Pichat 6/2 - 40127 Bologna
                                                                                           Kind attention of
                                                                                                    EFA srl
                                                                                                    Via Marsili 4
                                                                                                  40100 Bologna
                                                                                      c.f. e P.iva: 02826781208

                                                                                       Bologna 21/01/2011

  Experimental evaluation, for radiation protection purpose, of photon
    and neutron radiation field during the public presentation of the
                 prototype called "Energy Amplifier"

PREFACE

      On 14/01/11 at the GM System plant of Via dell'Elettricista 16 in Bologna, I performed
  radiation field measurements for radiation protection purposes as per your request of
  09/11/10.
  This report is therefore about the evaluation of the photon and neutron radiation field near
  the prototype called “Energy Amplifier” during it's public presentation.

      The process, the geometry and the materials used for the production of energy inside
  the “Energy Amplifier” are unknowns that I'm not aware of. Environmental monitoring is
  defined temporally before, during and after the test in question

      The field evaluation can not relate to criteria of functionality of the system and can not
  be used for comparison in systems different from this one, in the process, in the geometry
  or in the construction materials used.

TIME DESCRIPTION OF THE TEST

     The test has been conducted without interruptions in the measures presented below,
  which therefore represent, to all intents and purposes, a continuous monitoring of the
  photon field and of the neutron field samples as summarized in table:

            ID                            Phase                            Start time         End time
             0             External environmental background                 13:10             13:20
             1             Before ignition                                   15:45             16:22
             2             Ignition                                          16:22             16:45
             3             Stability                                         16:45             17:25
             4             Switching off                                     17:25             17:55
             5             After switching off                               17:55             19:00

         Table 1: Time phases of the present measures during the presentation of the “Energy Amplifier” .
REPRESENTATION OF THE MEASURE GEOMETRY
Figure1: This is the prospective representation of the relative position between probes and the
“Energy Amplifier”. This figure can be used to represent the environment in wich the instruments
were used. Probe”1”: as describe in Table 2. Probe”2”: as describe in Table 4EVALUATION OF THE X e γ FIELD
This measure has the purpose of detecting, only for radiation protection purposes, the
X e γ radiation around the “Energy amplifier” during it's using.
This measure does not take into account in any way the internal attenuation of the
photons produced by the apparatus and can not in any way be traced back to the production
or otherwise of the photons due to the same apparatus.
METHOD
Has been defined a measurement protocol structured as follows:
● In agreement with the ICRU defininitions (International Commission on Radiation Units
and Measurements; rif. Report 57-1998), we have chosen to evaluate the ambient dose
equivalent H*(10) as a dosimetric indicator of the X and γ field;
● The ambient dose equivalent measurements have been performed in dose rate mode;
● The measurement position is not fixed but is variable around the “Energy amplifier” at a
minimum distance of measurement from the outer structure equal to d =(5±2) cm. This choice
has the purpose of monitoring the possible anisotropic radiation through the mapping of the
radiation solid angle around the system;
● The measurements have been repeated at a frequency such that the average of the values is
magnitude representative of the dosimetric values distribution;
● The average values are both temporal (time phase) and spatial (different positions of
measurement);
● The analysis of the data is based on the comparison with the environmental background
measured in an independent temporal phase (phase 0) and in an environment reasonably far from
the “Energy amplifier” (d>50m).
MATERIALS
The measurements were performed with the following instrumentation:
● AUTOMESS 6150 AD-b (s/n 93883);
● Last calibration certificate SIT 065/R n. 9521/S/12/10 del 20.12.2010);
● Probe: zinc sulfide (ZnS scintillator) size 3”×3”;
● Measuring range 23 keV – 7 MeV;
● Resolution declared of 1 nSv/h;
● Measuring range of 50 nSv/h – 99.99 μSv/h.
Table 2: Specification data of the used instrument for the present measure.RESULTS
The measured values are shown in the following table:
Temporal Phase H*(10) [nSv/h]
0 118 ± 10%
1 107 ± 10%
2 111 ± 10%
3 115 ± 10%
4 116 ± 10%
5 123 ± 10%
Table 3: Ambient dose equivalent for each test phase as described in Table 1 (Please note that Phase 0
correspond to the background value)
The uncertainty on the measure is estimated in accordance with the methods described in ICRU
Report 76 Measurement Quality Assurance for Ionizing Radiation Dosimetry (2006).
CONCLUSIONS
From the measures it is shown that there are no evidence of meaningful differences of
H*(10) compared to the background environmental radiation.
Furthermore the dosimetric measures are not dissimilar from the environmental
background measurement both as average and as maximum peak values.EVALUATION OF THE NEUTRON FIELD
This measure has the purpose of detecting, only for radiation protection purposes, the
neutron radiation around the “Energy amplifier” during it's using.
The measure does not take into account in any way the attenuation and the
thermatization of neutrons maybe produced or present inside the apparatus and can not be
in any way be traced back to the production or otherwise of neutrons due to the same
apparatus.
MATERIALS
For the measurement we used a direct reading electronic detector described by the
following technical summary:
Manufacturer: LUDLUM
Electrometer: LUDLUM 2221 Scaler/Ratemeter SCA
Probe: Prescila 42-41 Neutron Radiation
Detector (neutron recoil scintillator)
Sensitivity declared by the 350 cpm per mrem/h;
manufacturer:
Angular dependance: 15 % in all the measure range
Table 4: Specification data of the used instrument for the present measure.
The instrument has been periodically calibrated by an accredited ENEA center that has
provided the following calibration factors:
● On 17/03/2010 (N°1N10) with AmBe source (Eneutrons = 4.4 MeV) equal to 36CPM
per μSv/h
● On 28/01/08 with di Pu-Li source (Eneutrons = 0.54 MeV) equal to 15 cpm per μSv/h
METHOD
Has been defined a measurement protocol structured in the following way:
● The evaluation of the neutron field is based on the rate measurement of the counts per
minutes (cpm) so as they are provided by the instrument, by integrating the registered counts in
60 seconds;
● The measurement position is fixed with respect to the “Energy amplifier” at measurement
distance from the external structure equal to d =(20±5)cm. This choice has the purpose to
monitoring the neutron radiation in the room in the chosen angular direction. The choice of the
position is due the instrument available space;
● The values provided are the average of the values collected in the temporal interval;
● The measurements have been repeated at a frequency such that the average of the values is
representative of the distribution of dosimetric values;● The analysis of the data is based on the comparison with the background measured in an
independent temporal phase (phase 0) and in an environment reasonably far from the “Energy
amplifier” (d>50m).
RESULTS
The results are presented in temporal rate of counts per minutes type (counts per
minutes) in the same way as what is provided directly by the instrument (average values for
each time interval in question):
PHASE CPM (counts per minutes)
0 16 ± 2
1 15 ± 2
2 16 ± 2
3 15 ± 2
4 14 ± 2
5 16 ± 2
Table 5: Count per minute values for each test phase as described in Table 1 (Please note that Phase 0
correspond to the background value)
CONCLUSIONS
From the measures it is shown that there are no evidence, within the bounds of the
instruments presented before, of meaningful differences in the measured values compared
to the background environmental radiation.
Further:
● The absence of neutron field observable from the measured background does not allow
the dosimetric analysis for a comparison with the calibration values associated with the
instrument.
● The measure results are not dissimilar from the environmental background both as
average and as maximum values.
In faith
Dott. Bianchini DavidYou can also read