Report on Operational Targets for Non-Performing Exposures
←
→
Page content transcription
If your browser does not render page correctly, please read the page content below
Report on Operational Targets for Non-Performing Exposures

                                                                                           29 March 2018

A. Asset Quality Metrics with end-December 2017 data
At end-December 2017, the stock of Non-Performing Exposures (NPEs)1 decreased by
4.8% and 10.0% compared to end-September 2017 and end-December 2016,
respectively, and reached €95.7 billion or 43.1% of total exposures2. The reduction of
NPEs over the past quarter was the highest quarterly reduction since the beginning of
the crisis. Compared to March 2016, when the stock of NPEs reached the peak, the
reduction is 12% or €13 billion.
The reduction of NPEs over the past quarter is driven by write-offs which amounted to
€2.1 billion and sales which amounted to €1.8 billion3. Total write-offs and sales for the
whole year reached €6.5 billion and €3.6 billion respectively. In addition and contrary
to the trend observed in 2017, the quarterly cure rate improved at 1.8% and exceeds
the default rate that shows a decelerating trend at 1.7%. The performance in
collections and liquidations is also slightly better compared to the previous quarter.
Better performance is noted in the consumer and business loan portfolios, where the
quarterly reduction was 14.8% and 4.4% respectively. The performance in the
mortgage book was subdued, as banks recorded a quarterly reduction of only 0.6%.
The overall reduction achieved in 2017 in the business portfolio reached 12.3% and a
sizeable 19.7% in the consumer portfolio, whereas, in the mortgage book an increase
of NPEs by 0.4% was noted.
The percentage of NPE obligors that have applied for legal protection remains
significant. On aggregate 13.9% of NPE obligors have applied for legal protection, while
the highest level of protection is observed in the mortgage portfolio, where the
percentage exceeds 30%.

1
  Non-Performing Exposures include loans more than 90 days past due and loans whose debtor is
assessed as unlikely to pay its credit obligations in full without realization of collateral, regardless of the
existence of any past due amount or of the number of days past due (ΕΒΑ, Annex V. Part 2. 145-162).
2
  Amount includes off-balance sheet items. Non-inclusion of off-balance sheet items and a current loan
to the Greek State (which has been excluded from target-setting), the stock of NPEs is reduced by 4.8% in
the fourth quarter of 2017 at €94.4 billion or 48.6% of total exposures.
3
  Note that sales include a total amount of €1 billion that is related to a sale of loans’ transaction; the
bank initially classified these loans as assets held for sale in Q4 2017 and then completed the transaction
in Q1 2018.

                                                                                                             1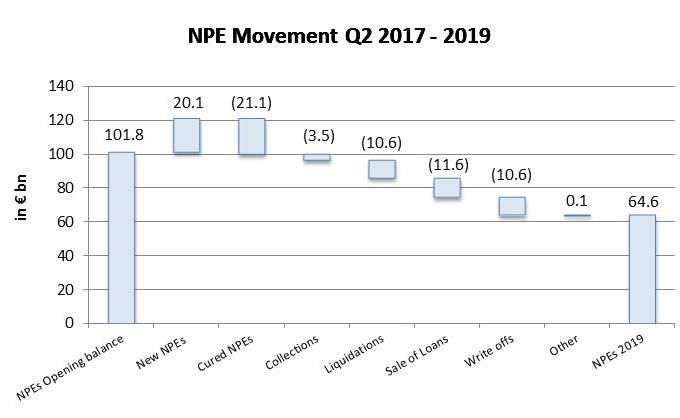
The NPE ratio still remains high across most asset classes. For end-December 2017, the
     NPE ratio is 43.4% for residential, 49.3% for consumer and 41.8% for the business
     portfolio. For the business portfolio, specifically, the highest NPE ratio is noted in the
     Small Business and Professionals (SBPs) segment (NPE ratio at 65.4%) and the Small
     and Medium-Sized Enterprises (SMEs) segment (NPE ratio at 57.0%). Similar to
     previous quarters, better performance is noted in the Large Corporate (NPE ratio at
     22.9%) and Shipping (NPE ratio at 35%) segments.
     Provisions coverage at system level is decreased marginally at 47.4% in December 2017
     from 48.0% in September 2017, mainly due to the high quarterly write-offs and sales of
     loans, which were almost fully covered in their majority. Including the value of
     collaterals (reported up to the gross value of the loan), we see that NPEs are almost
     fully covered.

     B. Revised Operational Targets set by the banks
     According to the NPE operational targets, framework banks should provide at the end
     of September each year the values for the four quarters of the coming year. They are
     also allowed to revise their targets in order to align with potential changes in the
     operating environment and/or changes in their NPE strategies.
     The table below summarizes the development of key operational targets and metrics
     for the total portfolio for the period from June 2016 up to December 2019 (amounts
     are in €billion). Note that “NPLs” refer to loans more than 90 dpd. Data reported for
     June 2016 and June 2017 are actual:

                               June    June    Sept    Dec     March   June    Sept    Dec     2019
                               2016    2017    2017    2017    2018    2018    2018    2018

Target 1: NPE Volume (Gross)   106.9   101.8   99.9    95.9    93.6    90.2    87.6    81.5    64.6

Monitoring: NPE Ratio          50.5%   50.6%   49.9%   48.5%   48.1%   46.9%   45.9%   43.1%   35.2%

Target 2: NPL Volume (Gross)   78.3    72.8    70.2    65.9    63.9    60.6    58.0    52.0    38.6

Monitoring: NPL Ratio          37.0%   36.1%   35.1%   33.3%   32.8%   31.5%   30.4%   27.5%   21.1%

     In June 2017, banks outperformed their NPE target that was set in last year’s
     submission by €1.6 billion. Consequently, the opening balance for NPEs of Greek
     commercial and cooperative banks for the new targets setting period (June 2017 –
     2019) was €101.8 billion (these exposures do not include off-balance sheet items of
     approx. €1 billion). Banks are now targeting for a 37% reduction of their NPEs within

                                                                                               2
the above mentioned period (June 2017 – 2019), reaching €64.6 billion in 2019. This is
a more ambitious target compared to previous submission by €2.2 billion.
Additionally, the tables below show the development of selected operational targets
and metrics for the three main asset classes, i.e. mortgages, consumer and business
loans for the period June 2017 – 2019. These are analyzed as follows:
The mortgage portfolio (amounts in €billion):
June June Sept Dec March June Sept Dec 2019
2016 2017 2017 2017 2018 2018 2018 2018
Target 1: NPE Volume (Gross) 28.1 27.8 27.8 27.7 27.5 27.1 26.4 25.3 20.6
Monitoring: NPE Ratio 41.8% 42.8% 43.0% 43.3% 43.2% 42.8% 42.2% 41.0% 34.9%
Target 2: NPL Volume (Gross) 20.7 21.1 21.1 20.9 20.5 19.9 19.0 17.6 12.9
Monitoring: NPL Ratio 30.9% 32.5% 32.6% 32.6% 32.1% 31.4% 30.3% 28.6% 21.9%
The consumer portfolio (amounts in €billion):
June June Sept Dec March June Sept Dec 2019
2016 2017 2017 2017 2018 2018 2018 2018
Target 1: NPE Volume (Gross) 15.2 13.8 13.7 11.7 10.4 10.2 9.9 8.7 6.6
Monitoring: NPE Ratio 63.8% 62.4% 62.2% 57.8% 53.2% 52.8% 52.3% 49.1% 39.7%
Target 2: NPL Volume (Gross) 12.5 11.1 10.9 9.1 7.8 7.7 7.5 6.3 4.3
Monitoring: NPL Ratio 52.4% 49.9% 49.4% 45.1% 40.3% 39.9% 39.3% 35.5% 26.1%
And, finally, the business portfolio (amounts in €billion):
June June Sept Dec March June Sept Dec 2019
2016 2017 2017 2017 2018 2018 2018 2018
Target 1: NPE Volume (Gross) 63.6 60.1 58.4 56.5 55.8 52.9 51.3 47.5 37.4
Monitoring: NPE Ratio 52.6% 52.7% 51.4% 49.9% 50.0% 48.3% 46.9% 43.4% 34.6%
Target 2: NPL Volume (Gross) 45.1 40.6 38.3 35.9 35.6 33.0 31.5 28.0 21.4
Monitoring: NPL Ratio 37.3% 35.5% 33.7% 31.7% 31.9% 30.1% 28.9% 25.6% 19.8%
3The timing of the NPE reduction has not changed and the largest part will be back
loaded and will take effect in 2018 and 2019. However, some changes in the drivers for
the reduction are noted compared to previous submission. More specifically:
- Banks intend to accelerate the sale of loans, mainly in the business portfolio and to
a lesser extent in the consumer portfolio. More specifically, banks target now for an
additional amount of €4.7 billion, thus the total amount of loan sales for the period
June 2017 – 2019 reaches €11.6 billion. Part of this additional amount of loan sales
(€1.4 billion) has already been executed in Q3 2017 through a securitization and
transfer of a non-performing loans portfolio by a less systemic bank.
- In addition, banks intend to increase the amount of write-offs by approx. €1.2
billion, primarily in the retail portfolio.
- However, compared to the previous submission, banks adjusted the targeted net
inflows of NPEs to the more conservative side. The inflows of new NPEs for the
period June 2017 to 2019 increase by €1.2 billion, whereas curing of loans is lower
by €2.5 billion. Banks have incorporated in their models worse macroeconomic
assumptions compared to the previous submission (GDP growth, disposable
income) that affected the re-default rates and the net inflows of NPEs. The lower
cure rate is to some extent attributed also to the higher amount of sales and loan
write-offs.
- The remaining factors regarding the NPE reduction have not changed compared to
the previous submission. Liquidations remain a key driver with a total outstanding
amount of €10.6 billion.
The drivers of NPE reduction for the remaining period up to 2019 are presented in the
diagram below:
4The NPEs as a percentage of total exposure will gradually decelerate and reach 35.2%
in 2019. However, this percentage is slightly higher than the previously targeted ratio
of 33.9% on the back of the difference in drivers for NPEs reduction and the lower
implied credit growth.
For the same period, the reduction in loans past due (“dpd”) more than 90 days (Non-
Performing Loans - NPLs) is set at 47%, thus from €72.8 billion in June 2017 to €38.6
billion in 2019.
The relevant NPL ratio decreases in the same period from 36.1% to 21.1%.
Furthermore, the table below illustrates the components of the NPEs’ reduction per
portfolio:
Total Mortgage Consumer Business
NPEs opening balance 101.8 27.8 13.8 60.1
New NPEs 20.1 7.3 2.5 10.3
Cured NPEs (21.1) (8.6) (2.6) (9.9)
Collections (3.5) (0.7) (0.5) (2.4)
Liquidations (10.6) (2.9) (0.2) (7.5)
Sale of Loans (11.6) (0.2) (4.1) (7.3)
Write-offs (10.6) (2.2) (2.4) (5.9)
Other 0.1 0.2 0.0 0.0
NPEs 2019 64.6 20.6 6.6 37.4
*Any differences in totals are due to rounding
Finally, the table below summarizes the contribution of each portfolio to the reduction
in NPEs for the period from June 2017 to December 2019. Compared to last year’s
submission, we note that banks target for a larger reduction in business portfolio
compared to residential and consumer:
Share of each portfolio in NPEs reduction
TOTAL Residential Consumer Business
SBP SME Corporate Shipping
100% 19% 20% 61% 16% 30% 13% 2%
In addition to target-setting over NPEs and NPLs level, more targets have been set to
monitor the banks’ performance in reducing NPEs. In specific:
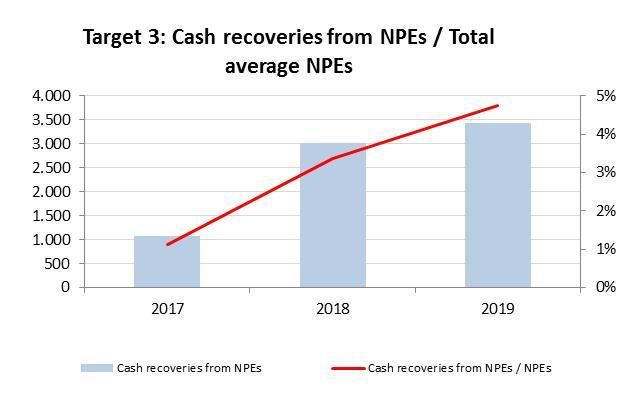
Target 3 (Cash recoveries - collections, liquidations and sales - from NPEs / Total
average NPEs) aims to monitor the results of collection efforts, as well as, the amounts
of cash collected from collaterals’ liquidations and loans’ sales. Banks’ targets are set
towards increasing collections on an annual basis, mainly targeting higher collections
5and increasing liquidation proceeds. Compared to last year’s submission, collections
have been revised downwards, especially concerning collections from customers and
proceeds from liquidations, as higher losses and write-offs are expected. The diagram
below presents the evolution of cash recoveries from NPEs throughout the years 2017-
2019:
Target 4 monitors the composition of modification solutions offered to distressed
customers, measuring the long-term (“LT”) modifications4 over the population of NPEs
and performing LT modifications. All institutions are aiming towards increasing LT
modifications, with target 4 varying from 42%-50% in 2019 from a much lower range of
20%-33% in Q2 2017. Long-term modifications are offered for a period longer than two
years and indicate more sustainable solutions that could lead to the transition of a
borrower into viability and finally into a cured status. Compared to prior year’s targets,
banks have confirmed their shift towards LT modifications, with some changes made
mostly due to the inclusion of empirical evidence in target-setting.
Target 5 monitors business loans which are over 720 dpd but not denounced as a
percentage of loans over 720 dpd but not denounced plus denounced loans. All
institutions are aiming at enhancing efforts to denounce such loans and proceed with
legal actions, with the percentage of over 720 dpd not denounced loans decreasing
significantly from Q2 2017 until the end of 2019 (from 10%-21% to 0%-6% for SMEs
and from 16%-35% to 2%-13% for Large Corporates). There are no significant
amendments compared to last year’s targets.
4
The types of long term modifications that are widely used are grouped, standardized and ranked in ECA
102/30.08.2016, in order to have data that are comparable, transparent and better monitored both per
credit institution and on a banking system level.
6Target 6, in consequence, monitors the course of legal actions taken over denounced
loans, with the target remaining at a very high level throughout the period and thus
ranging 92%-99% in 2019; again no significant amendments compared to last year’s
targets.
Target 7 monitors the SME portfolio explicitly. Specifically, target 7 examines the
percentage of active SMEs for which a viability analysis has been conducted in the last
12 months over active NPEs of SMEs. Institutions have targeted in improving
significantly in this area, increasing the percentage of viability analysis conducted up to
a range of 71%-97% in 2019, in order to offer appropriate restructuring solutions. No
significant amendments compared to last year’s targets.
Target 8 examines the efforts to implement common restructuring solutions over
common borrowers’ corporate and SME loans. The target is back loaded with the main
amount of solutions offered in 2018 and 2019. Despite the fact that the target has
been missed mostly due to the lengthy procedures, banks have revised their targets
slightly upwards, expecting common efforts for restructuring to intensify in the
forthcoming months.
Target 9, finally, aims at monitoring the amount of Corporate NPEs, for which a
specialist is engaged to implement a company restructuring plan. Accordingly, banks
have set ambitious targets, aiming at doubling the amount of such loans by 2019
compared to June 2017.
C. Comparison of actual data with Operational Targets set by the banks
Banks have submitted their December 2017 data on asset quality on the basis of the
Bank of Greece ECA 102/2016 reporting templates.
In Q4 2017, Greek banks managed once again to meet the targets for the reduction in
the stock of NPEs on a system level. More specifically, with end December 2017 data,
the stock of NPEs is €94.45 billion or €1.6 billion lower than the targeted amount. The
better than expected performance is mainly due to higher curing of NPEs, higher write-
offs and improved collections, while sales were as expected according to the banks’
target setting process. Collateral liquidations and repossessions had a minor
contribution as they stood lower than expected throughout the year.
5
Amount excludes off-balance sheet items.
7Additionally, for the second consecutive period, banks managed to achieve the target
for the stock of non-performing loans with more than 90 days past due (NPLs) which
stand at €65.1 billion or approximately €0.8 billion lower than the targeted amount.
The actual NPE ratio stands at 48.6%, approximately on target and the NPL ratio at
33.5%, only a little higher than the foreseen level of 33.3%6, mainly due to the lower
than expected volume of total loans.
Performance (in terms of targets and monitoring indicators) varies amongst the three
main asset classes, i.e. mortgages, consumer and business loans. A relatively better
6
NPE and NPL ratio have been calculated excluding off-balance sheet items and a current loan to the
Greek State (which has been excluded from target-setting).
8performance is noted in business loans, however, retail portfolios are also on track
compared to targets set.
This performance is analyzed as follows (amounts are in €billion):
December
NPE Volume (Gross) NPE Ratio NPL Volume (Gross) NPL Ratio
2017
Actual Target Actual Target Actual Target Actual Target
TOTAL 94.4 95.9 48.6% 48.5% 65.1 65.9 33.5% 33.3%
Residential 27.6 27.7 43.5% 43.3% 20.6 20.9 32.4% 32.6%
Consumer 11.5 11.7 57.9% 57.8% 8.9 9.1 44.5% 45.1%
Business 55.2 56.5 49.8% 49.9% 35.6 35.9 32.1% 31.7%
As far as cash recoveries from NPEs are concerned (target 3), it is noted that in the
fourth quarter of 2017, actual cash recoveries from NPEs over total NPEs are slightly
increased since the previous quarters of the same year and they also stood higher than
the respective target set (0.9% versus 0.6%).
Additionally, concerning the performance over the remaining targets7 with end-
December 2017 data, it is noted that most banks performed worse than targeted for
Q4 2017, especially regarding targets 5, 8, and 9.
7
The remaining targets regarding sustainable solutions and action-oriented operational targets cannot
be aggregated at a system level.
9D. APPENDIX: Technical Background
All Greek commercial and cooperative banks are included in the reporting perimeter.
The reporting perimeter is on an entity level basis and not on a consolidated group
basis (i.e. “solo basis”).
Non-Performing Exposures (NPEs8) and Non-Performing Loans (NPLs9), for the purposes
of target setting, refer to on-balance sheet loans and advances only.
The four systemic institutions10 (SIs) and the three High Priority Less Systemic
Institutions11 (LSIs) are required to submit the full set of nine operational targets and
KPIs, while the rest of the LSIs should only deliver a limited number of selected
targets12 and indicators.
The nine agreed operational targets are listed below:
- Target 1: NPE Volume (Gross).
- Target 2: NPL Volume (Gross).
- Target 3: Cash recoveries (collections, liquidations and sales) from NPEs / Total
average NPEs.
- Target 4: Volume of loans with long term modifications / NPEs+ Performing
Forborne Loans with long term modifications (PF-LTM).
- Target 5: Volume of NPEs >720 dpd not denounced13 / (NPEs >720 dpd not
denounced + Denounced).
- Target 6: Volume of denounced loans for which legal action has been initiated /
Total denounced loans.
- Target 7: Volume of active NPEs SMEs for which a viability analysis has been
conducted in the last 12 months / Active NPEs SMEs.
- Target 8: Volume of SME and Corporate NPE common borrowers14 for which a
common restructuring solution has been implemented.
- Target 9: Volume of corporate NPEs for which the bank(s) have engaged a
specialist for the implementation of a company restructuring plan.
8
NPEs include loans and advances more than 90 days past due and loans whose debtor is assessed as
unlikely to pay its credit obligations in full without realization of collateral, regardless of the existence of
any past due amount or of the number of days past due (ΕΒΑ, Annex V. Part 2. 145-162).
9
NPLs refer to loans and advances with more than 90 dpd.
10
The four SIs namely are Piraeus Bank, National Bank of Greece, Alpha Bank and Eurobank.
11
High Priority LSIs are Attica Bank, Pancretan Cooperative Bank and Cooperative Bank of Chania.
12
i.e. Target 1, Target 2, Target 4, Target 5 and Target 6, as listed below.
13
Denounced loans are loans whose contract has been called off (i.e. terminated) by the lender and the
denouncement has been properly announced to the debtor.
14
Debtors are considered as common borrowers when they have exposures to multiple banks.
10Targets and KPIs are set in total portfolio level and per asset class:
Residential Loans. In this section exposures to households for the acquisition or
the maintenance / refurbishment of residential property are included.
Consumer Loans. This section includes secured and unsecured exposures to
households for the coverage of consumer needs in the form of revolving credit
(i.e. credit cards, overdrafts and revolving consumer loans) and non-revolving
credit (i.e. exposures to households for the coverage of consumer needs with a
predetermined amortization repayment schedule).
Business Loans. This section includes exposures to businesses as described
below:
o Small Business and Professionals - SBPs. Credit exposures to
professionals and businesses with turnover less than €2.5 million.
o Small and Medium-Sized Enterprises - SMEs. Credit exposures to
businesses with turnover above €2.5 million and below €50 million.
o Corporate. Credit exposures to businesses with turnover above €50
million.
o Shipping Finance. Credit exposures to shipping finance.
11You can also read